


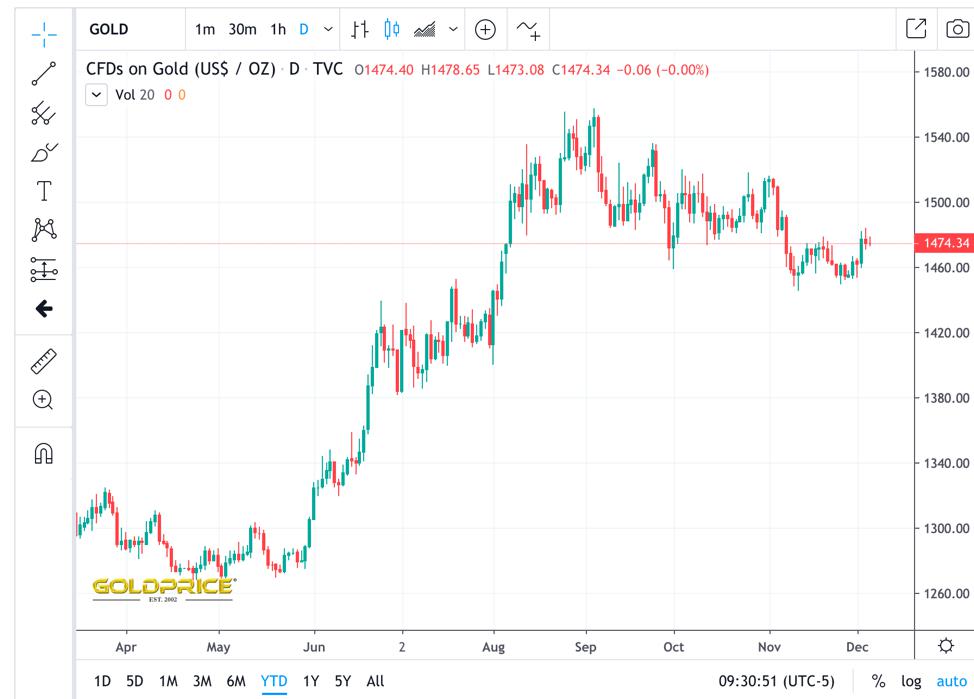
 All the signs are pointing in favour of a slow and steady uptick in the price of gold. Consolidation in the gold price has been taking place since November, after a multi-month period of price gains in August and September. Heading into mid-December, the price of gold is hovering around the $1,470 mark, with a 6-month performance (USD) of 10.20%, or $136.40. Over the past 1 year, gold has advanced by 19.05%, or $235.90 per ounce.
As the world’s favourite safe-haven commodity, gold tends to shine when uncertainty hits the markets. The stellar performance of the yellow metal is surprising, given the strong returns being generated on the Dow Jones Industrial Average, NASDAQ composite index, S&P 500 index, and the Russell 2000. Consider the exchange traded fund, SPDR Dow Jones Industrial Average ETF Trust has a year-to-date trailing return of 22.82% – a phenomenal year for stocks once again.
 Yet, gold has held its own amid a firestorm of frenzied activity on US stock markets. It is particularly notable therefore that the London Bullion Market Association (LBMA) reported on Monday, 2 December that the August holdings of gold in London’s vault amounted to 8,028 metric tonnes, at a value of $394.5 billion. This is the highest level ever, corresponding with the record-high price achieved by gold bullion in August 2019 when it was trading over $1,550.
While the gold price has tapered off marginally since then, it is still bullish. Equally significant is the August value of silver held in London’s vaults at $21.1 billion, with 35,636 metric tons of the precious metal. The LBMA wrote that all of this volume translated into 1,187,881 bars of silver and 642,277 bars of gold. The precious metals are overseen by 7 custodians, including the Bank of England (BOE) as well as board members of the LBMA.
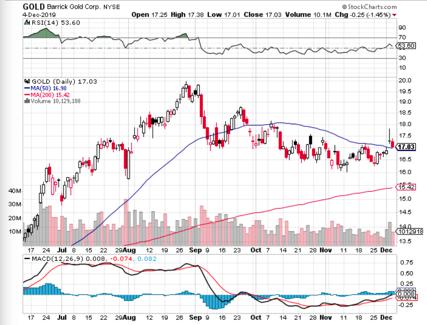
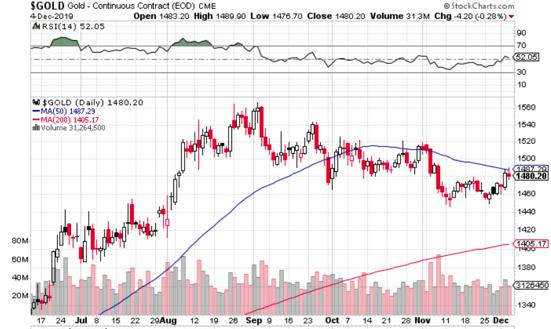
Charts for gold stocks at Barrick Gold Corporation are clearly reflective of these strongly bullish trends, with stock prices rising in June, July, August and September, and then consolidating from October to the present. Equally important are continuous contracts for gold which remain bullish, despite a slight tapering of expectations heading into the final stretch of 2019. As can be seen from the aforementioned charts, the price of gold has risen well above its 200-day moving average, and is converging towards the 50-day moving average price which was boosted by its August performance.
Gold is one of the most traded commodities in the world, particularly at a time when tensions between the US and China vis-a-vis trade wars are brewing, North Korea is posturing, and the USD is fluctuating. When we add in Bollinger Bands (an excellent technical indicator for determining price movements) it is clear that a constriction has taken place around the prevailing gold price, and gold is now priced near the upper band of the Bollinger Bands ($1487.69 for gold continuous contract EOD – CME), but not yet above it. If the price of gold rises above the upper band, this indicates that it is overbought and a correction to the downside will follow.
It is worth noting that the gold price performance percentage annual change in 2019 is the best it has been since the end of 2010. In the years immediately following the global financial crisis, gold enjoyed stellar performance of 23.4% gains in 2009, 29.5% gains in 2010, and just 10.1% gains in 2011. In the following years (2012 – 2018) the performance of gold has been lacklustre, largely due to a roaring stock market. The current year’s performance of 15.3% is notable, and likely to hold until 2019 closes out.
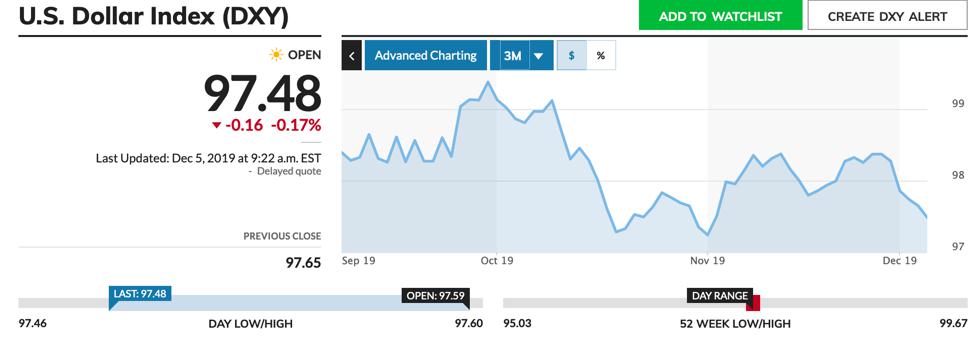
The LBMA was bullish for August, but by the time October rolled around, gold values declined by 15.7% over September, with an average settlement amount of 5,087 ounces for each transfer. In October for example, the London Bullion Market Association (LBMA) reported that there were 1,113 daily transfers, down 33.9% over September. US dollar strength is also an important factor as gold is a dollar-denominated asset. When the USD is strong, foreign buyers of gold have to spend more per unit of their currency for gold. This weakens demand. The DXY indicates a slight weakening of the USD (-0.94% over 3 months), which is helping the gold price to rally.
 Follow us on Twitter
 Become our facebook fan


Comments are closed.