


The gold miners’ stocks entered this young new year with a bang, as their leading index surged to a major breakout above multiple key resistance lines. That really strengthens the technical case that gold stocks’ next bull-market upleg is underway. This sector has been carving a textbook-perfect series of higher lows and higher highs since late November now, forming a young upleg. Those usually mature to massive gains.
The leading and dominant gold-stock benchmark and trading vehicle is the GDX VanEck Vectors Gold Miners ETF. As of the middle of this week, GDX commanded nearly 2/3rds of all the capital deployed in gold stocks through all the American gold-stock ETFs! GDX is traders’ go-to destination when looking for gold-stock-sector portfolio exposure. And its popularity is growing after last summer’s magnificent upleg.
After getting sucked into March’s COVID-19-lockdown stock panic with gold, GDX skyrocketed 134.1% higher over the next 4.8 months! But after shooting parabolic, the major gold stocks held by GDX were extremely overbought. So a normal healthy correction was in order to rebalance way-overextended technicals and sentiment. That started in early August, and ultimately proved cunning in its price action.
Bull markets are an alternating series of uplegs followed by corrections oscillating around a long-term uptrend. Every two steps forward are followed by one step back. That corrective phase is necessary to bleed off excessive greed from preceding upleg toppings. Corrections’ mission is to annihilate bullish psychology, which is accomplished by toying with bullish traders to convince them to stay fully deployed.
So during most corrections, strong countertrend rallies disguise their true nature. Traders wearing rose-tinted glasses are deceived into believing a correction isn’t happening or it has largely passed quickly with minor losses. They then ride it most of the way down maximizing their financial pain. The best defense against being duped by a correction is maintaining perspective, which comes from studying past ones.
All this is important because gold stocks’ major breakout this week pretty much formally staked their recent correction. Until that happened, this sector had remained trapped in its correction downtrend despite GDX’s solid gains since late November. This chart looks at the gold-stock-bull technicals over the last couple years through that GDX lens. This week’s gold-stock developments are a major milestone.
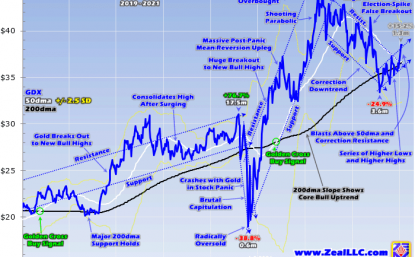
The significance of this week’s GDX major upside breakout is most apparent within the context of its preceding correction. GDX’s last upleg peaked at $44.48 in early August, again after more than doubling in a matter of months. The initial selloff was hard and fast, GDX reversed violently to plunge 12.2% in just four trading days. I warned about that new correction soon after while analyzing gold miners’ quarterly results.
Technically a correction is a 10%+ selloff after an upleg, so there was no disputing one was underway. But GDX bounced sharply after that quick initial plunge, surging 9.9% higher in the next four trading days. So by mid-August, GDX was back to just 3.5% under its 7.5-year secular high seen less than two weeks earlier. So traders not sufficiently hardened by experiencing past gold-stock corrections figured it was over.
The GDX price action over the next several weeks certainly fostered that view. Rather than selling off, GDX was consolidating high. Consolidations accomplish the same sentiment and technical rebalancing as corrections, but take much longer to do so. Higher price levels after shallower selloffs enable greed to fester for extended durations. There’s always a tradeoff between selloffs’ depths and their longevities.
After trading gold-stock upleg-correction cycles for decades, I didn’t believe this latest correction was over yet in early September. I explained this in an essay then called Gold-Stock Correction Mode, which sure wasn’t popular with duped traders. One key reason was GDX had still only sold off 12.2% at worst, which was far too mild for a gold-stock correction. This bull’s previous three averaged way-more-serious 36.5% losses!
The dominant primary driver of gold-stock prices is gold, and its own correction at that point also looked too immature relative to bull precedent. So I concluded back then that “…with gold stocks remaining very overbought technically, and greed still elevated after an insufficient selloff, a resurgent correction is likely. That could easily extend to 25% in GDX, another 20% lower from this week’s levels.” Boy was that mocked!
Successfully multiplying wealth in the markets requires buying relatively-low before later selling relatively-high. But that can only be accomplished by being contrarian, fighting the herd to do whatever is least popular at any time. When most gold-stock traders fervently believed a mere 12.2% GDX selloff over just four trading days was enough after a massive 134.1% upleg, the contrarian trade was to short gold stocks.
We were doing that at the time in our newsletters, with inverse-leveraged gold-stock ETFs and gold-stock-ETF put options. Our many long gold-stock and silver-stock trades had been stopped out at big-to-huge realized gains in late July to late August as this sector started rolling over into correction mode. When gold-stock uplegs become too euphoric and overbought, it is prudent to ratchet-up trailing stop losses.
Tighter stop percentages enable traders to ride uplegs as long as possible, while still maximizing gains when they inevitably roll over and fail. During that last upleg, 17 and 9 stock trades in our weekly and monthly newsletters were stopped out at average +81.3% and +83.6% absolute realized gains. Those annualized to huge +303.9% and +334.9% averages! With all that cashed out, we could play the short side.
But GDX continued consolidating high into mid-September, extending that greed-fostering drift for over a month. With most traders convinced the selloff danger had passed, the lying-in-wait correction struck with a vengeance. In just five trading days GDX plunged another 12.2%, taking it to a new correction-to-date low of $37.63. But that only made for a 15.4% total selloff, still way under that 36.5% bull-to-date average.
Naturally correction worries flared again after that sharp drop, greed faded as fear mounted. But these necessary rebalancing selloffs are most effective at accomplishing their missions when they can lure the most traders into complacently staying deployed. There’s nothing like suffering big losses to shatter the greed from upleg toppings. Those are only possible when corrections sucker traders into thinking they are over.
Thus countertrend rallies within corrections are often incredibly strong, keeping the flame of greed alive. By mid-October GDX had rallied back 8.8%, and was only 7.9% below its early-August peak. That yet again led many gold-stock traders to conclude the worst of the selling was behind them. But if they had consulted a chart for essential perspective, they would’ve noticed the solidifying correction downtrend.
By that point GDX had carved two lower highs and two lower lows, which is evident in this chart. So we held on to our gold-stock-short trades and refused to go long any gold stocks or silver stocks at all. The correction still hadn’t done anywhere close to enough work to eradicate greed and overboughtness. That proved wise, as over the next couple weeks into late October GDX fell another 10.8% to a new correction low.
But even at $36.52, this leading gold-stock benchmark was still only down 17.9% from early August. That was getting closer to the right magnitude for gold stocks, but was still on the small side. Although GDX bounced a bit out of that selloff, the most-challenging time in the correction was still coming. It hit right in the wake of early November’s US elections, where the results weren’t quite what traders were expecting.
Remember polling leading into that voting showed Democrats crushing Republicans in both chambers of Congress and the presidency. But once the votes were counted, that blue-wave sweep didn’t materialize. Democrats lost a relatively-large number of House seats, leaving their majority very narrow. And before this week’s Georgia Senate runoffs, Republicans looked like they were going to keep that upper chamber.
So a couple days after early November’s elections, traders figured a divided government made another big pandemic-stimulus spending bill much less likely. Thus they reasoned the Fed would have to step in with even more quantitative-easing money printing. So GDX rocketed 7.2% higher to $41.23 that Thursday on a 2.5% gold surge. That blistering post-election spike was definitely a breakout from GDX’s downtrend!
That was without a doubt the most-psychologically-challenging day of that correction for contrarian gold-stock traders trying to maintain perspective. The hobbled-Congress-Fed-money-printing arguments were sound, and very bullish for gold and its miners’ stocks. The gold-stock correction could very well have been over, despite still being shallow and short. But one key trading rule saved contrarians from buying high.
Breakouts need to be confirmed, meaning gold-stock prices need to spend a few trading days well into that upside-breakout territory. News-driven spikes above correction-downtrend resistance lines aren’t terribly uncommon. The real test is whether they are sustained after whatever the catalytic news was soon starts to fade from traders’ minds. GDX needed to hold those levels before green lighting buying.
It looked to on the day after that post-election spike, with this leading gold-stock benchmark enjoying a 0.5% follow-up gain. But in the next couple trading days after that, GDX collapsed 6.2% and 3.4% which hammered it well back into its correction downtrend! So that election-spike breakout was proven false within three trading days. Since the news lifecycle is so fast, news-driven breakouts are more suspect anyway.
After that election-spike high failed to hold, gold stocks just crumbled over the next several weeks or so. Traders finally realized the correction had duped them, it remained alive and well despite the sharp gold-stock rallies within. By November 24th in that usually-quiet Thanksgiving week, GDX had fallen another 19.3% to a deep new correction low of $33.42! That extended that total selloff to 24.9% over 3.6 months.
I finally decided to bite that day, adding the first new long-gold-stock trades in our weekly newsletter since late June. That gold-stock correction hitting my months-old 25% downside target was a minor factor. Much more importantly, GDX had been battered back under its 200-day moving average which is strong support in bull markets. The major gold stocks were finally oversold, and sentiment was pretty darned bearish.
While I wasn’t convinced gold stocks’ correction was over that day, trading campaigns for subsequent uplegs are best layered in across a couple months. The idea is to attempt to straddle the actual bottom by buying in relatively-low both before and after it. Gradually adding new trades during a likely bottoming is the highest-probability-for-success way to redeploy near correction-low prices. So we started doing that.
Major upleg toppings and correction bottomings are never certain in real-time. They only become known well after the fact, after ensuing price action proves them out. And GDX’s strong uptrend since late November is increasingly solidifying the technical case that a new gold-stock upleg is indeed underway. Those correction lows are looking ever more decisive with each passing day, a very bullish omen for this sector.
Like a correction is a downtrend formed by a series of lower highs and lower lows, an uptrend is drawn by sequential higher lows and higher highs. And that is exactly what GDX has achieved over the last six weeks or so, oscillating around its major 200dma support to coalesce into a new uptrend. That December price action was so encouraging we kept adding new gold-stock and silver-stock trades as GDX recovered.
Those now number 10 and 6 in our weekly and monthly newsletters since this sector’s late-November bottoming. But despite several higher lows and higher highs GDX carved since then, there was one nagging technical doubt. Right up until year-end, this dominant gold-stock benchmark remained stuck in its correction downtrend and under its 50-day moving average. Was that just another countertrend rally?
Two prior times in its recent correction, GDX had climbed from the lower support to the upper resistance of its downtrend. This latest mostly-December rally was the third. While redeploying in beaten-down high-potential fundamentally-superior gold stocks was still prudent even if that correction hadn’t yet given up its ghost, deeper lows would’ve been painful. Loose trailing stops should’ve enabled us to ride them out.
The major gold stocks entered this young new year still in their correction downtrend and still under GDX’s 50dma, which is another strong overhead-resistance zone in corrections. So there was a good technical case that rebalancing selloff was still biding its time. But on the first trading day of 2021, the odds of that collapsed. Right out of the gates, GDX blasted 6.9% higher to a major new upleg high of $38.51!
That further fleshed out this apparent new upleg’s uptrend, which is very clear in this chart. That extended GDX’s higher-high streak since late November’s trough to $36.50, $37.29, and $38.51, nicely complementing its parallel higher lows of $33.42, $34.29, and $35.28. But more importantly technically, that January 4th surge blasted GDX decisively above both its downtrend resistance and 50dma on no news!
Remembering the election-spike false breakout, I didn’t get too excited about this latest breakout when it happened this Monday. But on both Tuesday and Wednesday, GDX held those new highs closing right up there at $38.50 and $38.45. That made for several trading days in a row confirming this major upside breakout, which didn’t happen in early November! And gold stocks are unusually-resilient compared to gold.
The major gold stocks and thus GDX tend to mirror and amplify gold’s own price action by 2x to 3x. That election spike quickly collapsed when GDX plunged 6.2% on a brutal 4.4% gold down day. Though mild 1.4x downside leverage, that knocked GDX back into its downtrend. On this Wednesday January 6th, gold suffered a big 1.5% down day. Normally GDX would plunge 3.0% to 4.5% on that, impairing its breakout.
Yet gold stocks all but ignored gold’s latest drop! GDX merely shed 0.1% on close that day, making for trivial 0.1x downside leverage which is pretty rare on a sharp gold fall. And as I pen this essay midday Thursday, GDX continues to hold near $38.00 well into breakout territory. This is increasingly looking like the real deal. And if that proves true, gold stocks’ next major upleg portending big gains is already well underway.
GDX soared 134.1% higher in last summer’s upleg, and 76.7% higher in the one before that. This bull’s four uplegs so far have averaged massive 99.2% gains! Another doubling from late November’s low isn’t a stretch at all, especially with central banks printing money like there is no tomorrow which is super-bullish for gold prices. So far GDX has only climbed 15.2% at best in this likely upleg, which isn’t much yet.
That means fundamentally-superior gold stocks and silver stocks can still be bought relatively-low, before this next move higher really gathers steam and entices in big capital. While there are no certainties in the markets, the GDX technical action since late November culminating in this week’s dual downtrend-resistance and 50dma breakouts really increase the odds that gold stocks’ recent correction indeed ended then.
At Zeal we walk the contrarian walk, buying low when few others are willing before later selling high when few others can. We overcome popular greed and fear by diligently studying market cycles. We trade on time-tested indicators derived from technical, sentimental, and fundamental research. That’s why all 1178 stock trades recommended in our newsletters since 2001 averaged hefty +24.0% annualized realized gains!
To multiply your wealth trading high-potential gold stocks, you need to stay informed about what’s going on in this sector. Staying subscribed to our popular and affordable weekly and monthly newsletters is a great way. They draw on my vast experience, knowledge, wisdom, and ongoing research to explain what’s going on in the markets, why, and how to trade them with specific stocks. Subscribe today and take advantage of our 20%-off sale! There’s no better time than around a correction-bottoming buying opportunity.
The bottom line is gold stocks kicked off 2021 with a major upside breakout. The leading gold-stock ETF finally burst decisively above its recent correction’s downtrend resistance and 50-day moving average this week. And the major gold stocks have confirmed that breakout since by holding those high levels despite a big gold plunge. All this really increases the odds that gold stocks’ next bull upleg is indeed underway.
On average major-gold-stock prices doubled during each of this bull’s prior four uplegs! So a likely young fifth one starting to power higher offers great opportunities for contrarian traders to multiply their wealth again. The gold miners are making money hand over fist with these high prevailing gold prices, and the epic money printing driving them isn’t going anywhere. That’s a tasty recipe for a major gold-stock upleg.
Adam Hamilton, CPA
January 8, 2021
Copyright 2000 – 2021 Zeal LLC (www.ZealLLC.com)
 Follow us on Twitter
 Become our facebook fan


Comments are closed.