


It is very difficult to pick exact bottoms but there are many tools we can use to help us pinpoint potential bottoms.
You don’t hear technical analysts talk about fundamentals but we do for a reason. Major shifts in the primary trend are supported by fundamental shifts, though they can be very hard to spot until after the fact.
Because of our extensive study of history, we are convinced that precious metals will not begin a real bull market until the Fed stops hiking rates. The data shows that many times (though not every time) the gold stocks bottomed soon after the Fed’s final rate hike.
Yes, we’ve beaten this to death but the point is fundamentals matter.
Moving on, we are going to introduce you to a number of tools and indicators which you can use to spot potential bottoms and turning points on a shorter term basis.
The first and foremost focus should be the price action and the various support and resistance lines that are nearby.
In the chart below, we highlight the support and resistance areas.
For example, GDX last week bounced from support at $18. It faces strong resistance above $20. A loss of $18 would likely lead to a test of support in the $16s. GDXJ meanwhile, bounced from its September low at $26. It faces strong resistance near $30 and if it loses the recent low could test support in the $22-$24 range.
1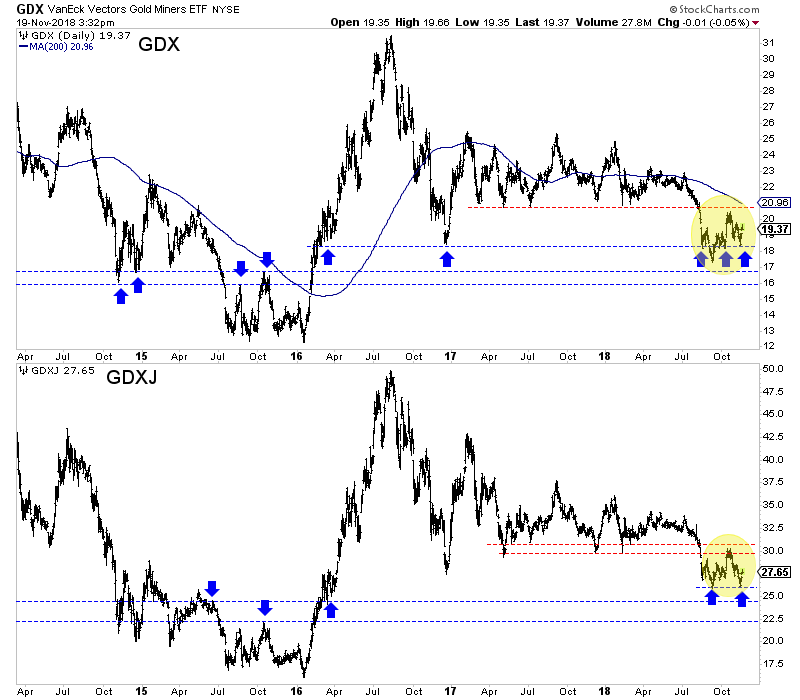
After considering the price action and important support and resistance levels, we turn to the breadth indicators which provide us information in regards to participation and sector divergences.
We plot GDX below along with its advance decline (A/D) line, the bullish percentage index (BPI) and new highs minus new lows.
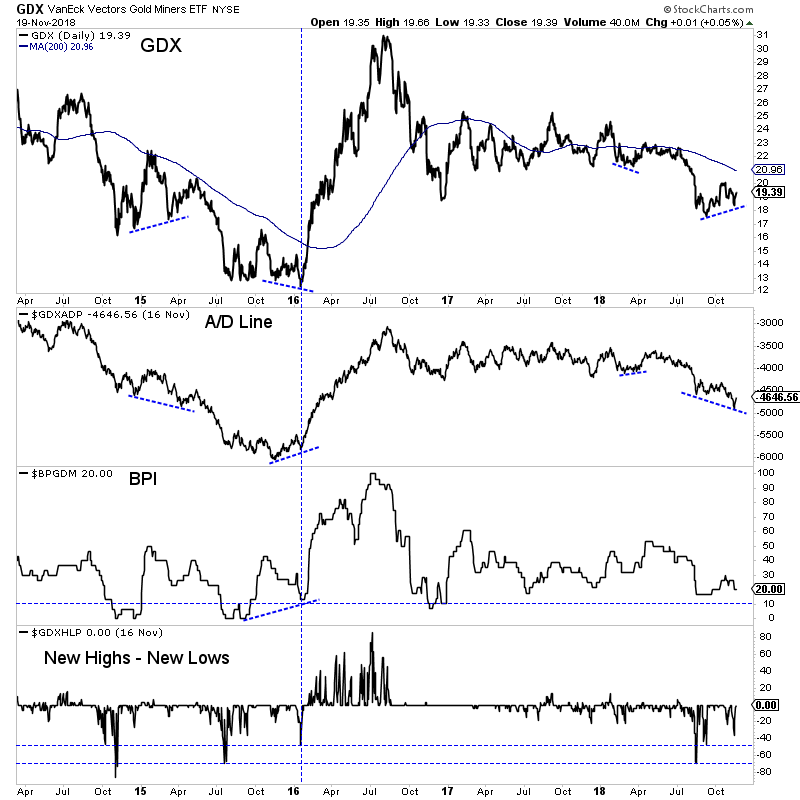
The A/D line, which is one of the most trusted leading indicators is flashing a negative divergence. It looks similar to the one in early 2015. Note that it flashed a major positive divergence in early 2016. Smaller positive divergences were seen in March 2018 and September 2018.
The BPI currently is not telling us much. It needs to fall to 10% for the sector to be considered very oversold.
Days ago the new highs minus new lows indicator hit nearly -40%, which is fairly oversold. In my opinion over -50% or even -70% tends to signal a sustained low as it did in late 2014, summer 2015 and late summer 2018.
Another breadth indicator (and one we custom made for GDXJ) is the percentage of stocks that closed above various moving averages. Below we plot GDXJ along with the percentage of a basket of 55 junior stocks (mostly in GDXJ) that closed above the 20-day moving average, 50-day moving average and 200-day moving average.
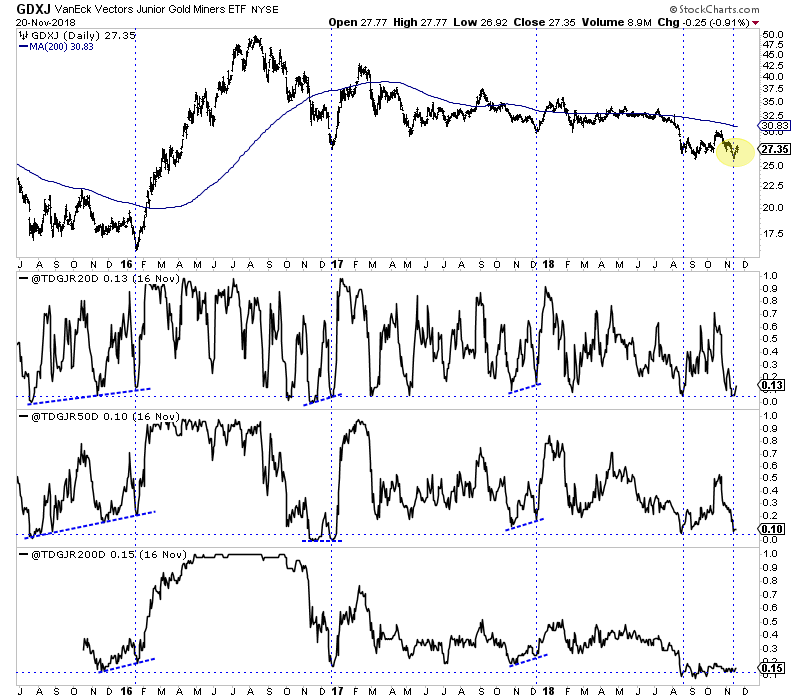
This data showed a strong positive divergence in early 2016 as well in late 2017 and to a lesser degree in late 2016. Last week it showed an oversold condition in GDXJ but no positive divergences.
In addition to breadth indicators, we can also study how the stocks are performing versus the metals and we can track various momentum oscillators.
My two favorite oscillators to study are the rate of change indicator and the distance from the moving average indicator. We plot these in the GDXJ chart below on a 20-day and 50-day basis.
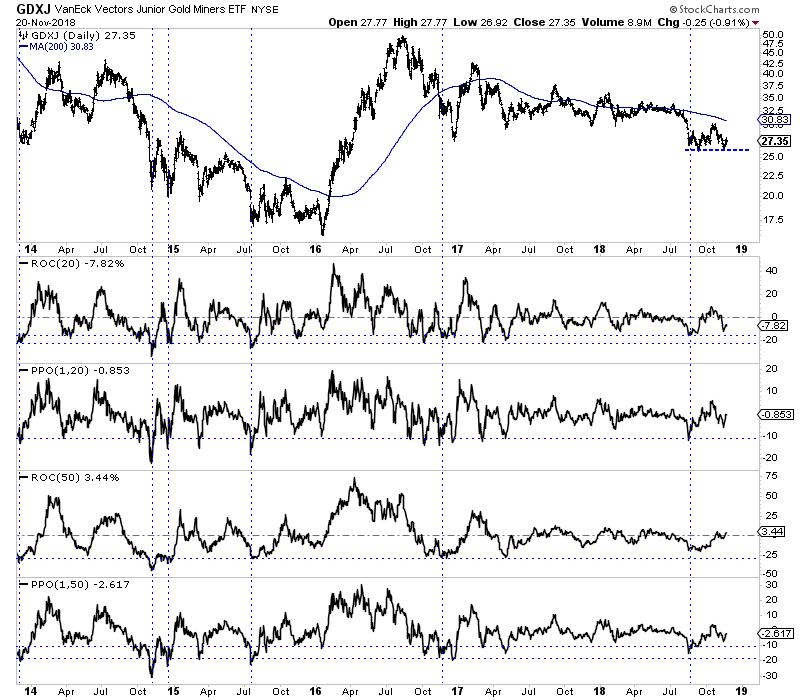
Note that the most oversold points usually occur on the first leg down or the first break of support. Subsequent tests of the same support will show a less oversold condition. That’s good if that low can hold. If not, it’s worse as the market will break to new lows in a less oversold state.
So what can we conclude from the current price action and these various indicators?
The gold stocks hit an oversold condition last week as evidenced by the very weak breadth in GDXJ and the new highs minus new lows indicator for GDX touching nearly -40%. They also hit some technical support.
However, there are no positive divergences in any of the breadth indicators and the GDX (A/D) line is flashing a serious negative divergence.
Unless December is the final rate hike for the Fed, there is little reason to expect much from the current rally. While risk may not be imminent, a break below recent lows could lead to an accelerated selloff. Consider our premium service which can help you ride out the remaining downside and profit ahead of a major bottom in the sector. To prepare yourself for an epic buying opportunity in junior gold and silver stocks in 2019, consider learning more about our premium service.
 Follow us on Twitter
 Become our facebook fan


Comments are closed.