


We started employing analog charts during the latter stages of the seemingly forever bear market in precious metals. Comparing current to past trends by using price data is not considered technical analysis but it is extremely valuable because history tends to repeat itself. It also helps us identify extremes as well as opportunities. For example, in 2015 it was clear the epic bear market in gold stocks was due for a major reversal. Today, precious metals appear to be in the early innings of a cyclical bull market and the analogs suggest there is plenty of room to run to the upside.
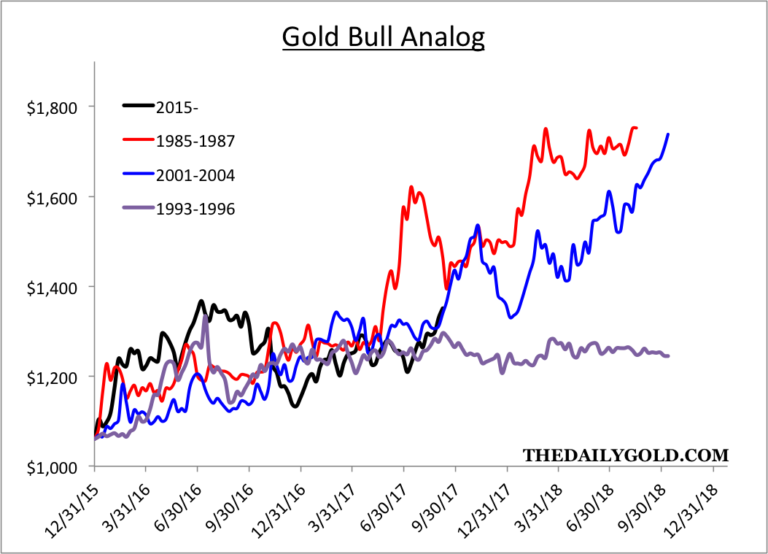
The first chart compares the current recovery in Gold to past recoveries. In recent quarters we had anticipated a similar, explosive rebound like in 2008 and 1976. However, with 18 months of evidence we can now say the current rebound most resembles the rebounds that started in 1985 and 2001. Both of those rebounds imply Gold could reach $1700/oz by Q4 of 2018. However, if Gold cannot takeout the resistance around $1375 then it could end up following the path of the 1993 rebound.
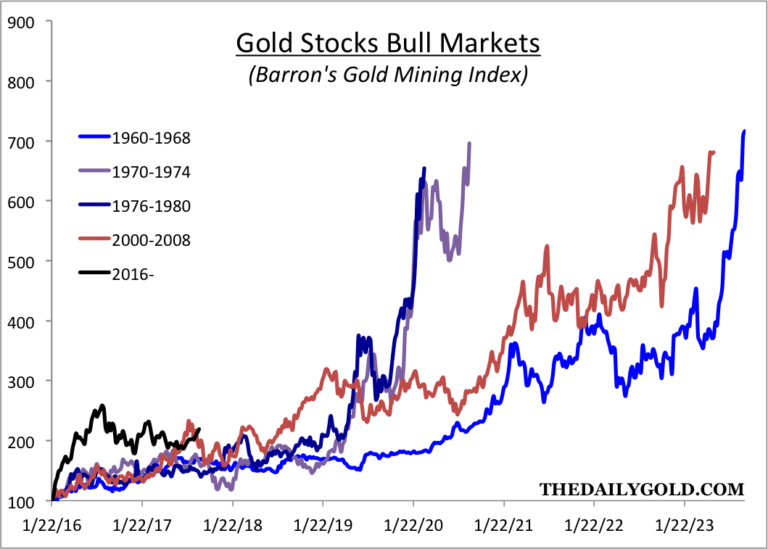
Next we look at the large cap gold stocks. The data is from the Barron’s Gold Mining Index (BGMI) which is one of the few indices with a multi-decade history. If one were to look at the HUI or GDM (parent index of GDX) it would show the gold stocks are currently behind the rebound that began in the fourth quarters of 2000 and 2008. Data from the BGMI implies the rebound in gold stocks is ahead of schedule. In a broader sense, the BGMI certainly has plenty of room to run as many of its bull markets have achieved 7-fold returns.
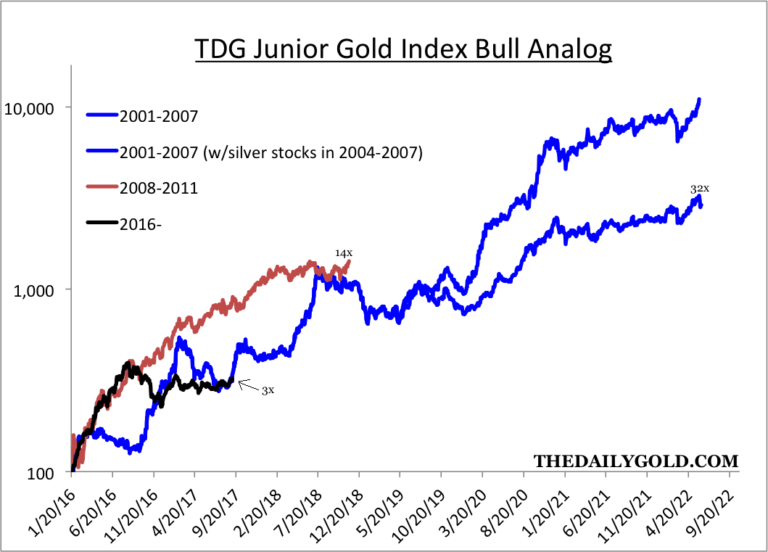
Next is an analog constructed from data from my custom junior gold indices. The juniors are currently right at the point where the 2001-2007 bull made a massive move higher over the next 12 months. The two bulls for comparison are a very long cycle (+6 years and less than 3 years). At worst, I’d expect this bull to last somewhere in between. If Gold makes a clean break above $1375/oz then I’d expect this bull to advance to the 14x peak the other bulls achieved before 2019.
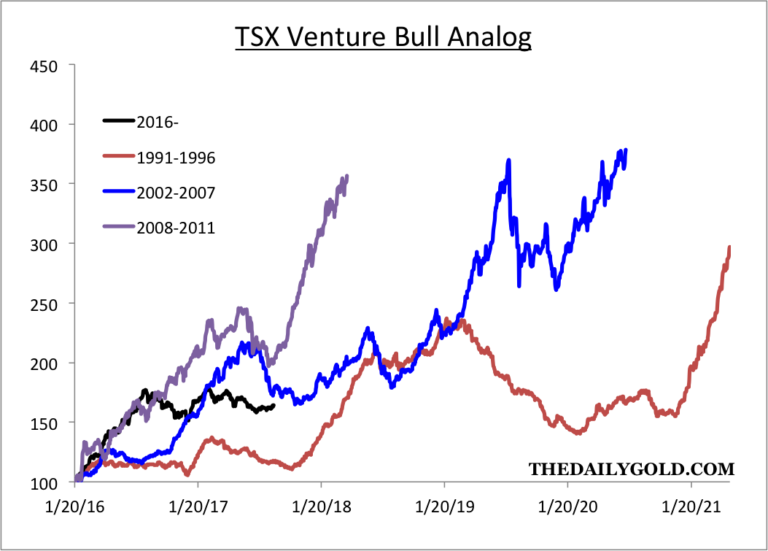
Finally, here is the TSX Venture Index. The three previous bulls averaged close to a 250% gain. The current bull is up roughly 60%. The gains for the overall index are muted as the index contains a large amount of worthless companies. Nevertheless, the bull market has plenty of room to run in terms of time and price.
The analogs show that the current bull market in Gold, gold stocks and juniors is obviously in the early innings in both time and price. Interestingly, the analog for Gold and the junior gold stocks suggests there is the possibility of strong upside potential over the next 12 months. If Gold breaks above major resistance around $1375/oz, then the juniors and large gold stocks could realize that upside potential over the next 18 months. Although the fledgling correction in precious metals could continue and expand, the broader risk to reward is skewed to the upside. Therefore, we want to accumulate the best opportunities in the juniors on weakness. To find out the best buys right now and our favorite juniors for 2018, consider learning more about our premium service.
Jordan Roy-Byrne CMT, MFTA
Jordan@TheDailyGold.com
 Follow us on Twitter
 Become our facebook fan


Comments are closed.