
Gold has firmed above $1300 in recent days and is holding comfortably above $1300 for now. We think the market will break to the upside sometime this year. The question is when. Here are 3 things to watch that will tell us if Gold is on the cusp of that break-out soon or later.
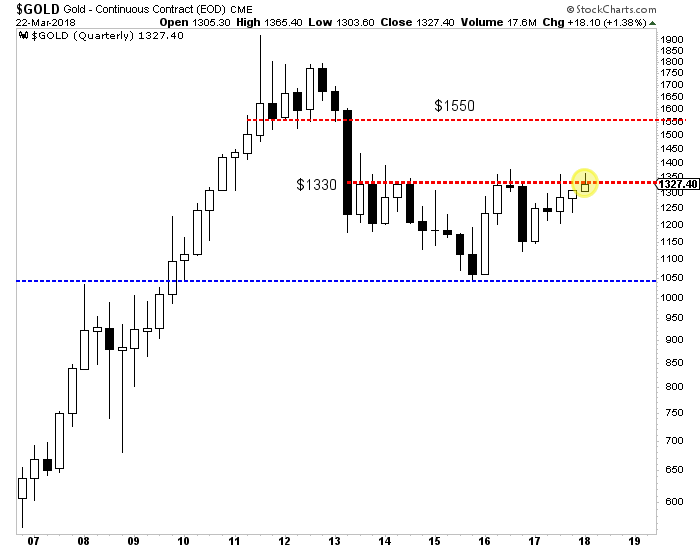
First, keep your eye on Gold’s close at the end of next week. It’s not only the end of the week and month but also the end of the quarter. While Gold has traded above $1350 multiple times in the past two years, it has not made a quarterly close above $1330 since 2012. Since this is a quarterly time frame, we would need to see a close above $1340 or even $1345 to mark a significant breakout. If Gold can make such a close next Friday then the odds are good that it could break above $1375 fairly soon.
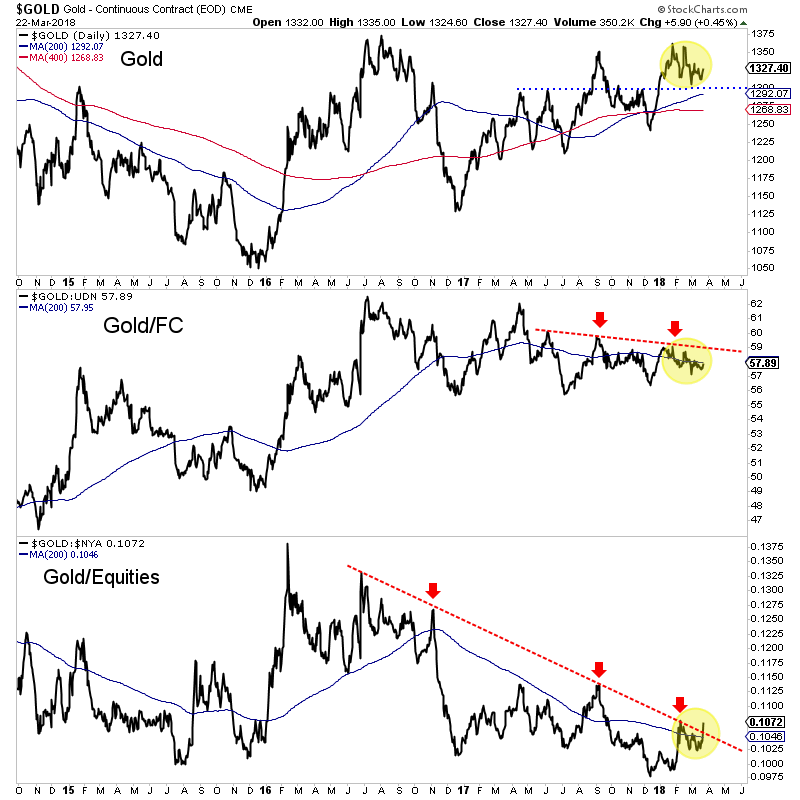
Second, (and I always beat this to death) Gold needs to break its downtrends relative to foreign currencies (FC) and equities. The Gold/equities ratio appears to be breaking out but needs follow through for confirmation. The 200-day moving average in that chart appears to have stopped declining. If the ratio can hold above the 200-day moving average then it’s obviously a bullish sign. Meanwhile, Gold/FC has work to do. Over the last 10 months, it has traded in a tighter and tighter range. That trendline resistance could go hand in hand with resistance at $1365-$1375.
Finally, on the equity side, we want to see if GDX and GDXJ can break above their “A” resistance levels which are roughly $23 for GDX and $34 for GDXJ. The miners have been relatively oversold and with improving breadth (discussed in our premium updates) they could reach the A targets, which are slightly above the 200-day moving averages. If the market is sensing a break-out in Gold then GDX and GDXJ should trend above the A targets while the 200-day moving averages would become support. A move up to the B targets over the next four to six weeks would be very bullish.

GDX, GDXJ (Daily Line Charts)
Of course, the price action in Gold itself will answer the question but these other charts can not only give an early hint but can also inform as to the sustainability of Gold’s strength. The first test will be the quarterly close next week. Then we can monitor if the Gold/equities ratio is holding its breakout and if Gold/FC is strengthening.
We have expected the move to a break-out in Gold could begin sometime in Q3. Let’s keep our eyes peeled on the above charts as the genesis of that move has a chance to begin earlier than expected. In the meantime, we continue to be patient but are accumulating the juniors we think have 500% return potential over the next 18-24 months. To follow our guidance and learn our favorite juniors for the next 12-18 months, consider learning more about our service.
If you would like to receive our free newsletter via email, simply enter your email address below & click subscribe.
 Follow us on Twitter
 Become our facebook fan
CONNECT WITH US
Tweets
Tweet with hash tag #miningfeeds or @miningfeeds and your tweets will be displayed across this site.
MOST ACTIVE MINING STOCKS
Daily Gainers
 CMC Metals Ltd. CMC Metals Ltd. |
CMB.V | +900.00% |
 Eden Energy Ltd Eden Energy Ltd |
EDE.AX | +200.00% |
| GoviEx Uranium Inc. |
GXU.V | +42.86% |
| Eagle Nickel Ltd. |
ENL.AX | +41.67% |
| Citigold Corp. Limited |
CTO.AX | +33.33% |
| Mount Burgess Mining NL |
MTB.AX | +33.33% |
| Exalt Resources Limited |
ERD.AX | +31.94% |
| Casa Minerals Inc. |
CASA.V | +30.00% |
| Cariboo Rose Resources Ltd |
CRB.V | +28.57% |
| Belmont Resources Inc. |
BEA.V | +28.57% |


