
Fed week is exciting for some. Gold bulls and bugs alike hope the Fed will do something or say something that will trigger a huge move in precious metals. It doesn’t work like that. The Fed follows the market, which for the Fed Funds rate (FFR) is the 2-year yield. The 2-year yield has been screaming higher over the past 12 months and it implies at least another two rate hikes in the future. That’s not good for precious metals and could be partly why (among other reasons) Gold and gold stocks have lost their 200-day moving averages. Whatever the reason, the short-term technicals are negative and there is risk of increased selling before a potential rebound in July.
First, let’s take a look at Gold and gold against the equity market. As we can see from the chart, Gold in June has failed twice at its 200-day moving average. That is different from 2017 when each time Gold lost its 200-day moving average, it made a V rebound back above it.
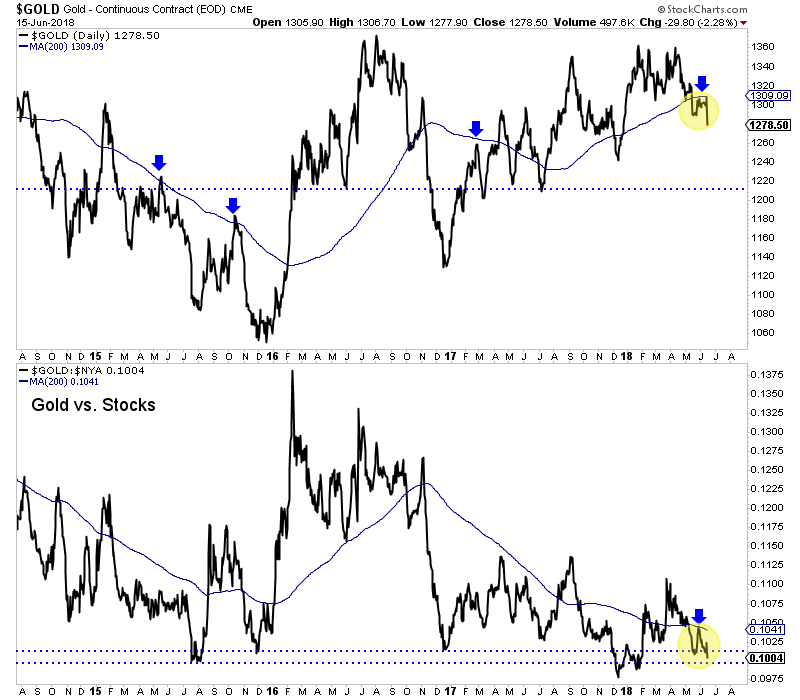
Gold’s weakness against the broad equity market is another concern. At the bottom of the chart we plot Gold against the NYSE, a broad stock market index. The ratio recently failed at its downtrending 200-day moving average and is also threatening a move to new lows for essentially the first time since 2015. (The December 2017 break was not sustained to the downside).
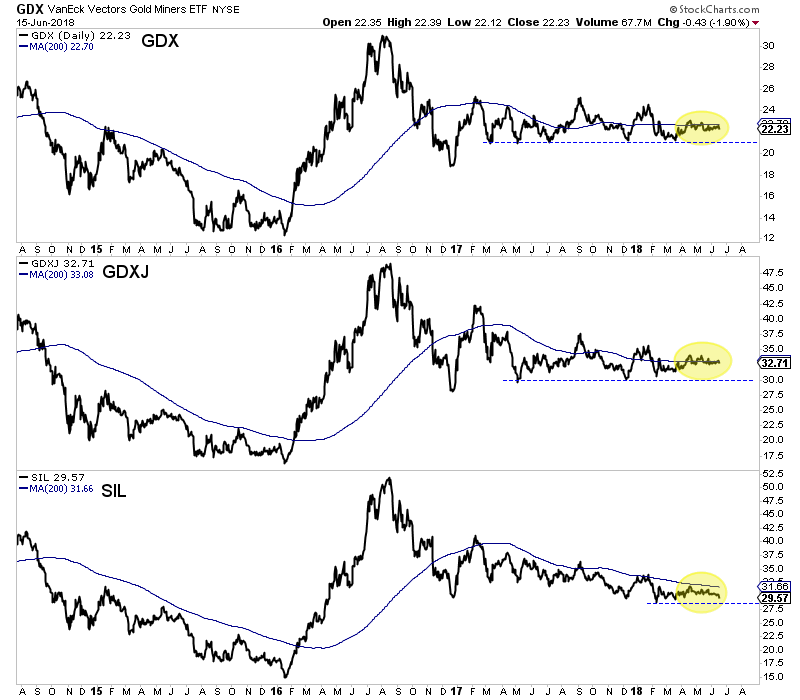
Elsewhere, the miners have spent the second quarter wrestling with their 200-day moving averages. GDX failed at its 200-dma twice in the past month, including last week. Meanwhile, GDXJ has shown a tiny bit more strength but essentially has wrestled with its 200-dma since April. The silver stocks (SIL) have been weaker as they have not traded above their 200-dma since January and could have started to breakdown on Friday by closing at 3-month low.
The immediate outlook for precious metals is negative as the price action suggests but current bearish sentiment implies a rebound is on the horizon. The summer could be playing out as we anticipated three weeks ago. An immediate move lower could push Gold to strong support around $1260 and that would put sentiment indicators into truly extreme territory. From there, it is critical that the sector recaptures 200-day moving averages. Given our recent cautious views, we have narrowed our focus to a smaller group of companies capable of performing well in this environment. To follow our guidance and learn our favorite juniors for the next 6 to 12 months, consider learning about our premium service.
- In the West, gold has rallied decently during five of the past seven recessions. I’ve suggested that the current situation in America is something like 1965 – 1970, when inflation began a long and strong up cycle.
- That’s partly why I’m adamant that it’s the best time in American history to own a portfolio (a global portfolio) of companies involved in precious metals mining and jewellery.
- The other reason that I’m excited about these stocks is that in the East, when people get richer, they buy gold. They are now getting a lot richer, and a lot faster.
- Simply put, deflation is out, and inflation is in. It’s really that simple, and investors around the world need to get positioned right now to ensure they get maximum financial benefit.
- Please click here now. With their statements and analysis, Morgan Stanley moves “thunder cash” in the institutional investor community.
- Their top US equity man, Mike “Mr. Big” Wilson, predicts that while US markets are a clear short-term buy, valuations peaked in 2017, and prices will peak in 2018.
- I’m in 100% agreement with Mike. Tactically, I’ve urged investors who are not afraid of price chasing to buy some bank stocks, energy stocks, and growth stocks. Gamblers can buy call options.
- That’s how to play the final months of upside fun in the US stock market, but investors must be seriously prepared for years of inflationary bear market horror to follow this blow-off top.
- I’ve predicted that only the most astute stock pickers will survive being invested in the US stock market from 2019 forwards. In the coming inflationary inferno, index and ETF investors will essentially be turned into tumbleweed, burning in a financial desert.
- When will the inferno begin? Well, I think it happens in the upcoming September – October US stock market “crash season”, and by year-end at the latest. I expect gold to go ballistic as that happens, because it will be an inflation-oriented meltdown, and that means institutional thunder-buying takes place in the metals.
- Please click here now. Double-click to enlarge this GDX chart. In terms of time, I think gold stocks will initially surge higher for two to three years as the stock market falls.
- Most of the gains should be sustained due to an imminent drop in US and Chinese gold mining production. Canadian, Australian, and Russian miners should be the clear leaders in what I call the gold bull era.
- Note the diamond pattern in play on that GDX chart. A drift down from it now would put GDX at my key buy area of $21 just in time for the Fed’s next rate hike. That hike will put another major nail in the US stock market valuations coffin. It will be followed at the end of June with another ramp-up in QT.
- Many investors who failed to buy the stock market in 2008-2010 and are buying now are trying to convince themselves that the Fed will back off from more hikes and QT. This is very childish thinking. Those engaged in it will soon learn the hard way that the Fed doesn’t care about their silly stock market price chase.
- On a demographics note: In my professional opinion, about 60% of the Western gold community is now composed of younger “smart money” investors. They have been invested in the US stock and bond markets and are becoming very concerned (and rightly so) about the growing risk that inflation will cause a severe bear market in these traditional asset classes.
- This new breed of gold bug has more patience than the “old guard” gold fear trade investors. The old guard focused more on financial system risk and government debt that threatened to create a kind of “parabolic moment” of vertical price rise for precious metals. The transition from deflation to insidious inflation is an enormous process that requires investor patience, but it is now well underway.
- Please click here now. Double-click to enlarge this beautiful silver chart. The silver price has been consolidating the rally from the summer of 2017 in a nice symmetrical triangle pattern. Silver is highly correlated to gold, but during periods of inflation there is also a significant correlation with sugar.
- That’s because the average “man/woman on the street” tends to see gold as too high-priced to buy. Silver’s lower price is more enticing, and they can relate to an ounce of silver rising like the price of a pound of sugar rises.
- Please click here now. Double-click to enlarge. Sugar is arguably even better than money velocity as an inflation indicator.
- Investors should watch for a two-month close over the blue downtrend line. That must be followed by a two-week close over sixteen cents a pound. That price action is likely to indicate that inflation is becoming a firestorm for the stock market and will function as a green light for most gold stocks to blast higher.
- Note the peak in the summer of 2016 for sugar. That functioned as a red light for gold stock investors. The next signal will be a green one and investors need to get prepared now.
- In contrast to the hyperinflation envisioned by older gold bugs who focused on bank and financial system risk, the type of inflation that is coming now is more like the inflation of 1966 -1975, on an even bigger scale because of rampant Chindian income growth. It’s insidious.
- This inflation will last for a hundred years and likely for much longer, not just for a decade or two like in the 1970s. It’s a process akin to millions of solid gold termites invading the US stock and bond market house. No bug spray works, so the institutional investors inside the house will all leave.
- The bottom line: If you can’t fight a gold bug invasion, you have to join it. Gold stocks will rise thousands of percentage points higher as investors begin to understand what is happening. The inflation is imminent, and investors must get prepared!
Thanks!
Stewart Thomson
Graceland Updates
Note: We are privacy oriented. We accept cheques, credit card, and if needed, PayPal.
Written between 4am-7am. 5-6 issues per week. Emailed at aprox 9am daily.
https://www.gracelandupdates.com
Risks, Disclaimers, Legal
Stewart Thomson is no longer an investment advisor. The information provided by Stewart and Graceland Updates is for general information purposes only. Before taking any action on any investment, it is imperative that you consult with multiple properly licensed, experienced and qualified investment advisors and get numerous opinions before taking any action. Your minimum risk on any investment in the world is: 100% loss of all your money. You may be taking or preparing to take leveraged positions in investments and not know it, exposing yourself to unlimited risks. This is highly concerning if you are an investor in any derivatives products. There is an approx $700 trillion OTC Derivatives Iceberg with a tiny portion written off officially. The bottom line:
Are You Prepared?
Last week we discussed the fundamentals of Gold, which do not appear bullish at the moment. Real rates (and yields) are rising and investment demand for Gold is flat. That in itself is a temporary but big missing link. However, we are referring to the missing link in the context of intermarket analysis. Gold is an asset that performs best when its outperforming its competitors. That’s true of any asset but especially Gold because it traditionally has been a counter-investment or an anti-investment. While Gold is firmly outperforming Bonds and showing strength against global currencies, it remains neutral to weak against global equities.
First, let’s take a look at Gold relative to foreign currencies (FC) and Bonds. At its 2016 peak, Gold/FC had already retraced the majority of its bear market. Last week Gold/FC managed to close at an 8-month high even as the US$ index rebounded. Gold has performed even better against Bonds and that includes dividends. A few months ago Gold relative to the major Bond ETFs (TLT and IEF) made a 3-year high. Those ratios remain above rising 200-day moving averages.
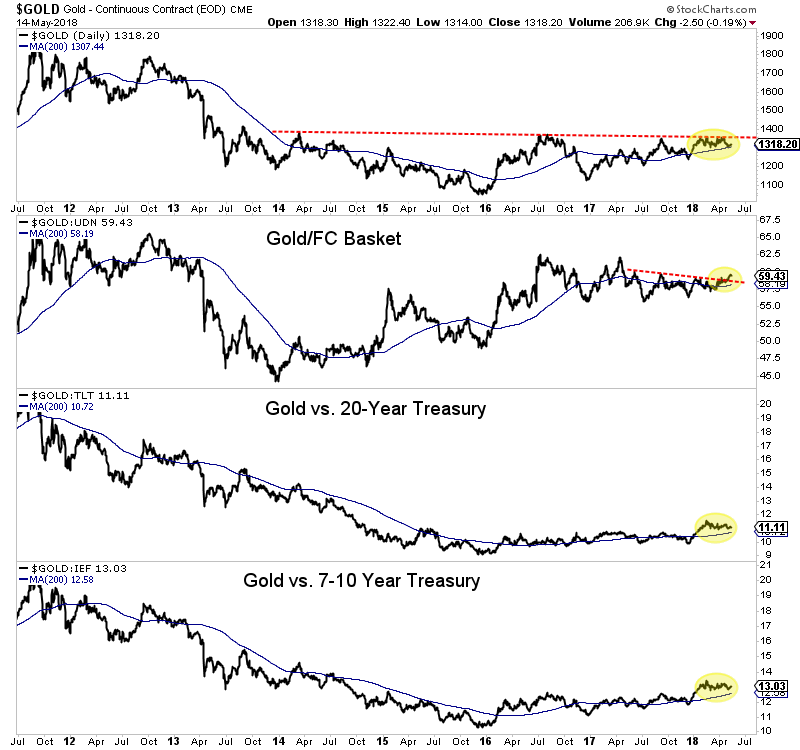
It’s important for Gold to outperform foreign currencies because if Gold is only rising because of a weak US Dollar that represents a bear market in the dollar rather than a bull market in Gold.
Gold’s outperformance against Bonds is significant because Bonds represent an enormous capital market and Bonds are in some ways the antithesis of Gold.
Unfortunately, Gold has not been able to breakout in nominal terms and from an intermarket perspective, that is because of the strength in the stock market. The ratios below show that Gold relative to global equities is trading not too far above the 2015 lows. If these ratios retested their 2015 lows they’d be trading around 10-year lows!
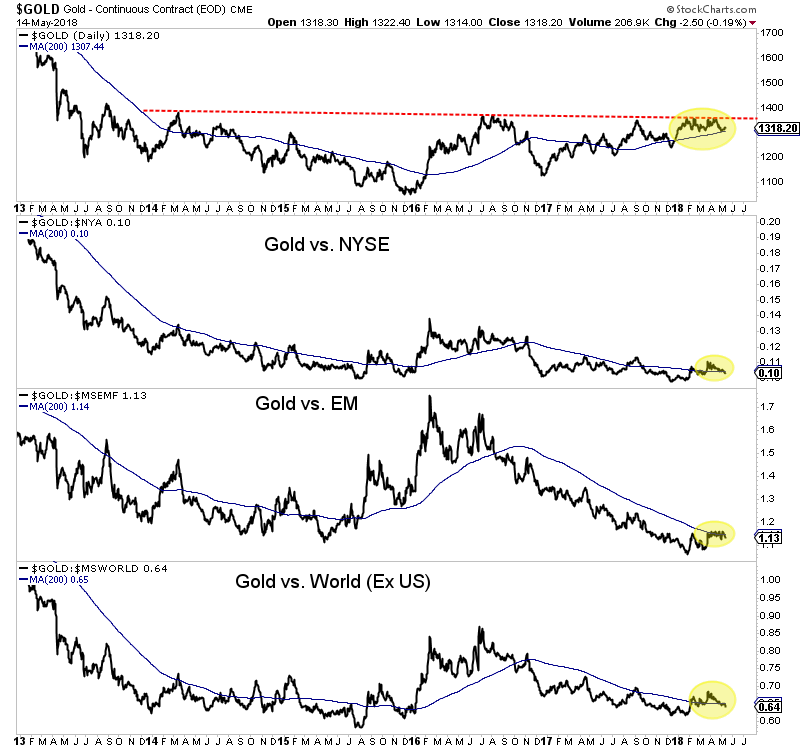
Gold vs. global equities
Gold appears to have lost the 200-day moving average relative to global equity markets but if it can maintain its outperformance against Bonds and foreign currencies then it will be setup for a powerful move when it can break to the upside relative to equities. The negative is that change does not appear imminent but the positive is when it happens Gold should begin a major leg higher. In the meantime, we continue to focus on and accumulate the juniors that have 300% to 500% return potential over the next 12 to 18 months. To follow our guidance and learn our favorite juniors for the balance of 2018, consider learning more about our premium service.
If you would like to receive our free newsletter via email, simply enter your email address below & click subscribe.
 Follow us on Twitter
 Become our facebook fan
CONNECT WITH US
Tweets
Tweet with hash tag #miningfeeds or @miningfeeds and your tweets will be displayed across this site.
MOST ACTIVE MINING STOCKS
Daily Gainers
 CMC Metals Ltd. CMC Metals Ltd. |
CMB.V | +900.00% |
 Eden Energy Ltd Eden Energy Ltd |
EDE.AX | +200.00% |
| GoviEx Uranium Inc. |
GXU.V | +42.86% |
| Eagle Nickel Ltd. |
ENL.AX | +41.67% |
| Citigold Corp. Limited |
CTO.AX | +33.33% |
| Mount Burgess Mining NL |
MTB.AX | +33.33% |
| Exalt Resources Limited |
ERD.AX | +31.94% |
| Casa Minerals Inc. |
CASA.V | +30.00% |
| Cariboo Rose Resources Ltd |
CRB.V | +28.57% |
| Belmont Resources Inc. |
BEA.V | +28.57% |


