
Gold has firmed above $1300 in recent days and is holding comfortably above $1300 for now. We think the market will break to the upside sometime this year. The question is when. Here are 3 things to watch that will tell us if Gold is on the cusp of that break-out soon or later.
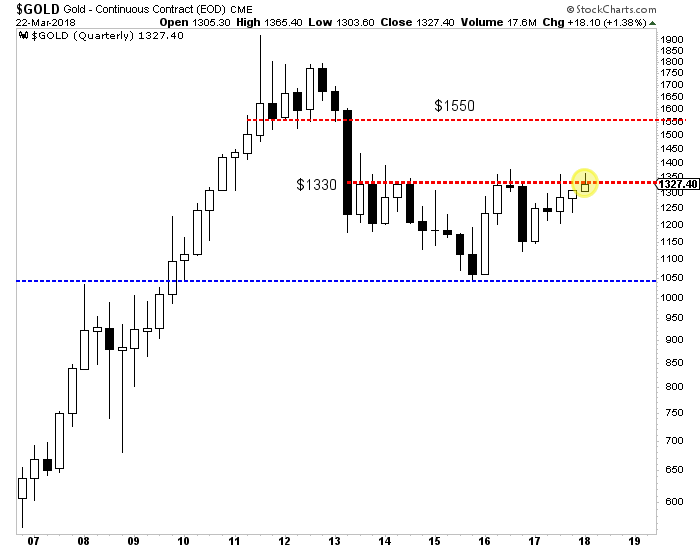
First, keep your eye on Gold’s close at the end of next week. It’s not only the end of the week and month but also the end of the quarter. While Gold has traded above $1350 multiple times in the past two years, it has not made a quarterly close above $1330 since 2012. Since this is a quarterly time frame, we would need to see a close above $1340 or even $1345 to mark a significant breakout. If Gold can make such a close next Friday then the odds are good that it could break above $1375 fairly soon.
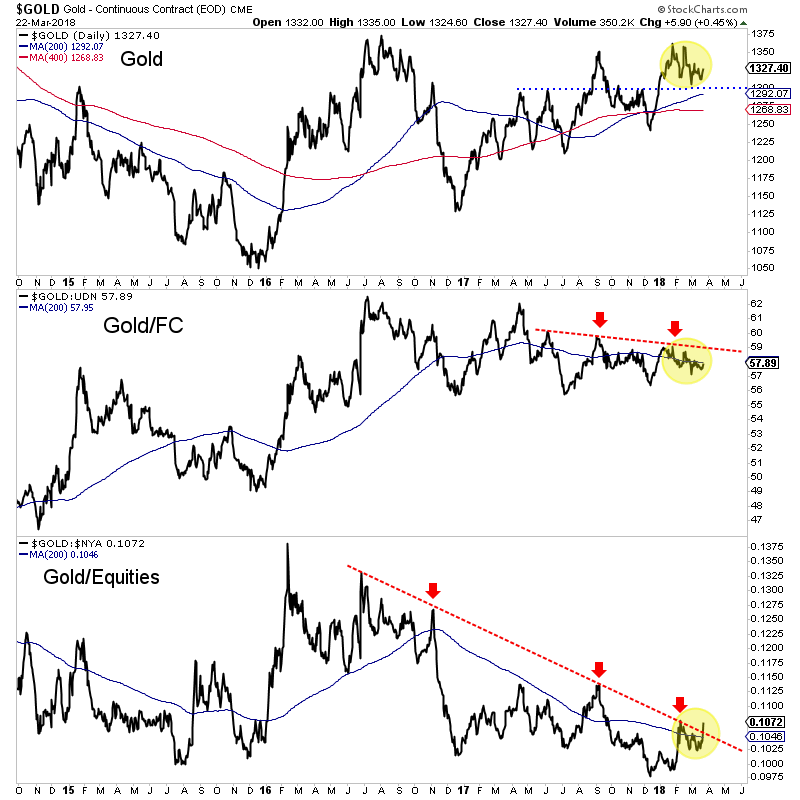
Second, (and I always beat this to death) Gold needs to break its downtrends relative to foreign currencies (FC) and equities. The Gold/equities ratio appears to be breaking out but needs follow through for confirmation. The 200-day moving average in that chart appears to have stopped declining. If the ratio can hold above the 200-day moving average then it’s obviously a bullish sign. Meanwhile, Gold/FC has work to do. Over the last 10 months, it has traded in a tighter and tighter range. That trendline resistance could go hand in hand with resistance at $1365-$1375.
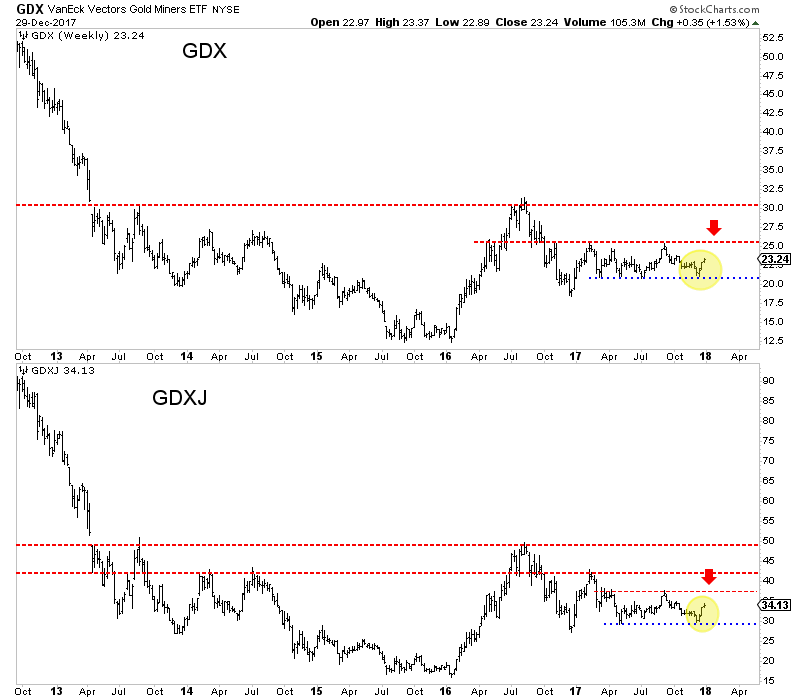
Finally, on the equity side, we want to see if GDX and GDXJ can break above their “A” resistance levels which are roughly $23 for GDX and $34 for GDXJ. The miners have been relatively oversold and with improving breadth (discussed in our premium updates) they could reach the A targets, which are slightly above the 200-day moving averages. If the market is sensing a break-out in Gold then GDX and GDXJ should trend above the A targets while the 200-day moving averages would become support. A move up to the B targets over the next four to six weeks would be very bullish.

GDX, GDXJ (Daily Line Charts)
Of course, the price action in Gold itself will answer the question but these other charts can not only give an early hint but can also inform as to the sustainability of Gold’s strength. The first test will be the quarterly close next week. Then we can monitor if the Gold/equities ratio is holding its breakout and if Gold/FC is strengthening.
We have expected the move to a break-out in Gold could begin sometime in Q3. Let’s keep our eyes peeled on the above charts as the genesis of that move has a chance to begin earlier than expected. In the meantime, we continue to be patient but are accumulating the juniors we think have 500% return potential over the next 18-24 months. To follow our guidance and learn our favorite juniors for the next 12-18 months, consider learning more about our service.

Gold’s strong upleg accelerated this week, powering to major new breakout highs. Speculators rushed to buy gold futures following surprising weak-dollar comments from the US Treasury Secretary, which hit the US dollar hard. That boosted gold to critical technical levels that should really intensify the shift back to bullish psychology. This mounting gold breakout confirms gold’s bull market is very much alive and well.
While this week’s surge put gold on many more traders’ radars, it has actually been picking up steam for 6 weeks now. Gold’s latest major interim low of $1242 came a couple days before the Fed’s latest rate hike in mid-December. The gold-futures speculators who dominate this metal’s short-term price action have always had a deep and irrational fear of Fed rate hikes. Historically gold has thrived in rate-hike cycles!
Leading into that fifth rate hike of this current cycle, these hyper-leveraged traders aggressively dumped longs and ramped shorts at record levels. That battered gold lower while exhausting potential selling. So once the Fed hiked as expected, and didn’t up its 2018 rate-hike forecast from the prior quarter’s three more, these excessively-bearish traders started buying back in. This pattern was seen around past rate hikes.
So two trading days after this latest rate hike when gold was still at $1256, I published an essay outlining why that hike was so bullish for gold. It concluded, “…Fed rate hikes are bullish for gold, and this week’s is no exception… After each past December rate hike which gold-futures speculators sold aggressively into, gold dramatically surged in the subsequent months.” And that’s indeed exactly what happened since.
By the final trading day of 2017 gold had already surged 4.9% out of its pre-rate-hike interim low. Those strong gains continued in this young new year despite these extreme mania stock markets retarding gold investment demand. By this Tuesday, gold’s new upleg extended to an 8.0% gain over nearly 6 weeks. Since the Fed’s rate hike, gold had rallied on 19 out of 27 trading days. Upleg momentum was already building.
Every January the ultra-exclusive World Economic Forum is held in Davos, Switzerland. It attracts the world’s most powerful people, from CEOs to top political leaders to billionaires. The financial media flocks to the Swiss Alps to interview these leading movers and shakers. One of this year’s attendees is Steven Mnuchin, Trump’s Treasury Secretary. He gave an interview in Davos which shocked currency traders.
Mnuchin told reporters, “Obviously a weaker dollar is good for us as it relates to trade and opportunities.” That’s certainly true, as it’s easier for American companies to export around the world when their goods are less expensive due to a lower dollar. But Treasury secretaries have a long tradition of never saying anything about the dollar beyond that they “support a strong-dollar policy”. So Mnuchin’s candor was unexpected.
Mnuchin had made similar comments last year that didn’t affect markets as much. But the combination of this past year’s strong dollar downtrend and a couple more developments that day triggered big US dollar selling. The US had just slapped tariffs on imported solar panels and washing machines hours earlier. Trump’s Commerce Secretary Wilbur Ross spoke alongside Mnuchin at that Davos conference.
Ross warned more trade measures were coming. When asked about trade wars he replied, “Trade wars are fought every single day… So a trade war has been in place for quite a little while, the difference is the US troops are now coming to the rampart.” There’s no more efficient way to boost exports and execute trade wars than jawboning the local currency lower. All this together really struck home for currency traders.
So the US Dollar Index plunged 1.0% on Wednesday following those comments, hitting its worst levels in 3.1 years. Incidentally this past year’s dollar weakness shouldn’t have surprised anyone. Back in late December 2016 when dollar euphoria reigned as the USDX traded at a 14.0-year secular high, I wrote an essay on the unsustainability of those extremes. I warned of “a major topping underway” before a new bear.
With the USDX failing below 90 on those Mnuchin and Ross comments, speculators started flooding into gold futures. After closing near $1341 in US trading Tuesday, gold surged as high as $1352 in overnight action. Those gains extended in the US on Wednesday, with gold blasting up 1.3% to $1358. That was a very important level technically and psychologically, confirming gold’s forgotten bull market is alive and well.
This chart looks at this young gold bull superimposed over speculators’ collective positions in both long and short gold-futures contracts. The Fed’s five rate hikes of this tightening cycle are also highlighted, showing how bullish they’ve proven for gold. This week’s $1358 gold levels are a major upleg breakout, and right on the verge of being a major bull-market breakout. Investors will certainly take notice of this.
Gold’s bull was born in despair in December 2015 the day after the Fed’s first rate hike in 9.5 years. The gold-futures speculators had freaked out leading into that FOMC meeting, fleeing longs while rushing to add shorts. That hammered gold to a 6.1-year secular low. Just a few trading days before that hike when gold was despised, I published deep research showing how gold thrived during past Fed-rate-hike cycles.
Futures speculators were betting the other way, expecting gold to collapse once the Fed ended ZIRP. It didn’t take them long to realize the error in their ways though, as they quickly started buying to cover their excessive shorts while flooding into new longs with a vengeance. So gold soared 29.9% higher over the next 6.7 months, well exceeding the +20% new-bull threshold! That initial bull upleg peaked at $1365 in July 2016.
After such a blistering run, gold needed to take a breather and consolidated high for over a quarter. But that rolled over into a severe correction on two separate events. First gold-futures stops were run which blasted this metal back down to its 200-day moving average. After that gold bounced sharply, but that was truncated by Trump’s surprise election win in early November 2016. That unleashed epic Trumphoria.
Stock markets surged on hopes for big tax cuts soon from the newly-Republican-controlled government. That led futures speculators and investors alike to flee gold, crushing it sharply lower. By mid-December 2016 the day after the Fed’s second rate hike of this cycle, gold had plunged 17.3% to $1128. That was not a new bear though, as it fell shy of the necessary 20% loss. But psychologically it may as well have been!
That exceedingly-anomalous gold plunge in late 2016 mostly driven by the post-election stock-market surge wreaked tremendous sentiment damage. The investors who started getting excited about gold in the first half of 2016 abandoned it, assuming that sharp rally was a flash in the pan. And with the stock markets powering relentlessly higher all throughout 2017 on taxphoria, gold receded into the market shadows.
A couple weeks ago I wrote an essay delving into the selloff dynamics between stock markets and gold. Gold is a unique asset that tends to rally when stock markets sell off materially, making it the ultimate portfolio diversifier. Thus investors tend to view it as the anti-stock trade. It was actually the last stock-market correction in early 2016 that fueled gold’s powerful upleg early that year. Stocks greatly affect gold.
While gold can still rally when stock markets happen to be climbing, investors simply feel no need to diversify their stock-heavy portfolios. So they largely forget gold. Thus gold sentiment for much of 2017 remained nearly as bearish as at those deep late-2016 lows. Investors remembered gold spiraling lower after the election, and that continued to shape their opinions and outlooks on gold regardless of price action.
Gold actually fared really well in 2017 considering the extreme stock-market rally. Last year gold still powered 13.2% higher, very impressive considering the concurrent huge 19.4% S&P 500 surge! This gold bull’s second upleg enjoyed a 19.5% gain over 8.7 months leading into early September. Gold was able to peak at $1348 before that upleg failed after stock markets surged again following a new wave of taxphoria.
Even though gold never entered a bear market, that interim-high level was problematic for sentiment. While close, September 2017’s $1348 remained decisively below July 2016’s $1365. For key technical levels I consider decisive to be 1% beyond the previous extreme. So even though a 19.5% gold upleg is nothing to sneeze at, especially in extremely-euphoric stock markets, it wasn’t enough to change psychology.
Without a new bull-market high, gold stayed out of the financial-news headlines. The investors that had fled this leading alternative investment in the wake of Trump’s election win saw nothing to get gold back on their radars. The legions of gold bears could argue that the secondary lower top confirmed gold was in a downtrend. Technical analysis is something of a Rorschach test, often reflecting analysts’ own biases.
That gold bearishness really intensified heading into this latest Fed rate hike in December 2017. As that month dawned, it had been 16.8 months since gold’s initial bull-market high. Gold’s chance to break out a few months earlier had failed. So as you can see above, gold-futures speculators fled in terror from long positions while also ramping shorts. This latest gold-futures liquidation hit all-time record highs.
Gold-futures speculators’ collective positions are reported once a week in the CFTC’s Commitments of Traders reports. They are current to each Tuesday. In the CoT week ending December 12th on the eve of the Fed’s fifth rate hike of this cycle, speculators dumped an astounding 49.9k long contracts while adding 20.5k new short ones! That was the largest selling on record out of 989 CoT weeks since early 1999!
These traders’ collective bets had run to such hyper-bearish extremes that they had to mean revert after whatever the FOMC did in mid-December. And that has indeed happened. But as long as gold prices just meander within that giant trading range established in the first half of 2016, it will be difficult to shift psychology back to bullish. This week’s strong gold surge on that dollar weakness is starting to change that.
Gold’s $1358 close in US trading Wednesday was 0.7% above its early-September peak. While not quite at that 1%+ threshold for a decisive breakout yet, this is still a major higher high. Gold has been carving higher lows periodically ever since late 2016 when that post-election selloff exhausted itself. But higher lows don’t spark excitement outside of existing gold investors, higher highs are necessary for that.
Gold needs to close over $1361 to see a decisive breakout above the last upleg’s peak. It has traded above that level intraday in both Asian and American trading since Wednesday’s close. It’s only a matter of time until $1361+ sticks on a closing basis. That’s going to finally confirm higher highs to go along with the past 13.3 months’ higher lows. But the real prize remains a decisive breakout to new bull highs.
The new gold bull again peaked at $1365 in early July 2016 within a couple weeks of the UK’s Brexit vote. That unexpected outcome of the British people voting to take back their sovereignty from the unaccountable European Union bureaucrats was such a shock to the markets that major central banks rushed to declare they were ready to print money if necessary. Stocks rallied sharply on hopes for more easing.
The S&P 500 had been drifting sideways to lower without a single new bull-market high for 13.7 months before that. Gold $1365 in July 2016 happened the very trading day before the S&P 500 finally climbed to its first new record high. With stock markets apparently off to the races again, gold demand waned as investors weren’t interested in diversifying. A single close above $1365 will finally confirm gold’s bull persists!
But if gold just touches those bull-to-date highs and fades, bearish technical analysts can easily dismiss it as a double or triple top. In order for gold to garner financial-media attention and attract investors’ gazes back to it, a decisively 1%+ breakout is necessary. That happens at $1379. Gold is so close to a major upside breakout to new bull highs, which will conclusively prove to all investors its current bull market still lives.
That will really start shifting psychology away from the overwhelmingly-bearish levels it’s been stuck at since late 2016. In a normal year gold’s strong 2017 rally would’ve gone a long way to restore bullish sentiment. But again gold was overshadowed last year by the extreme stock-market surge, which stole all the limelight. The blind spot investors harbor for gold will start fading when new bull-market highs are seen.
The exact timing is unknowable and not really important. Gold could power over $1379 within days, or it might take weeks. Investment gold buying will flare again really boosting gold once these extremely-euphoric mania-blowoff stock markets finally roll over. Stock selloffs are great for gold, and even a minor one will easily catapult it to decisive new bull highs. That will dispel the fog of bearishness plaguing gold.
$1400+ gold may seem high after a multi-year bear market followed by a couple years of drifting low in this stock-market-surge-interrupted bull market, but it’s really not. Gold first climbed above $1400 in November 2010 and largely stayed there until June 2013. Over that 2.6-year span gold averaged $1595! And it went as high as $1894 in August 2011. Gold is nowhere near historical extremes, still relatively low.
At best gold’s young bull was only up 29.9% over 6.7 months by mid-2016. That’s trivial as far as gold bulls go, a rounding error. During gold’s last secular bull between April 2001 to August 2011, gold soared 638.2% higher in 10.4 years! Today’s young gold bull would still be tiny even if it saw gold doubled, taking it to $2102. That would still be well below gold’s inflation-adjusted real high from January 1980.
As I’ve been arguing continuously since late 2016, this young gold bull ain’t over yet! Major central banks around the world have conjured many trillions of dollars out of thin air which have levitated world stock markets. That really depressed gold demand. But once these QE-bloated markets inevitably roll over on this year’s new Fed and ECB tightening, a record flood of flight capital will likely seek the ultimate hedge of gold.
Investors can play gold’s ongoing mean-reversion bull in physical gold bullion or the leading GLD SPDR Gold Shares gold ETF. But the coming gold gains will be really amplified by the gold miners’ stocks. As gold rises, gold miners’ profits grow much faster. Thus major gold-stock prices usually leverage gold’s upside by 2x to 3x. Smaller gold miners can double that again. Gold stocks yield life-changing gains in gold bulls.
In essentially the same span of that last gold bull ending in late 2011, the HUI gold-stock index rocketed 1664.4% higher! Last week I wrote an essay explaining why the parallel flagship GDX VanEck Vectors Gold Miners ETF was on the verge of a major $25 upside breakout on strong earnings potential. There’s no doubt investors will flood into gold stocks as gold psychology changes, ultimately driving incredible gains.
While every investor needs to have a 5%-to-10%+ portfolio allocation to gold for diversification purposes, great gold stocks should be added on top of that. The beaten-down and left-for-dead gold miners’ stocks are deeply undervalued today with gold still out of favor. This is the only sector in all the stock markets likely to power much higher when everything else heads lower. Great gold stocks are essential to own today!
At Zeal we’ve literally spent tens of thousands of hours researching individual gold stocks and markets, so we can better decide what to trade and when. As of the end of Q4, this has resulted in 983 stock trades recommended in real-time to our newsletter subscribers since 2001. Fighting the crowd to buy low and sell high is very profitable, as all these trades averaged stellar annualized realized gains of +20.2%!
The key to this success is staying informed and being contrarian. That means buying low before others figure it out, before gold’s bull-market breakout becomes apparent. An easy way to keep abreast is through our acclaimed weekly and monthly newsletters. They draw on my vast experience, knowledge, wisdom, and ongoing research to explain what’s going on in the markets, why, and how to trade them with specific stocks. For only $12 per issue, you can learn to think, trade, and thrive like contrarians. Subscribe today, and get deployed in the great gold and silver stocks in our full trading books!
The bottom line is this gold bull’s third upleg is breaking out. This week gold closed above the peak from its second upleg, and is close to a decisive breakout. That puts gold within spitting distance of its bull-to-date high of $1365 from July 2016. Once gold powers decisively above those levels, it will confirm to all that gold’s bull is very much alive and well. That will work wonders to shift psychology back to bullish again.
Impressively gold is doing all this with stock markets still at mania-blowoff record highs. Gold investment demand explodes once stock markets roll over, which is what ignited and fueled this gold bull’s strong initial upleg in early 2016. So when the long-overdue and inevitable material stock-market selling finally arrives, gold’s advance will really accelerate. Get long before this major bull-market breakout changes everything!
Adam Hamilton, CPA
January 26, 2018
Copyright 2000 – 2018 Zeal LLC (www.ZealLLC.com)
There are very few sellers left
There were very few sellers left in January 2016 when the devastating “forever bear” was about to end. Six months later and a 150% rebound in the large caps and 200% rise in the juniors (GDXJ) provided sellers an opportunity. They drove the miners and juniors down by 40% to 45% in less than five months. However, both GDX and GDXJ have been able to hold above that low multiple times. GDX has held $21 four times! GDXJ has held $29.50 twice in solid fashion.
The bears had multiple opportunities in 2017 to push the miners lower but the miners held above their December 2016 lows and maintained the 62% retracement of the 2016 surge. The miners did not break out in 2017 but they held key support multiple times and the latest rebound suggests selling power has dried up.
The recovery pattern following a mega-bear market bodes well for gold stocks in the second half of 2018
In November we wrote about this history and the potential implication for gold stocks in 2018 and beyond. The mega bear markets that compare to gold stocks from 2011-2016 with respect to price (+80% decline) and time (+2 years) follow a distinct pattern. The initial rebound is sizeable in price but not so much in time. That gives way to a correction and consolidation that lasts a minimum of 18 months. Then the market surges higher in third-wave like fashion.
The gold stocks are nearly 17 months through their consolidation. We do not know if the consolidation is ending soon or if it will last another three, six or even nine months. We do know that history argues the correction and consolidation should end sometime in 2018.
Gold is not too far away from breaking out
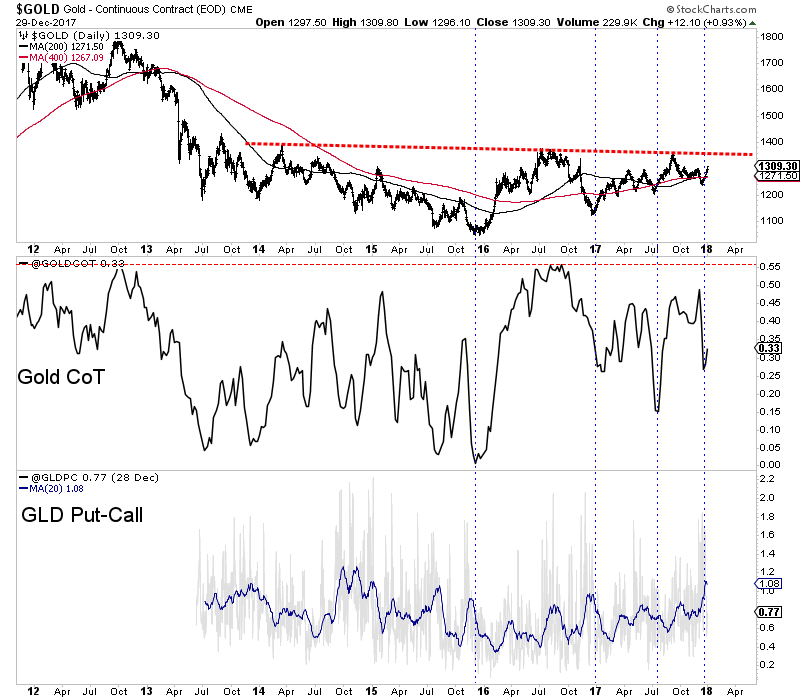
Gold is much closer to breaking its 2016 high than the miners but the miners could begin to sniff that potential breakout in Gold before or as it happens. Gold recently bottomed around $1240 with sentiment indicators at encouraging levels. In the chart below we plot Gold along with its net speculative position as a percentage of open interest (CoT) and the GLD put-call ratio. The CoT recently touched 27% which, although not a bearish extreme is fairly low relative to most readings since February 2016. The GLD put-call ratio recently touched the highest level in more than two years. With current sentiment relatively muted, Gold has a chance to rally up to trendline resistance. That would put it in position to breakout sometime in 2018.
Gold Stocks are one of the few sectors that offer compelling value
As we discussed last week, the gold stocks continue to offer historic value. The value is not quite as historic as in January 2016 when it was absolutely historic but it remains exceptional. Outside of the commodity sector there is nothing in a value sense that compares with the gold stocks. Even within the commodity sector, there is little that compares to gold stocks. Heading into 2018 traders and investors have to be intrigued at the deep value opportunity in the gold stocks in nominal and especially relative terms.
Increasing inflation expectations
Commodities typically outperform at the end of an expansion and into the beginning of a recession. This is accompanied by rising inflation. Some commodity sectors have performed well but the commodities as a whole (CRB or CCI) has yet to make new highs. One thing that could trigger a sharp rise in inflation expectations would be a breakdown in long-term bond prices.
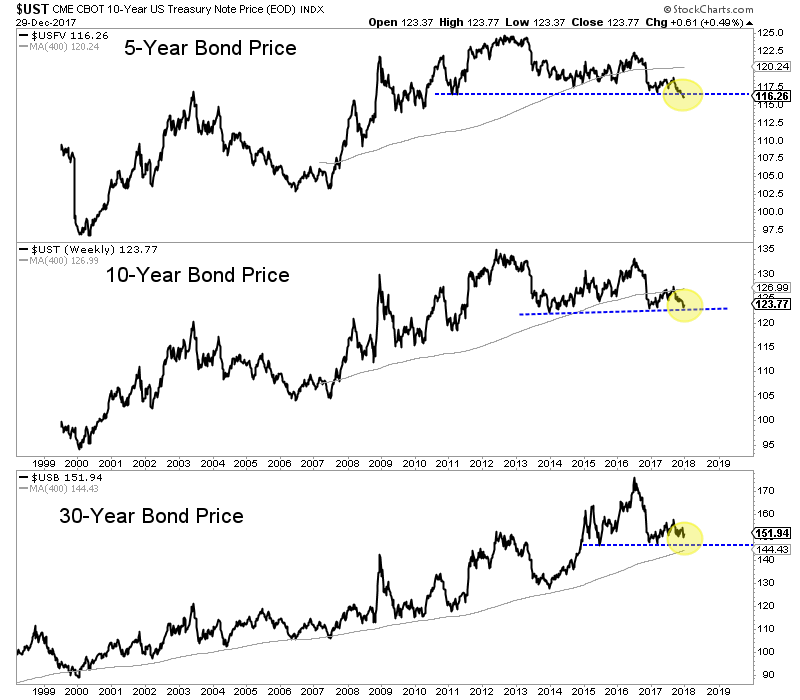
In the chart below we plot the 5-year bond price, the 10-year bond price and the 30-year bond price. The 5-year bond has already broken to a 7-year low while the 10-year bond is not far behind. The 30-year bond continues to hold above its 2015-2016 lows but does not have much wiggle room. A breakdown in the 10-year and 30-year bonds may not be immediately bullish for precious metals but a continued decline or acceleration to the downside would be.
The strength of the current rebound in the gold stocks has definitely surpassed our expectations and the December lows should hold moving forward. If that is the case then a breakout move for the gold stocks this year is more likely than not. More backing and filling may be ahead but if GDX and GDXJ can surpass their September highs it would be a very good sign for 2018. The miners have plenty of work to do before a true breakout move can begin but traders and investors would be wise to keep a close eye on the sector. We prefer companies with strong fundamentals that are trading at reasonable values and have upcoming catalysts that will drive buying. To follow our guidance and learn our favorite juniors for 2018, consider learning more about our premium service.
If you would like to receive our free newsletter via email, simply enter your email address below & click subscribe.
 Follow us on Twitter
 Become our facebook fan
CONNECT WITH US
Tweets
Tweet with hash tag #miningfeeds or @miningfeeds and your tweets will be displayed across this site.
MOST ACTIVE MINING STOCKS
Daily Gainers
 CMC Metals Ltd. CMC Metals Ltd. |
CMB.V | +900.00% |
 Eden Energy Ltd Eden Energy Ltd |
EDE.AX | +200.00% |
| GoviEx Uranium Inc. |
GXU.V | +42.86% |
| Eagle Nickel Ltd. |
ENL.AX | +41.67% |
| Citigold Corp. Limited |
CTO.AX | +33.33% |
| Mount Burgess Mining NL |
MTB.AX | +33.33% |
| Exalt Resources Limited |
ERD.AX | +31.94% |
| Casa Minerals Inc. |
CASA.V | +30.00% |
| Cariboo Rose Resources Ltd |
CRB.V | +28.57% |
| Belmont Resources Inc. |
BEA.V | +28.57% |


