Gold was enjoying a solid spring rally until a couple weeks ago, nearing major upside breakouts. But its nice advance has crumbled since, really weighing on sentiment. Gold fell victim to a rare major short squeeze in US Dollar Index futures. The surging USDX motivated gold-futures speculators to flee rather aggressively. But this will likely prove a short-lived anomaly, after which gold’s assault on highs will recommence.
Gold’s seasonally-atypical weakness over the past couple weeks is very important for speculators and investors to understand. It had nothing at all to do with fundamentals, but was completely driven by the hyper-leveraged gold-futures traders. These guys have long been fixated on the US dollar’s fortunes, looking to its benchmark US Dollar Index for trading cues. That can slave gold’s price to the dollar at times.
Six weeks ago, gold slumped to a major seasonal low of $1310 the day before the universally-expected 6th Fed rate hike of this cycle. The gold-futures traders fervently believe Fed rate hikes are very bearish for gold, so they usually sell leading into FOMC meetings with potential hikes. This has happened before every Fed rate hike of this cycle. The theory is higher US rates boost foreign investment demand for US dollars.
The ironic thing is modern history proves the opposite! Fed-rate-hike cycles are bearish for the US dollar and bullish for gold. The last cycle ran from June 2004 to June 2006, where the Fed hiked 17 times in a row for 425 basis points. Despite those aggressive and relentless rate hikes, the USDX still slipped 3.8% lower over that exact span while gold rocketed 49.6% higher! Clearly futures specs’ theory is sorely lacking.
The Fed’s current rate-hike cycle out of extreme zero-interest-rate-policy lows got launched in December 2015. Gold was hammered to a 6.1-year secular low leading into it, as futures specs were absolutely certain higher rates were bearish for gold and bullish for the USDX. Yet again they were proven dead wrong, wrong, wrong! As of the middle of this week, gold is up 23.0% since then while the USDX fell 5.5%.
You’d think after some market thesis fails to work over and over again for decades, traders would try something else. But not futures speculators, they are a stubborn lot. So leading into every likely Fed rate hike, they bid up the USDX and dump gold. Then immediately after those rate hikes the dollar fails to surge and gold doesn’t plunge, so they reverse those excessive trades driving the dollar down and gold up.
So like clockwork after the Fed’s latest rate hike in late March, gold started rallying as gold-futures specs bought back in. Gold enjoys a strong seasonal spring rally in April and May, which I discussed in depth last week. By mid-April, that propelled gold within spitting distance of a major bull-market breakout. Gold regained its $1365 bull-to-date high from July 2016 on an intraday basis on April 11th, but failed to push through.
Ironically futures speculators’ irrational obsession with the Fed was again to blame. That day the FOMC released the minutes from its March 21st rate-hiking meeting. Traders interpreted them as hawkish, so the USDX was bought and gold was sold. For 24 trading days in row between mid-March to mid-April, gold simply did the opposite of whatever the USDX did on every single day but one. The dollar ruled gold.
Gold managed to hover near $1350 multi-year-horizontal-resistance breakout territory for another week after those Fed minutes. But that started changing on April 19th. That day the USDX rallied 0.3%, which was actually its biggest up day in a couple weeks. USDX-futures speculators were excited because the yields on benchmark US 10-year Treasury notes crested 2.9%. Higher yields are great for the dollar, right?
For decades I’ve closely followed speculators’ collective gold-futures positions every week in the famous Commitments of Traders reports published by the CFTC. I discuss them and their implications for gold’s near-term price action in every weekly newsletter. But I haven’t had the time to dig deeply into USDX futures. The analysts who traffic in that realm said USDX short positions were the largest seen in several years.
The leverage inherent in currency speculation is extreme beyond belief. Since major currencies tend to move slowly, the margin requirements equate to maximum leverage of 50x, 100x, or even 200x! That compares to the decades-old legal limit in the stock markets of 2x. At 50x, 100x, or 200x, mere 2.0%, 1.0%, or 0.5% currency moves against traders’ positions would wipe out 100% of their capital risked. It’s crazy!
So when currency speculators are wrong, they have to exit positions fast or risk getting obliterated. The traders short USDX futures had no choice but to buy. The more long USDX futures they bought to offset and close their shorts, the faster the dollar rallied. That forced still more traders to buy to cover even if they were running more-conservative leverage. This self-reinforcing dynamic feeds on itself, fueling short squeezes.
As the USDX buying mounted, the dollar’s rally accelerated in subsequent days. Traders continued to use 10-year Treasury yields as a fundamental excuse for their purely technical trading, as within a week they crossed the psychologically-heavy 3% threshold to 3.03%. That was the highest seen since the very end of 2013! The USDX rallied 0.3%, 0.5%, and 0.7% in the initial few trading days of that buying to cover.
It had already become the biggest dollar short squeeze since soon after Trump won the election in late 2016. That heavy futures buying forced the USDX to surge 1.5% in those first 3 trading days. Although that sounds trivial, at 50x, 100x, or 200x leverage it hammers speculators to catastrophic 75%, 150%, or 300% losses! I wonder how these guys can sleep at night bearing such ridiculous and unforgiving levels of risk.
Gold-futures speculators run extreme leverage too, but much less than currency traders. This week a single gold-futures contract controlling 100 troy ounces of gold worth $130,500 only required speculators to keep $3100 cash margins in their accounts. That equates to 42.1x maximum leverage! For traders running at the edge, every 1% adverse move in gold would wipe out an insane 42% of their capital risked.
So these guys nervously watch gold on a minute-by-minute basis. And in a fascinating confirmation that gold is indeed a currency, they look to the US dollar for their trading cues. They started selling their gold-futures positions as the dollar started rallying. That drove gold 0.2%, 0.7%, and 0.9% lower in the first 3 trading days of that USDX short squeeze that ignited on April 19th, forcing gold down 1.9% overall to $1324.
Our lone chart this week looks at gold during this current Fed-rate-hike cycle superimposed on the long and short positions large and small speculators hold in gold futures. Again these are published once a week in those Commitments of Traders reports. All 6 Fed rate hikes of this cycle are also highlighted, to show how gold is bludgeoned lower leading into them which spawns strong rebound buying in their wakes.
While the weekly CoTs are current to each Tuesday, they are released late Friday afternoons. Thus the newest-available CoT when this essay was published covers the week ending April 24th. That includes those initial few trading days of that USDX-futures short squeeze. And it’s very illuminating, showing why gold was pummeled back down from major-breakout levels and its strong spring rally was short-circuited.
For pre-dollar-rally baselines, on Tuesday April 17th speculators held 284.2k long and 98.9k short gold-futures contracts. These were running 27% and 15% up into their own past-year trading ranges. Thus these traders had the capital firepower and room to still do about 3/4ths and 6/7ths of their near-term long buying and short selling. Of course buying gold-futures longs is bullish for gold, while shorting is bearish.
When gold-futures shorts are low, there’s always the risk speculators will aggressively sell on the right catalyst coming along. That forces gold’s price lower. And this unlikely dollar short squeeze erupting out of the blue proved that triggering event. On seeing the USDX surge, the gold-futures specs were quick to start jettisoning longs and ramping shorts. Thus gold fell 1.2% on the 1.4% USDX rally over that CoT week.
The magnitude of this initial gold-futures selling became evident in the next CoT report current to April 24th. During that CoT week, specs sold 7.9k gold-futures long contracts while adding another 15.6k on the short side. That made for big total CoT-week selling equivalent to 73.0 metric tons of gold. That is simply far too much for normal buying to absorb. Thus the only possible outcome was a lower gold price.
Just this week, the World Gold Council released its latest Gold Demand Trends report for Q1’18. That’s the definitive source for world gold fundamental supply-and-demand data. In Q1, global gold investment demand averaged 22.1t per week. So heavy gold-futures selling easily overwhelms that. Gold always falls when the futures specs get on a selling kick. They flood the market with too much short-term supply.
That dollar-short-squeeze reaction left specs’ collective long and short gold-futures positions running up 22% and 30% into their past-year trading ranges. So these traders still had room to do about 4/5ths of their likely near-term long buying, but expended a significant chunk of their shorting firepower. That left total spec shorts at a 12-CoT-week high of 114.5k contracts. The higher spec shorts, the more bullish gold gets.
Short positions in futures are bullish because they necessitate proportional near-term buying. In selling short, speculators essentially borrow futures from other traders to sell. The specs are legally obligated to buy back those contracts relatively soon to close out those trades and repay those effective debts. So futures shorts are guaranteed near-future buying, whether they are in the USDX, gold, or anything else.
This essay was penned and proofed Thursday, and then published Friday morning. The newest CoT data current to this Tuesday May 1st won’t come out until late Friday afternoon about 4 hours after this essay went live. So while I can’t wait to see the latest CoT, I can only speculate about it at this point. During this latest CoT week, the USDX-futures short squeeze continued which drove more spec gold-futures selling.
The dollar rally actually accelerated in this newest CoT week ending Tuesday, as shown by the sharp 1.9% rally in the USDX. Thus gold’s CoT-week selloff also grew to 2.0%. That was 2/3rds larger than the prior CoT week’s 1.2%. So odds are the gold-futures selling ballooned significantly in this latest CoT week. That implies another 35k to 40k gold-futures contracts were dumped, with the majority likely on the short side.
Assuming the prior week’s spec gold-futures-selling mix of 1/3rd long and 2/3rds short holds, total spec longs could’ve dropped another 12.9k contracts while shorts could’ve soared 25.8k. If that proves true, total spec longs and shorts could have been running near 14% and 54% up into their past-year trading ranges as of this Tuesday. That would mean the majority of the likely gold-futures shorting is already done!
While I don’t have the USDX-futures data and background to analyze in depth, odds are the USDX is in a similar opposite place. I suspect the majority of the dollar short covering has already run its course. That paves the way for this sharp dollar rally to at least peter out and probably reverse. Trade-war fears are going to flare again soon as the distraction of stocks’ Q1 earnings season passes, which is bearish for the dollar.
If you look at the chart above, the green line shows specs’ total gold-futures long contracts. Note even a CoT week ago that was trading below bull-market support. There is big room for these traders to flood into gold on the long side when the USDX inevitably stalls or reverses. They likely now have the capital firepower to do about 6/7ths of their potential near-term buying! That portends big gold upside in coming weeks.
While gold’s strong seasonal spring rally was interrupted by this surprise USDX-futures short squeeze, I doubt it was killed. Gold was driven to a new seasonal low of $1304 this week, under its previous $1310 of mid-March. Thus all the usual spring-rally buying in April and May will likely be compressed into this month alone! That means gold could enjoy a major mean-reversion bounce rally in the coming weeks.
During the 10 trading days as of the middle of this week since the dollar’s sharp rally started, gold has moved inversely proportionally to the USDX on every trading day but one. 8 of these trading days of the past couple weeks saw the dollar rally, and gold’s biggest losses of 0.9% both occurred on the dollar’s best up days of 0.7%. Gold’s down days were all about the same size as the dollar’s up days, mirror images.
But in the 2 trading days of the past couple weeks when the USDX retreated modestly, gold surged way out of proportion to the dollar’s weakness. These trivial 0.2% and 0.1% USDX slides allowed gold to rally a relatively-outsized 0.6% and 0.5%! Gold wants to rally, and will likely quickly surge back up near major-breakout levels soon after this dollar-rally pressure abates. And that’s likely going to prove very soon.
The mounting US/China trade war has been pushed out of the financial-media spotlight by Q1 corporate earnings, which have soared on the big corporate tax cut. But earnings season is winding down just as major trade-war deadlines are looming for the US to implement recent tariff announcements. The dollar looks far less attractive to foreign investors if tariff threats become reality, their capital will seek refuge elsewhere.
And though the extreme leverage inherent in gold futures enables their speculators to wield outsized influence on short-term price action, investors’ capital massively dwarfs the speculators’. So when investors’ vast funds start bidding on gold again, likely on the next major stock-market selloff driving demand for prudent portfolio diversification, gold-futures specs’ influence will be overwhelmed and drowned out.
Add in strong spring seasonals to all this, and gold has a fantastic foundation for a strong rebound rally. Speculators’ low gold-futures longs are very bullish, as they will rush to buy back in to ride any upside momentum in gold. Speculators’ mounting gold-futures shorts are increasingly bullish, as these will have to be covered and closed by buying offsetting longs. And investors’ super-low gold allocations are wildly-bullish.
So odds are gold’s atypical counter-seasonal drop in the last couple weeks driven by the surprise USDX short squeeze will soon reverse hard. It won’t take much buying to drive gold back up near those major bull breakout levels around $1365. And gold powering higher again will quickly turn sentiment around, with buying begetting more buying. The dollar depressing gold prices leaves this metal more bullish, not less so.
While investors can ride gold’s coming mean-reversion rebound in physical bullion itself or shares in the leading GLD SPDR Gold Shares gold ETF, far-better gains will be won in the stocks of its leading miners. They are already radically undervalued at today’s prevailing gold prices, and their profits tend to amplify underlying gold gains by 2x to 3x. This small contrarian sector’s upside is vast, dwarfing everything else.
With gold still so near a major bull-market breakout, it’s ironic gold stocks remain so deeply out of favor. Between our weekly and monthly newsletters, we have 30 open gold-stock and silver-stock trades added in the past year. As of this week near gold’s lows, fully 25 had average unrealized gains of 18%. One gold miner added in late November is already up 95%! The 5 other trades had average unrealized losses of just 5%.
When gold inevitably rebounds, these unrealized gains are going to explode higher. Buying low first is necessary before selling high later to multiply wealth. That means adding gold stocks when you least want to, when they’re hated. That’s what we do at Zeal. We spend all our time relentlessly studying the markets so you don’t have to, and share our acclaimed research through our popular financial newsletters.
They draw on my vast experience, knowledge, wisdom, and ongoing research to explain what’s going on in the markets, why, and how to trade them with specific stocks. As of the end of Q4, we’ve recommended 983 stock trades in real-time to our newsletter subscribers since 2001. They’ve averaged big annualized realized gains of +20.2%, well over double stock markets’ long-term average! For only $12 per issue, you can learn to think, trade, and thrive like contrarians. Subscribe today and get deployed!
The bottom line is gold’s recent weakness is the result of a rare major short squeeze in US Dollar Index futures. The resulting dollar rally spooked gold-futures speculators, who rushed to sell to avoid getting slaughtered by their extreme leverage. While that short-circuited gold’s spring rally, this anomaly won’t last. Gold-futures speculators and gold investors are far too bearish and under-allocated, with big room to buy.
The USDX short covering is likely running out of steam, which will clear the way for gold’s big seasonal spring rally to resume. All that delayed buying will likely be compressed into May, and drive gold back up near recent major-bull-breakout levels. Any dollar/gold reversals will force gold-futures specs to quickly buy to cover their ballooning shorts. The resulting rally will entice in long-side traders, then gold is off to the races.
Adam Hamilton, CPA
May 4, 2018
Copyright 2000 – 2018 Zeal LLC (www.ZealLLC.com)

Silver has been dead money over the past year or so, relentlessly grinding sideways to lower. That weak price action has naturally left this classic alternative investment deeply out of favor. Silver is extremely undervalued relative to gold, while speculators’ silver-futures positions are extraordinarily bearish. All this has created the perfect breeding ground to birth a major new silver bull market, which could erupt anytime.
Silver’s price behavior is unusual, making it a challenging investment psychologically. Most of the time silver is maddeningly boring, drifting listlessly for months or sometimes years on end. So the vast majority of investors abandon it and move on, which is exactly what’s happened since late 2016. There’s so little interest in silver these days that even traditional primary silver miners are actively diversifying into gold!
But just when silver is universally left for dead, one of its massive uplegs or bull markets suddenly ignites. Some catalyst, typically a major gold rally, convinces investors to return to silver. Their big capital inflows easily overwhelm the tiny global silver market, catapulting this metal sharply higher. Silver skyrockets to amazing wealth-multiplying gains, dwarfing nearly everything else. This reinvigorates silver’s cult-like following.
Silver’s dominant primary driver has long been gold, which controls all precious-metals sentiment. When gold isn’t doing anything exciting, silver languishes neglected. But once gold rallies high enough for long enough to convince investors a major upleg is underway, capital starts returning to silver. Thus silver is effectively a leveraged play on gold, amplifying its price action. Silver never soars unless gold is strong.
This psychological relationship is so ironclad it may as well be fundamental. The global silver and gold supply-and-demand profiles are technically independent, with little direct linkage physically. But when investment demand flares to drive gold higher, parallel silver investment demand soon materializes. So silver and gold often move in lockstep, especially when gold’s price action is interesting enough to catch attention.
All this makes the Silver/Gold Ratio the most-important fundamental measure for silver prices. The lower silver prices happen to be compared to prevailing gold ones, the greater the odds a major silver mean-reversion rally is imminent. And today silver is almost as low relative to gold as it’s ever been in the past century! This first chart looks at the SGR, or more precisely the inverted GSR, over the past 13 years or so.
The SGR calculation results in tiny hard-to-parse decimals, like this week’s 0.012x. So I prefer to use the gold/silver ratio instead, which yielded a cleaner 81.9x as of this Wednesday. Charting this GSR with its axis scaled upside down produces the same SGR line, but with far-more-brain-friendly numbers. This shows that silver is extremely undervalued relative to gold today, which is super-bullish for this neglected asset.
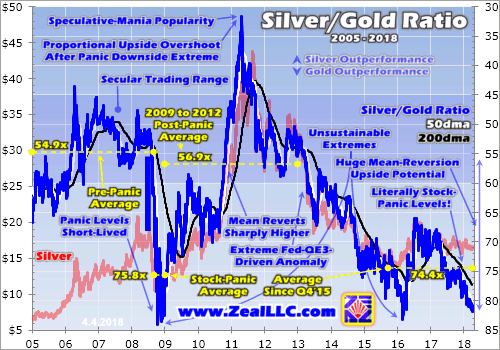
Again this week the SGR was running at just 81.9x, meaning it took almost 82 ounces of silver to equal the value of a single ounce of gold. So far in 2018, the SGR has averaged 79.6x. As you can see in this chart, that’s extremely low. There have only been two other times in modern history where silver looked worse relative to gold, late 2008’s first-in-a-century stock panic and early 2016’s secular-bear-market lows.
Because of silver’s tiny market size, it’s an incredibly-speculative asset. When investment capital flows really shift, silver can soar or plunge with shocking violence. Silver’s speculative nature makes it far more susceptible to general market psychology than gold. Silver acts like a small fishing boat battered around in the choppy waves of sentiment, while gold is more like a supertanker punching through them.
That 2008 stock panic was the first since 1907, one of the most-extreme fear events of our lifetimes. Technically a stock panic is a 20%+ plummet in the major stock-market indexes in less than two weeks. The flagship S&P 500 stock index indeed collapsed 25.9% in exactly two weeks in early October 2008, which terrified everyone. If felt like the world was ending, so investors and speculators sold everything to flee to cash.
Gold weathered that storm well, only sliding 3.3% in that wild stock-panic span. But the overpowering fear scared traders into hammering silver 23.7% lower. On exceptional stock-market down days, silver tends to split the difference between the S&P 500 and gold. We’ve seen that recently as well, during this new stock-market correction since early February. Silver is particularly sensitive to prevailing herd sentiment.
Between September and December 2008 straddling that stock panic, the SGR averaged just 75.8x. Silver was radically undervalued relative to gold, an anomalous state that has never been sustainable for long. The resulting mean reversion and overshoot higher was enormous, yielding stupendous gains for silver investors. Silver ultimately bottomed at $8.92 per ounce in late-November 2008, at a super-low 83.5x SGR.
Over the next 12.4 months silver rocketed 115.4% higher out of those extreme stock-panic lows, which restored the SGR to 63.2x. But that was still low. In the years leading into that stock panic, the SGR averaged 54.9x. For decades a mid-50s SGR has been normal, with silver generally oscillating around those levels compared to gold. Miners had long used 55x as a proxy for calculating silver-equivalent ounces.
Once silver falls to extreme lows relative to its primary driver gold, the inevitable resulting mean reversion rarely stops near the average. Instead it tends to overshoot proportionally to the upside, fueling massive gains. Silver started returning to favor in late 2010 and early 2011 as gold powered to major new highs. That ultimately climaxed with silver enjoying popular-mania-like popularity in late April 2011, at $48.43 per ounce.
That made for a total bull market out of those extreme stock-panic lows of 442.9% over 2.4 years! At its peak, the SGR had soared to 31.7x. Silver can’t sustain anomalously-high prices relative to gold either, so that bull soon rolled over as I warned the month before that peak. The key takeaway today is silver’s extreme stock-panic lows birthed a major new bull market. Silver can’t stay crazy-low relative to gold for long.
Unbelievably silver in 2018 is even more extremely undervalued than during those 4 months surrounding that stock panic! Again the SGR is averaging just 79.6x year-to-date. That’s considerably worse than during the stock panic which saw 75.8x over a similar time span. Such incredibly-low silver prices are no more sustainable now than they were then. That’s why a major new silver bull is likely coming very soon.
Interestingly the SGR popped right back up to its traditional mid-50s average after 2008’s stock panic as well. Between 2009 and 2012, the SGR averaged 56.9x. Those were the last quasi-normal years for the markets before the Fed’s unprecedented open-ended third quantitative-easing campaign started to wildly distort everything in 2013. Everything since then is literally a central-bank-conjured illusion that will shatter.
If silver merely mean reverts out of today’s worse-than-stock-panic extreme lows, regaining a 55x SGR would catapult it near $24.25 at this week’s $1333 gold levels. That’s almost 50% higher than today’s deep lows! From this week’s wild 81.9x SGR low, a proportional overshoot back up to a 28.1x SGR would blast silver back near $47.50. That’s 191% higher from here, nearly a triple, making for big gains.
All it will take to get silver mean reverting is a convincing gold upleg. Investors will return to silver once gold rallies high enough for long enough for them to believe its climb is sustainable. Then silver will take off and amplify gold’s gains. Gold powered 106.2% higher during that post-stock-panic silver bull where it soared 442.9%, making for 4.2x leverage. Gold also fueled silver’s last reversion rally out of extreme lows.
From 2013 to 2015, the stock markets surged relentlessly as the Fed’s vast QE money creation directly levitated them. Gold is an alternative investment thriving when stock markets weaken, so it was largely abandoned in those weird years. Gold ultimately slumped to a 6.1-year secular low in December 2015 leading into the Fed’s first rate hike of this cycle. That pummeled silver to its own parallel 6.4-year secular low.
In late 2015 silver felt a lot like it does today. No one wanted anything to do with it, everyone believed it was dead. Investors and speculators alike wouldn’t touch silver with a ten-foot pole near those lows, convinced it was doomed to spiral lower indefinitely. Yet out of that very despair a new silver bull was born. Over the next 7.6 months into August 2016, silver powered 50.2% higher on gold’s new 28.2% upleg.
Unfortunately that new mean-reversion silver bull ended prematurely as gold’s own young bull suffered a temporary truncation. The extreme stock-market rally erupting after Trump’s surprise election victory on euphoric hopes for big tax cuts soon sapped the wind from gold’s sails. So it dragged silver lower during much of the time since. But the new stock-market correction proves that stocks-strong-gold-weak trend is ending.
That’s super-bullish for silver, especially with it trading at stock-panic-like extreme lows compared to where gold is today. As these wildly-overvalued stock markets continue sliding lower on balance, gold will return to favor. The resulting capital inflows driving it higher will get investors and speculators alike interested in silver again. And just like after past extreme lows, their buying will catapult silver sharply higher.
Today’s extreme undervaluation in silver relative to gold is reason enough to expect a major new silver bull to ignite soon and start powering higher. But silver’s bullish outlook gets even better. The silver-futures situation today is nearly as extreme, with speculators making exceedingly-bearish bets on silver. These will have to be reversed as gold rallies, unleashing massive silver buying that will quickly drive it higher.
Short-term silver-price action is dominated by speculators’ silver-futures trading. The extreme leverage inherent in silver futures lets these guys punch way above their weight in terms of silver-price impact. Each silver-futures contract controls 5000 troy ounces of silver, worth $81,400 even at this week’s very-depressed prices. Yet the maintenance margin required to hold a contract was only $3,600 this week!
That means silver-futures speculators can run extreme leverage up to 22.6x, which is outrageous. Most investors run no leverage at all of course, and the legal limit in the stock markets has been pegged at 2x for decades now. Compared to an investor owning silver outright, each dollar silver-futures speculators are trading can have over 20x the price impact on silver! This gives futures traders wildly-outsized influence.
Every week their collective silver-futures positions are detailed in the CFTC’s famous Commitments of Traders reports. The recent reads are every bit as bullish for silver over the coming months as the SGR is over the coming years! All it will take to get silver surging higher again is for these universally-bearish traders to start buying again. And with the extreme leverage they run, the markets will force them to buy.
This chart shows speculators’ collective long and short positions in silver futures in green and red. They are now barely long silver while heavily short, making for exceedingly-bearish collective bets. Those will have to be unwound relatively rapidly once gold’s stock-market-selloff-fueled rally inevitably starts pulling silver higher again. This is the most-bullish silver-futures situation seen since just before silver’s last bull was born!
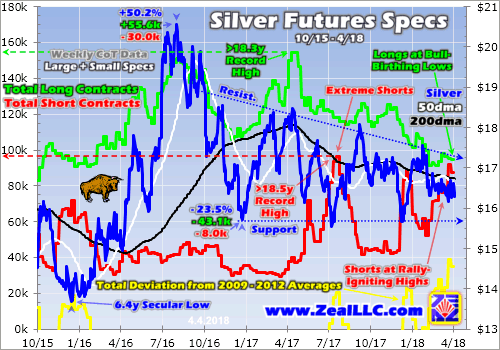
Let’s start on the short side, since that’s where speculators’ big silver-futures buying will begin. In the latest CoT week before this essay was published, current to Tuesday March 27th, speculators had total silver-futures shorts of 87.6k contracts. That’s truly extreme. Out of the 1004 CoT weeks since back in early 1999, that’s the 5th-highest spec shorting levels ever seen! Past extremes were never sustainable.
Note above that every single time the red spec-shorts line surged to highs, silver was bottoming ahead of a major rally ignited by short covering. That was true in late 2015 when silver’s latest bull was born, in mid-2017 during gold’s and silver’s summer-doldrums lows, and in late 2017 which saw extreme silver-futures short selling leading into another Fed rate hike. Silver rallied sharply after each shorting spike.
Silver-futures speculators are always wrong at extremes, because their very collective trading is what spawns those extremes in the first place. Once these guys have expended all their capital firepower to throw heavily short silver, there’s no one left to short sell it. Soon some get nervous and start to buy to cover their existing shorts. The only way to exit futures shorts is to buy offsetting long contracts to close positions.
And once short-covering buying starts on the periphery, the whole herd of speculators soon has to join in or risk truly-catastrophic losses. At today’s 22.6x max leverage available in silver futures, a mere 4.4% silver rally would wipe out 100% of the capital risked shorting it! So as soon as silver starts rallying when speculators are extremely short, they are forced to rush to buy to cover which catapults its price sharply higher.
No matter where the SGR happened to be, the 5th-highest spec shorts in silver-futures history would be wildly bullish for the near-term. But that’s not the whole silver-futures picture. It’s not just the speculators on the short side of the trade that are too bearish on silver, so are the long-side guys. In this latest CoT week, total spec silver-futures longs were only running 95.0k contracts. That’s just over a 26.2-month low!
Speculators’ collective bullish bets on silver via futures are slightly above their lowest levels since early 2016 when silver’s last bull market erupted! Unlike short-side traders who are legally obligated to buy to cover once silver starts rallying, new long-side buying is discretionary. But that very short covering drives silver higher fast enough to make the bearish long-side traders want to buy back in too, amplifying silver’s rally.
There’s nothing more bullish for silver over coming months than the rare combination of extremely-high shorts and very-low longs! This hasn’t been seen since late 2015 around silver’s 6.4-year secular low. Once silver started climbing on a parallel gold rally driven by short covering in its own futures, silver was off to the races on big futures buying. Speculators rushed to cover their excessive shorts and rebuild meager longs.
The resulting 30.0k contracts of silver-futures short-covering buying and another 55.6k of long buying catapulted silver 50.2% higher over the next 7.6 months. That adds up to 85.6k contracts of spec silver-futures buying. Today’s situation is even more bullish. If total spec shorts and longs return to their past year’s low and high, we’re looking at 54.5k contacts of short covering and another 59.5k of long buying!
That adds up to colossal silver-futures buying potential of 114.0k contracts over the next half-year or so. That’s the equivalent of a staggering 570m ounces of silver, or nearly 2/3rds of the latest read on annual world silver mine production! The potential silver upside that would be fueled by silver-futures buying of this magnitude is enormous. I suspect the resulting silver bull will dwarf the last +50.2% one in 2016’s first half.
Once silver starts rallying decisively on silver-futures buying, investors with their vastly-larger pools of capital will also start returning. Bullish analyses will explode, highlighting silver’s deep undervaluation relative to gold per the Silver/Gold Ratio. That will fuel bullish sentiment driving even more buying. Bull markets’ virtuous circle is buying begetting more buying. The more silver rallies, the more people want to buy it.
I’d be very bullish on silver with only a stock-panic-level SGR, only extreme spec silver-futures shorts, or only very-low spec silver-futures longs. But seeing all three at once, at a time when gold is rallying as the stock markets finally roll over out of their fake central-bank-spawned levitation, is truly extraordinary! This is literally the most-bullish setup for silver seen in years, so smart contrarian traders should be really long.
History proves that once silver starts moving, it will likely rally fast. As always the biggest gains will be won by the fearless contrarians who bought in early before everyone else figures this out. Investors and speculators alike can play silver’s big coming upside in physical bullion itself, the leading SLV iShares Silver Trust silver ETF, and the silver miners’ stocks. But only the latter will greatly leverage silver’s gains.
Just last week I wrote a comprehensive essay exploring the recent Q4’17 results of the world’s major silver miners included in the leading SIL Global X Silver miners ETF. They are mining silver at average all-in sustaining costs of just $10.16 per ounce, far below even today’s low silver prices. So all of silver’s new-bull-market gains will be pure profit, leading to exploding earnings driving silver miners’ stocks far higher.
During 6.9 months roughly coinciding with early 2016’s silver bull, SIL rocketed 247.8% higher! That’s about 4.9x upside leverage to silver’s own gains. And given how absurdly low silver-stock prices are today, silver miners have similar-if-not-greater potential to amplify silver’s even-larger gains in its next bull. The elite major silver miners with superior fundamentals could be the best-performing stocks in all the markets.
At Zeal we’ve literally spent tens of thousands of hours researching individual silver stocks and markets, so we can better decide what to trade and when. As of the end of Q4, this has resulted in 983 stock trades recommended in real-time to our newsletter subscribers since 2001. Fighting the crowd to buy low and sell high is very profitable, as all these trades averaged stellar annualized realized gains of +20.2%!
The key to this success is staying informed and being contrarian. That means buying low before others figure it out, before undervalued silver stocks soar much higher. An easy way to keep abreast is through our acclaimed weekly and monthly newsletters. They draw on my vast experience, knowledge, wisdom, and ongoing research to explain what’s going on in the markets, why, and how to trade them with specific stocks. For only $12 per issue, you can learn to think, trade, and thrive like contrarians. Subscribe today, and get deployed in the great gold and silver stocks in our full trading books!
The bottom line is a new silver bull is coming. Silver’s long and vexing sideways-to-lower grind has left it as undervalued relative to gold as during 2008’s stock panic. That anomaly was resolved by silver more than quintupling over the subsequent years in a mighty mean-reversion-overshoot bull. On top of that, silver-futures speculators’ short positions are at extreme highs while their opposing longs are at bull-birthing lows.
These wildly-bearish traders will be forced and motivated to aggressively buy silver futures once silver starts rallying decisively. That will be driven by gold strength like usual. Stock-market weakness ignites gold investment demand, driving both precious metals higher. Today’s silver setup is the most bullish in years. Everything is perfectly aligned for a massive new silver bull market to get underway any day now.
Adam Hamilton, CPA
April 6, 2018
Copyright 2000 – 2018 Zeal LLC (www.ZealLLC.com)
If you would like to receive our free newsletter via email, simply enter your email address below & click subscribe.
 Follow us on Twitter
 Become our facebook fan
CONNECT WITH US
Tweets
Tweet with hash tag #miningfeeds or @miningfeeds and your tweets will be displayed across this site.
MOST ACTIVE MINING STOCKS
Daily Gainers
 CMC Metals Ltd. CMC Metals Ltd. |
CMB.V | +900.00% |
 Eden Energy Ltd Eden Energy Ltd |
EDE.AX | +200.00% |
| GoviEx Uranium Inc. |
GXU.V | +42.86% |
| Eagle Nickel Ltd. |
ENL.AX | +41.67% |
| Citigold Corp. Limited |
CTO.AX | +33.33% |
| Mount Burgess Mining NL |
MTB.AX | +33.33% |
| Exalt Resources Limited |
ERD.AX | +31.94% |
| Casa Minerals Inc. |
CASA.V | +30.00% |
| Cariboo Rose Resources Ltd |
CRB.V | +28.57% |
| Belmont Resources Inc. |
BEA.V | +28.57% |