
The major silver miners’ stocks have been thrashed, pummeled to brutal multi-year lows. They suffered serious collateral damage as silver plunged on gold’s breakdown, driven by crazy-extreme all-time-record silver-futures short selling. All this technical carnage left investors reeling, devastating sentiment. The silver miners’ recently-reported Q2’18 results reveal whether their anomalous plunge was justified fundamentally.
Four times a year publicly-traded companies release treasure troves of valuable information in the form of quarterly reports. Companies trading in the States are required to file 10-Qs with the US Securities and Exchange Commission by 45 calendar days after quarter-ends. Canadian companies have similar requirements. In other countries with half-year reporting, many companies still partially report quarterly.
Unfortunately the universe of major silver miners to analyze and invest in is pretty small. Silver mining is a tough business both geologically and economically. Primary silver deposits, those with enough silver to generate over half their revenues when mined, are quite rare. Most of the world’s silver ore formed alongside base metals or gold. Their value usually well outweighs silver’s, relegating it to byproduct status.
The Silver Institute has long been the authority on world silver supply-and-demand trends. It published its latest annual World Silver Survey covering 2017 in mid-April. Last year only 28% of the silver mined around the globe came from primary silver mines! 36% came from primary lead/zinc mines, 23% copper, and 12% gold. That’s nothing new, the silver miners have long supplied less than a third of world mined supply.
It’s very challenging to find and develop the scarce silver-heavy deposits supporting primary silver mines. And it’s even harder forging them into primary-silver-mining businesses. Since silver isn’t very valuable, most silver miners need multiple mines in order to generate sufficient cash flows. Traditional major silver miners are increasingly diversifying into gold production at silver’s expense, chasing its superior economics.
So there aren’t many major silver miners left out there, and their purity is shrinking. The definitive list of these companies to analyze comes from the most-popular silver-stock investment vehicle, the SIL Global X Silver Miners ETF. In mid-August at the end of Q2’s earnings season, SIL’s net assets were running 6.7x greater than its next-largest competitor’s. So SIL continues to dominate this small niche contrarian sector.
While SIL has its flaws, it’s the closest thing we have to a silver-stock index. As ETF investing continues to eclipse individual-stock picking, SIL inclusion is very important for silver miners. It grants them better access to the vast pools of stock-market capital. Differential SIL-share buying by investors requires this ETF’s managers to buy more shares in its underlying component companies, bidding their stock prices higher.
In mid-August as the silver miners were finishing reporting their Q2’18 results, SIL included 23 “Silver Miners”. Unfortunately the great majority aren’t primary silver miners, most generate well under half their revenues from silver. That’s not necessarily an indictment against SIL’s stock picking, but a reflection of the state of this industry. There aren’t enough significant primary silver miners left to fully flesh out an ETF.
This disappointing reality makes SIL somewhat problematic. The only reason investors would buy SIL is they want silver-stock exposure. But if SIL’s underlying component companies generate just over a third of their sales from silver mining, they aren’t going to be very responsive to silver price moves. And most of that ETF capital intended to go into primary silver miners is instead diverted into byproduct silver miners.
So silver-mining ETFs sucking in capital investors thought they were allocating to real primary silver miners effectively starves them. Their stock prices aren’t bid high enough to attract in more investors, so they can’t issue sufficient new shares to finance big silver-mining expansions. This is exacerbating the silver-as-a-byproduct trend. Only sustained much-higher silver prices for years to come could reverse this.
Every quarter I dig into the latest results from the major silver miners of SIL to get a better understanding of how they and this industry are faring fundamentally. I feed a bunch of data into a big spreadsheet, some of which made it into the table below. It includes key data for the top 17 SIL component companies, an arbitrary number that fits in this table. That’s a commanding sample at 95.8% of SIL’s total weighting!
While most of these top 17 SIL components had reported on Q2’18 by mid-August, not all had. Some of these major silver miners trade in the UK or Mexico, where financial results are only required in half-year increments. If a field is left blank in this table, it means that data wasn’t available by the end of Q2’s earnings season. Some of SIL’s components also report in gold-centric terms, excluding silver-specific data.
The first couple columns of this table show each SIL component’s symbol and weighting within this ETF as of mid-August. While most of these stocks trade on US exchanges, some symbols are listings from companies’ primary foreign stock exchanges. That’s followed by each miner’s Q2’18 silver production in ounces, along with its absolute year-over-year change. Next comes this same quarter’s gold production.
Nearly all the major silver miners in SIL also produce significant-to-large amounts of gold! That’s truly a double-edged sword. While gold really stabilizes and boosts silver miners’ cash flows, it also retards their stocks’ sensitivity to silver itself. So the next column reveals how pure these elite silver miners are, approximating their percentages of Q2’18 revenues actually derived from silver. This is calculated two ways.
The large majority of these top SIL silver miners reported total Q2 revenues. Quarterly silver production multiplied by silver’s average price in Q2 can be divided by these sales to yield an accurate relative-purity gauge. When Q2 sales weren’t reported, I estimated them by adding silver sales to gold sales based on their production and average quarterly prices. But that’s less optimal, as it ignores any base-metals byproducts.
Next comes the major silver miners’ most-important fundamental data for investors, cash costs and all-in sustaining costs per ounce mined. The latter directly drives profitability which ultimately determines stock prices. These key costs are also followed by YoY changes. Last but not least the annual changes are shown in operating cash flows generated and hard GAAP earnings, with a couple exceptions necessary.
Percentage changes aren’t relevant or meaningful if data shifted from positive to negative or vice versa, or if derived from two negative numbers. So in those cases I included raw underlying data rather than weird or misleading percentage changes. This whole dataset together offers a fantastic high-level read on how the major silver miners are faring fundamentally as an industry. Was their recent plunge righteous?
Production is naturally the lifeblood of the silver-mining sector. The more silver and increasingly gold that these elite miners can wrest from the bowels of the earth, the stronger their fundamental positions and outlooks. These top 17 SIL silver miners failed to increase their mining tempos over this past year. Their collective silver and gold production deteriorated 4.4% and 2.1% YoY to 75.1m and 1327k ounces mined.
According to the Silver Institute’s latest WSS, total world silver mine production averaged 213.0m ounces per quarter in 2017. So at 75.1m in Q2, these top 17 SIL components were responsible for 35.3% of that rate. And their overall production decline last quarter is misleading, heavily skewed by two outliers with unusual situations. Tahoe Resources and SSR Mining reported huge 100.0% and 46.3% YoY production plunges!
Without TAHO and SSRM, the rest of these elite silver miners were able to grow their collective silver production by a decent 2.0% YoY. That’s impressive considering the miserable silver-price environment. Between Q2’17 and Q2’18, the average quarterly silver price slumped 3.9% to $16.51. That was really weak compared to gold, which actually rose 3.9% in quarterly-average terms to $1306 across these quarters.
Silver has always been driven by gold, effectively acting like a gold sentiment gauge. Generally big silver uplegs only happen after gold has rallied long enough and high enough to convince traders its gains are sustainable. Then the way-smaller silver market tends to start leveraging and amplifying gold’s moves by 2x to 3x. But gold sentiment was so insipid over this past year that no excitement was sparked for silver.
Yet the top 17 SIL silver miners excluding TAHO and SSRM were able to buck those silver headwinds to still grow production. That is setting up these companies for stronger profits growth once silver’s price inevitably mean reverts higher. It’s important to understand what’s going on with TAHO and SSRM though, as these are long-time favorites among American investors. TAHO’s silver production should return.
Tahoe was originally spun off by Goldcorp to develop the incredible high-grade Escobal silver mine in Guatemala, which went live in Q4’13. Everything went well for its first few years. By Q1’17, Escobal was a well-oiled machine producing 5700k ounces of silver. That provided 1000+ great high-paying jobs to locals and contributed big taxes to Guatemala’s economy. Escobal was a great economic boon for this country.
But a radical group of anti-mining activists managed to spoil everything, cruelly casting their fellow countrymen out of work. They filed a frivolous and baseless lawsuit against Guatemala’s Ministry of Energy and Mines, Tahoe wasn’t even the target! It alleged this regulator had not sufficiently consulted with the indigenous Xinca people before granting Escobal’s permits. And they don’t even live around this mine site.
Only in a third-world country plagued with rampant government corruption would a regulator apparently not holding enough meetings be a company’s problem. Instead of resolving this, a high Guatemalan court inexplicably actually suspended Escobal’s mining license in early Q3’17! Tahoe was forced to temporarily mothball its crown-jewel silver mine, and thus eventually lay off its Guatemalan employees.
That license was technically reinstated a couple months later, but the activists appealed to a higher court. It required the regulator to study the indigenous people in surrounding areas and report back, and now needs to make a decision. The government also needs to clear out an illegal roadblock to the mine site by violent anti-mine militants, who have blockaded Escobal supplies and physically attacked trucks and drivers!
So Escobal has been dead in the water with zero production for an entire year, an unthinkable outcome. This whole thing is a farce, a gross miscarriage of justice. Sooner or later the Guatemalan bureaucrats will get all their useless paperwork done and Escobal will come back online. After a few quarters or so of spinning back up, Escobal’s silver production should return to pre-fiasco levels around 5700k ounces a quarter.
That would boost SIL’s top 17 components’ current overall silver production by 7.6%. In my decades of intensely researching and actively trading mining stocks, I’ve never seen anything like this Escobal debacle. While TAHO’s cashflows are really impaired without this silver mine which was actually the world’s largest primary, it can weather this nightmare because of its other gold mines that yielded 102.6k ounces in Q2’18.
Thankfully SSR Mining’s silver-production plunge is far less dramatic. This company used to be known as Silver Standard Resources, and its old Pirquitas silver mine is simply depleting as forecast. SSRM is exploring in the area trying to extend the life of this old mine, which was joint-ventured and renamed the Puna Operations. But most of SSRM’s resources are being poured into its far-more-profitable gold mines.
That gold focus among these top silver miners is common across SIL’s components. As the silver-percentage column above shows, most of these elite silver miners are actually primary gold miners by revenue! Only 3 of these 17 earned more than half of their Q2’18 sales from mining silver, and they are highlighted in blue. WPM, PAAS, and TAHO are also top-34 components in the leading GDX gold miners’ ETF!
While they only comprised 7.8% of GDX’s total weighting in mid-August, this highlights how difficult it is to find primary silver miners. SIL’s managers have an impossible job these days with the major silver miners increasingly shifting to gold. They are really scraping the bottom of the barrel to find more silver miners. In Q3’17 they added Korea Zinc, and it’s now SIL’s 3rd-biggest holding with a hefty 11.9% total weighting.
That was intriguing, as I’d never heard of this company after decades deeply immersed in this small silver-mining sector. So I looked into Korea Zinc and found it was merely a smelter, not even a miner! Its English-language disclosures are atrocious, starting with its homepage reading “We are Korea Zinc, the world’s one of the best smelting company”. The latest production data I can find in English is still 2015’s.
That year Korea Zinc “produced” 63.3m ozs of silver, which averages to 15.8m quarterly. That is largely a byproduct from its main businesses of smelting zinc, lead, copper, and gold. The fact SIL’s managers included a company like this that doesn’t even mine silver as a top SIL component shows how rare major silver miners have become. The economics of silver mining at today’s prices are way inferior to gold mining.
The traditional major silver miners are painfully aware of this, and have spent years actively diversifying into gold. In Q2’18, the average percentage of revenues these top 17 SIL miners derived from silver was only 36.3%. That’s right in line with the recent trend, with the prior four quarters seeing 36.1%, 39.3%, 35.3%, and 36.4%. This relatively-low silver exposure is why SIL isn’t as responsive to silver as investors expect.
Silver mining is every bit as capital-intensive as gold mining, requiring similar large expenses for planning, permitting, and constructing mines and mills. It needs similar heavy excavators and haul trucks to dig and move the silver-bearing ore. Similar levels of employees are necessary to run these mines. But silver generates much lower cash flows due to its lower price. Consider hypothetical mid-sized silver and gold mines.
They might produce 10m and 300k ounces annually. At last quarter’s average prices, these silver and gold mines would yield $165m and $392m of yearly sales. Unfortunately it is far easier to pay the bills mining gold these days. So primary silver miners are increasingly becoming a dying breed, which is sad. The traditional major silver miners are adapting by ramping their gold production often at silver’s expense.
This industry’s flagging silver purity and thus deteriorating responsiveness to silver price trends will be hard to reverse. Silver would need to far outperform gold, rocketing higher in one of its gigantic uplegs while gold lags. And it would have to stay relatively strong compared to gold for years after that to entice big capital spending back into primary silver mines. While possible, that seems like a stretch in today’s markets.
Unfortunately SIL’s mid-August composition was such that there wasn’t a lot of Q2 cost data reported by its top component miners. A half-dozen of these top SIL companies trade in the UK, South Korea, Mexico, and Peru, where reporting only comes in half-year increments. There are also primary gold miners that don’t report silver costs, and a silver explorer with no production. So silver cost data remains scarce.
Nevertheless it’s always useful to look at what we have. Industrywide silver-mining costs are one of the most-critical fundamental data points for silver-stock investors. As long as the miners can produce silver for well under prevailing silver prices, they remain fundamentally sound. Cost knowledge helps traders weather this sector’s occasional fear-driven plunges without succumbing to selling low like the rest of the herd.
There are two major ways to measure silver-mining costs, classic cash costs per ounce and the superior all-in sustaining costs. Both are useful metrics. Cash costs are the acid test of silver-miner survivability in lower-silver-price environments, revealing the worst-case silver levels necessary to keep the mines running. All-in sustaining costs show where silver needs to trade to maintain current mining tempos indefinitely.
Cash costs naturally encompass all cash expenses necessary to produce each ounce of silver, including all direct production costs, mine-level administration, smelting, refining, transport, regulatory, royalty, and tax expenses. In Q2’18, these top 17 SIL-component silver miners that reported cash costs averaged just $3.95 per ounce! That plunged a whopping 37.6% YoY, making it look like these miners are getting more efficient.
But that’s misleading. Because of hefty byproduct credits from gold and base metals, Hecla Mining and Fortuna Silver Mines both reported negative cash costs in Q2. They are an accounting fiction, as mining silver still costs a lot of money. But crediting byproduct sales to silver can slash reported cash costs. In the comparable quarter a year earlier, there were no negative cash costs at any of SIL’s top 17 miners.
Those super-low cash costs offset SSR Mining’s crazy-high $14.73 per ounce. That’s not normal either, the result of that winding down of its lone silver mine. Excluding these extreme outliers, the remaining handful of silver miners had average cash costs of $4.83 per ounce. As long as silver prices stay above those levels, the silver miners can keep the lights on at their mines. Sub-$5 silver is wildly inconceivable!
Way more important than cash costs are the far-superior all-in sustaining costs. They were introduced by the World Gold Council in June 2013 to give investors a much-better understanding of what it really costs to maintain silver mines as ongoing concerns. AISCs include all direct cash costs, but then add on everything else that is necessary to maintain and replenish operations at current silver-production levels.
These additional expenses include exploration for new silver to mine to replace depleting deposits, mine-development and construction expenses, remediation, and mine reclamation. They also include the corporate-level administration expenses necessary to oversee silver mines. All-in sustaining costs are the most-important silver-mining cost metric by far for investors, revealing silver miners’ true operating profitability.
In Q2’18 these top 17 SIL miners reporting AISCs averaged just $10.93 per ounce! That was down 6.3% YoY, and was way below silver’s average price of $16.51 last quarter. Even if the two extreme outliers are thrown out, SSRM’s abnormally-high mine-depletion $17.66 AISC and SVM’s incredibly-low huge-byproduct-credit $0.41 AISC, the remaining average is similar at $11.56. Silver mining remains very profitable!
Even at worst in August’s plunge driven by speculators’ crazy-extreme all-time-record silver-futures short selling, silver merely hit $14.44 on close. That’s still way above this industry’s total production costs any way you slice it. That implies even at peak fear the elite top silver miners of SIL were still earning hefty 24% profit margins! So there’s no doubt the recent frantic silver-stock selling wasn’t fundamentally righteous.
SIL getting hammered to deep 2.5-year lows in mid-August was the product of irrational fear run amok, it had nothing to do with how the silver miners are faring. At Q2’s average silver price and AISCs, these miners were earning $5.58 per ounce. Most other industries would die for such 34% margins. And those are going to explode higher as silver inevitably mean reverts back up again, probably violently given this setup.
Silver stocks plunged in August because silver did. That was driven by truly-extreme silver-futures short selling by speculators. They ramped their shorts to a wild new all-time record high of 114.5k contracts in mid-August! All that short selling is guaranteed proportional near-future buying, as excessive shorts must be closed by buying offsetting long contracts. Short-covering rallies are self-feeding, catapulting silver higher.
The more speculators buy to cover, the faster silver surges. The faster it surges, the more they have to buy to cover or face catastrophic losses due to the extreme leverage inherent in silver futures. It would take 73.0k contracts of buying to return spec shorts to their 52-week low seen in mid-September 2017. That’s the equivalent of 364.9m ounces, or nearly 43% of last year’s entire global mined supply! Talk about big.
And today’s silver prices are super-low relative to prevailing gold levels, portending huge mean-reversion upside. The long-term average Silver/Gold Ratio runs around 56x, which means it takes 56 ounces of silver to equal the value of one ounce of gold. Silver is greatly underperforming gold so far in 2018, with the SGR averaging a stock-panic-like 80.2x thus far in August! So silver is overdue to catch up with gold.
At a 56x SGR and $1200 gold, silver is easily heading near $21.50. That’s 30% above its Q2 average. Assuming the major silver miners’ all-in sustaining costs hold, that implies profits per ounce soaring 89% higher! And the record silver-futures short covering necessary after record silver-futures short selling is very likely to fuel a massive mean-reversion overshoot, making the silver-mining-profits upside much greater.
And silver miners’ AISCs generally don’t change much regardless of prevailing silver prices, since silver-mining costs are largely fixed during mine planning and construction. The top 17 SIL miners’ AISCs in the past four quarters averaged $11.66, $9.73, $10.16, and $10.92. So Q2’18’s $10.93 was right in line. Costs aren’t going to rise much as silver recovers, and higher production may even push them lower still.
While all-in sustaining costs are the single-most-important fundamental measure that investors need to keep an eye on, other metrics offer peripheral reads on the major silver miners’ fundamental health. The more important ones include cash flows generated from operations, GAAP accounting profits, revenues, and cash on hand. They were all decent to healthy in Q2’18 despite the low silver prices and weak sentiment.
These SIL-top-17 silver miners’ collective revenues only fell 1.5% YoY to $3114m. That reflects higher gold prices which offset the lower silver ones. That drove operating-cash-flow generation of $758m, which was 27.0% lower YoY. That’s not unreasonable given the 3.9% lower average silver prices from Q2’17 to Q2’18 and the 4.4% lower silver production among these elite silver majors. Cash flows remain fine.
These silver miners’ balance-sheet cash and short-term investments still powered 18.0% higher YoY to $3637m. The bigger their cash hoards, the easier the elite silver miners can weather these weak silver prices. Big treasuries also give them more capital to expand existing mines and buy or build new ones. A fundamental surprise seemed to come in hard GAAP accounting profits though, which soared 110.6% YoY!
But the $343m total earnings in Q2’18 were wildly skewed by a huge $246m non-recurring gain Wheaton Precious Metals reported. 77% of its massive $318m in profits came from gains on the sale of one of its silver streams. Back that out of overall top-17-SIL-component earnings, and they actually plunged 40.3% YoY. But they were still positive at $97m, and have incredible upside potential as silver’s price inevitably recovers.
The silver-mining stocks are doing way better fundamentally than they’ve been given credit for. Their mining costs remain far below prevailing silver levels, driving strong profitability even at August’s deep silver-price lows. That capitulation silver-stock plummeting fueled by cascading selling as stop losses were sequentially run wasn’t justified fundamentally. It was an extreme sentiment anomaly that can’t persist.
So a big mean-reversion rebound higher is inevitable and imminent. While traders can play that in SIL, that’s mostly a bet on primary gold miners with byproduct silver production. The best gains by far will be won in smaller purer mid-tier and junior silver miners with superior fundamentals. A carefully-handpicked portfolio of these miners will generate much-greater wealth creation than ETFs dominated by non-primary miners.
At Zeal we’ve literally spent tens of thousands of hours researching individual silver stocks and markets, so we can better decide what to trade and when. As of the end of Q2, this has resulted in 1012 stock trades recommended in real-time to our newsletter subscribers since 2001. Fighting the crowd to buy low and sell high is very profitable, as all these trades averaged stellar annualized realized gains of +19.3%!
The key to this success is staying informed and being contrarian. That means buying low when others are scared, before undervalued silver stocks soar much higher. An easy way to keep abreast is through our acclaimed weekly and monthly newsletters. They draw on my vast experience, knowledge, wisdom, and ongoing research to explain what’s going on in the markets, why, and how to trade them with specific stocks. Subscribe today while great silver stocks remain dirt-cheap!
The bottom line is the major silver miners’ fundamentals remain solid based on their recently-reported Q2’18 results. They continue to mine silver at all-in sustaining costs far below even mid-August’s deep silver lows. Their still-impressive profits will multiply as silver rebounds higher violently on record futures short covering. Investment capital will flood back into this tiny sector, catapulting silver stocks up sharply.
So traders need to look through the recent frightened herd sentiment to understand the silver miners’ hard fundamentals. These forsaken stocks are radically undervalued even at today’s low silver prices, let alone where silver heads during the next major gold upleg. Silver is poised to rocket higher soon as that mandatory extreme short covering gets underway. So the opportunities to buy dirt-cheap miners are fleeting.
The junior gold miners’ stocks have been thrashed in August, plummeting to brutal multi-year lows. Such carnage naturally left sentiment far more bearish than usual in this forsaken contrarian sector. But these extremely-battered gold-stock prices certainly aren’t justified fundamentally. Junior gold miners’ collective results from their just-completed Q2’18 earnings season prove their stock prices need to mean revert way higher.
Four times a year publicly-traded companies release treasure troves of valuable information in the form of quarterly reports. Companies trading in the States are required to file 10-Qs with the US Securities and Exchange Commission by 45 calendar days after quarter-ends. Canadian companies have similar requirements. In other countries with half-year reporting, many companies still partially report quarterly.
The definitive list of elite “junior” gold stocks to analyze comes from the world’s most-popular junior-gold-stock investment vehicle. This week the GDXJ VanEck Vectors Junior Gold Miners ETF reported $4.5b in net assets. Among all gold-stock ETFs, that was second only to GDX’s $8.4b. That is GDXJ’s big-brother ETF that includes larger major gold miners. GDXJ’s popularity testifies to the great allure of juniors.
Unfortunately this fame created serious problems for GDXJ a couple years ago, resulting in a stealthy major mission change. This ETF is quite literally the victim of its own success. GDXJ grew so large in the first half of 2016 as gold stocks soared in a massive upleg that it risked running afoul of Canadian securities laws. And most of the world’s smaller gold miners and explorers trade on Canadian stock exchanges.
Since Canada is the center of the junior-gold universe, any ETF seeking to own this sector will have to be heavily invested there. But once any investor including an ETF buys up a 20%+ stake in any Canadian stock, it is legally deemed to be a takeover offer that must be extended to all shareholders! As capital flooded into GDXJ in 2016 to gain junior-gold exposure, its ownership in smaller components soared near 20%.
Obviously hundreds of thousands of investors buying shares in an ETF have no intention of taking over gold-mining companies, no matter how big their collective stakes. That’s a totally-different scenario than a single corporate investor buying 20%+. GDXJ’s managers should’ve lobbied Canadian regulators and lawmakers to exempt ETFs from that 20% takeover rule. But instead they chose an inferior, easier fix.
Since GDXJ’s issuer controls the junior-gold-stock index underlying its ETF, it simply chose to unilaterally redefine what junior gold miners are. It rejiggered its index to fill GDXJ’s ranks with larger mid-tier gold miners, while greatly demoting true smaller junior gold miners in terms of their ETF weightings. This controversial move defying long decades of convention was done quietly behind the scenes to avoid backlash.
There’s no formal definition of a junior gold miner, which gives cover to GDXJ’s managers pushing the limits. Major gold miners are generally those that produce over 1m ounces of gold annually. For decades juniors were considered to be sub-200k-ounce producers. So 300k ounces per year is a very-generous threshold. Anything between 300k to 1m ounces annually is in the mid-tier realm, where GDXJ now traffics.
That high 300k-ounce-per-year junior cutoff translates into 75k ounces per quarter. Following the end of the gold miners’ Q2’18 earnings season in mid-August, I dug into the top 34 GDXJ components’ results. That’s simply an arbitrary number that fits neatly into the tables below. Although GDXJ included a staggering 71 component stocks this week, the top 34 accounted for a commanding 81.1% of its total weighting.
Out of these top 34 GDXJ companies, only 4 primary gold miners met that sub-75k-ounce-per-quarter qualification to be a junior gold miner! Their quarterly production is rendered in blue below, and they collectively accounted for just 8.9% of GDXJ’s total weighting. But even that is really overstated, as 3 of these are long-time traditional major silver miners that are increasingly diversifying into gold in recent years.
GDXJ is inarguably now a pure mid-tier gold-miner ETF, and really ought to be advertised as such. While its holdings include some of the world’s best gold miners with huge upside potential, the great majority definitely aren’t classic junior gold miners. At least this ETF’s big composition changes are stabilizing, as Q2’18 was the first quarter since mid-2016 where GDXJ’s components didn’t radically change year-over-year.
I’ve been doing these deep quarterly dives into GDXJ’s top components for years now. In Q2’18, fully 32 of the top 34 GDXJ components were also GDX components! These are separate and distinct ETFs, a “Gold Miners ETF” and a “Junior Gold Miners ETF”. So they shouldn’t have to own many of the same companies. In the tables below I highlighted the symbols of rare GDXJ components not also in GDX in yellow.
These 32 GDX components accounted for 78.4% of GDXJ’s total weighting, not just its top 34. They also represented 38.0% of GDX’s total weighting. Thus nearly 4/5ths of this “Junior Gold Miners ETF” is made up by over 3/8ths of the major “Gold Miners ETF”! These GDXJ components also in GDX start at the 10th-highest weighting in that latter larger ETF and extend down to 47th. GDXJ is mostly smaller GDX stocks.
In a welcome change from GDXJ’s vast component turmoil of recent years, only 2 of its top 34 stocks are new since Q2’17. Their symbols are highlighted in light blue below. Thus the top GDXJ components’ collective results are finally getting comparable again in year-over-year terms. Analyzing ETFs is much easier if their larger components aren’t constantly in flux. Hopefully changes going forward are relatively minor.
Despite all this, GDXJ remains the leading “junior-gold” benchmark. So every quarter I wade through tons of data from its top components’ latest results, and dump it into a big spreadsheet for analysis. The highlights make it into these tables. Most of these top 34 GDXJ gold miners trade in the US and Canada, where comprehensive quarterly reporting is required by regulators. But others trade in Australia and the UK.
In these countries and most of the rest of the world, regulators only mandate that companies report their results in half-year increments. Some do still issue quarterly production reports, but don’t release financial statements. There are wide variations in reporting styles, data presented, and release timing. So blank fields in these tables mean a company hadn’t reported that particular data for Q2’18 as of this Wednesday.
The first couple columns of these tables show each GDXJ component’s symbol and weighting within this ETF as of this week. While most of these stocks trade on US exchanges, some symbols are listings from companies’ primary foreign stock exchanges. That’s followed by each gold miner’s Q2’18 production in ounces, which is mostly in pure-gold terms. That excludes byproduct metals often present in gold ore.
Those are usually silver and base metals like copper, which are valuable. They are sold to offset some of the considerable costs of gold mining, lowering per-ounce costs and thus raising overall profitability. In cases where companies didn’t separate out gold and lumped all production into gold-equivalent ounces, those GEOs are included instead. Then production’s absolute year-over-year change from Q2’17 is shown.
Next comes gold miners’ most-important fundamental data for investors, cash costs and all-in sustaining costs per ounce mined. The latter directly drives profitability which ultimately determines stock prices. These key costs are also followed by YoY changes. Last but not least the annual changes are shown in operating cash flows generated, hard GAAP earnings, sales, and cash on hand with a couple exceptions.
Percentage changes aren’t relevant or meaningful if data shifted from positive to negative or vice versa, or if derived from two negative numbers. So in those cases I included raw underlying data rather than weird or misleading percentage changes. This whole dataset together offers a fantastic high-level read on how the mid-tier gold miners are faring fundamentally as an industry. August’s plunge wasn’t righteous.
It was great to see GDXJ’s top 34 components almost unchanged from Q2’17, with only two new stocks in those ranks. My previous essays on GDXJ components’ quarterly results had been a sea of light blue since 2016. But one of the new components in Q2’18 is inexplicably the giant largely-African miner AngloGold Ashanti. It produced an enormous 805k ounces of gold last quarter, the largest in GDXJ by far.
Remember that major-gold-miner threshold has long been 1m+ ounces per year. AU’s production is annualizing to over 3x that, making this company the world’s 3rd-largest gold miner last quarter. Why on earth would managers running a “Junior Gold Miners ETF” even consider AngloGold Ashanti? It is as far from junior-dom as gold miners get. Having so many of the same stocks in both GDXJ and GDX is a big problem.
Such massive overlap between these two ETFs is a huge lost opportunity for VanEck. It owns and manages GDX, GDXJ, and even the MVIS indexing company that decides exactly which gold stocks are included in each. With one company in total control, there’s no need for any overlap in the underlying companies of what should be two very-different gold-stock ETFs. Inclusion ought to be mutually-exclusive.
VanEck could greatly increase the utility of its gold-stock ETFs and thus their ultimate success by starting with one big combined list of the world’s better gold miners. Then it could take the top 20 or 25 in terms of annual gold production and assign them to GDX. Based on Q2’18 production, that would run down near 127k or 92k ounces per quarter. Then the next-largest 30 or 40 gold miners could be assigned to GDXJ.
Getting smaller gold miners back into GDXJ would be a huge boon for the junior-gold-mining industry. Most investors naturally assume this “Junior Gold Miners ETF” owns junior gold miners, which is where they are trying to allocate their capital. But since most of GDXJ’s funds are instead diverted into much-larger mid-tiers and even some majors, the juniors are effectively being starved of capital intended for them.
That’s one of the big reasons smaller gold miners’ stock prices are so darned low. They aren’t getting enough capital inflows from gold-stock-ETF investing. So their share prices aren’t bid higher. They rely on issuing shares to finance their exploration projects and mine builds. But when their stock prices are down in the dumps, that is heavily dilutive. So GDXJ is strangling the very industry its investors want to own!
Back to these mid-tier gold miners’ Q2’18 results, production is the best place to start since that is the lifeblood of the entire gold-mining industry. These top 34 GDXJ gold miners that had specifically reported Q2 production as of the middle of this week produced 4467k ounces. That surged a massive 24.7% YoY, implying these miners are thriving. But that’s almost all driven by that huge 805k-ounce boost from AU’s inclusion.
Without AngloGold Ashanti which wasn’t there in Q2’17, the rest of the top 34 GDXJ gold miners saw their total production climb 2.2% YoY to 3662k ounces. That’s a little behind the 3.0% annual growth in overall global mine production in Q2’18 according to the World Gold Council’s latest Gold Demand Trends report. But these mid-tier miners are still faring far better than the majors that dominate that other GDX ETF.
As discussed last week in my essay on the GDX gold miners’ Q2’18 results, their production adjusted for quarterly data availability plunged a sharp 7.7% YoY! With big economically-viable gold deposits getting increasingly hard to discover, the majors are really struggling to replace depleting production. So much of the growth is coming from the mid-tiers and juniors, which will help their stock prices outperform the majors.
Starting from far-lower production bases, most of the smaller gold miners can ramp production by adding single new mines. These are often modest in scale and cost compared to the giant mines the majors need to target. Since growing production greatly boosts profits, investment capital will increasingly flow into mid-tier gold miners in coming years. So GDXJ’s upside should well outpace the major-dominated GDX’s.
For all GDXJ’s faults, it does still offer investors exposure to much-smaller gold miners. The average quarterly production of all the top 34 GDXJ miners reporting it in Q2 was 144.1k ounces. That is 44% smaller than the 258.3k averaged by the top 34 GDX miners last quarter. And again AU’s crazy inclusion really skews this. Ex-AU, the GDXJ average falls to 122.1k. That annualizes to 488k, solidly in the mid-tier realm.
With today’s set of top-34 GDXJ gold miners achieving relatively-good production growth, their costs per ounce should’ve declined proportionally. Higher production yields more gold to spread mining’s big fixed costs across. And lower per-ounce costs naturally lead to higher profits. So production growth is highly sought after by gold-stock investors, with companies able to achieve it commanding premium prices.
There are two major ways to measure gold-mining costs, classic cash costs per ounce and the superior all-in sustaining costs per ounce. Both are useful metrics. Cash costs are the acid test of gold-miner survivability in lower-gold-price environments, revealing the worst-case gold levels necessary to keep the mines running. All-in sustaining costs show where gold needs to trade to maintain current mining tempos indefinitely.
Cash costs naturally encompass all cash expenses necessary to produce each ounce of gold, including all direct production costs, mine-level administration, smelting, refining, transport, regulatory, royalty, and tax expenses. In Q2’18, these top 34 GDXJ-component gold miners that reported cash costs averaged $631 per ounce. That was actually up a slight 0.5% YoY, contrary to what you’d expect with higher production.
The majority of reporting gold miners saw cash costs rise significantly last quarter. There were plenty of challenges at various individual mines, including unexpected downtimes and lower ore grades. Both of those yield fewer ounces to bear the burden of gold mining’s big fixed costs. General price inflation is also mounting thanks to the trillions of dollars of money central banks conjured out of thin air over the past decade.
$631 per ounce is still very healthy, not much worse than the GDX majors’ average of $610 last quarter. That means these elite mid-tier gold miners could temporarily weather gold prices way down into the mid-$600s and still keep their mines running! At worst in mid-August, gold plunged to $1174 on close driven by epic all-time-record gold-futures short selling. Gold had fallen 4.1% month-to-date by that point, a big loss.
But the GDXJ gold miners suffered disproportionally, with this ETF’s price plummeting 15.5% MTD in sympathy with gold! That 3.8x downside leverage was excessive, the result of irrational herd sentiment. GDXJ’s share price was crushed to a brutal 2.4-year low, implying these miners are in fundamental peril. But with gold still trading a whopping 86% above their cash costs even at recent lows, that clearly wasn’t the case.
Way more important than cash costs are the far-superior all-in sustaining costs. They were introduced by the World Gold Council in June 2013 to give investors a much-better understanding of what it really costs to maintain gold mines as ongoing concerns. AISCs include all direct cash costs, but then add on everything else that is necessary to maintain and replenish operations at current gold-production levels.
These additional expenses include exploration for new gold to mine to replace depleting deposits, mine-development and construction expenses, remediation, and mine reclamation. They also include the corporate-level administration expenses necessary to oversee gold mines. All-in sustaining costs are the most-important gold-mining cost metric by far for investors, revealing gold miners’ true operating profitability.
These top 34 GDXJ gold miners reporting AISCs saw them average $886 per ounce in Q2’18. That was also up a modest 0.9% YoY, so costs didn’t decline proportionally with rising production. Still $886 is an excellent level compared to prevailing gold prices, and competitive with the GDX majors which averaged $856 last quarter. $886 is right in line with the past four quarters’ trend of $879, $877, $855, and $923 too.
The fundamental implications of this are very bullish, proving that this month’s gold-stock capitulation was purely an overdone herd-sentiment thing. Gold averaged $1306 in Q2’18, up 3.9% YoY. That means the top GDXJ gold miners were earning average profits just under $420 per ounce. Thanks to AISCs mostly holding the line and modestly-higher gold prices, those earnings rose a solid 10.7% YoY from $379 in Q2’17.
With gold mining considerably more profitable last quarter than a year earlier, you’d think the gold-stock prices would’ve been proportionally higher. Yet GDXJ’s average price in Q2 still slipped 1.1% lower YoY, which makes no sense fundamentally. And even if August’s capitulation-grade $1175 gold was able to magically persist as if those crazy-record gold-futures shorts were never covered, gold mining is still very profitable.
At Q2’18’s average AISCs which are again right in line with recent years’ levels, $1175 gold would still yield hefty $289-per-ounce profits for the mid-tier gold miners. Those don’t justify deep multi-year lows in gold-stock prices. And these profits will balloon dramatically as gold inevitably mean reverts much higher. Extreme gold-futures short-covering buying is imminent, and will be proportional to August’s record shorting.
The impact of higher gold prices on mid-tier-gold-miner profitability is easy to model. Assuming flat all-in sustaining costs at Q2’s $886 per ounce, 10%, 20%, and 30% gold rallies from mid-August’s lows would lead to collective gold-mining profits surging 40%, 81%, and 122%! And another 30% gold upleg isn’t a stretch at all. In the first half of 2016 alone after the first stock-market corrections in years, gold soared 29.9%.
GDXJ skyrocketed 202.5% higher in 7.0 months in largely that same span! Gold-mining profits and thus gold-stock prices surge dramatically when gold is powering higher. Years of neglect from investors have forced the gold miners to get lean and efficient, which will really amplify their fundamental upside during the next major gold upleg. The investors and speculators who buy in early and cheap could earn fortunes.
As long as the gold miners can produce gold at all-in sustaining costs way below prevailing gold prices, they will generate big profits for investors. Eventually their stock-price levels have to reflect their true underlying profitability. With $1175+ gold and $886 AISCs, the mid-tier gold miners’ stocks must mean revert way higher. Their extreme low levels today are fundamentally absurd, they can’t and won’t last for long.
With GDXJ’s radical composition changes finally settling down, the rest of its top 34 components’ core fundamentals are finally comparable year-over-year again. It’s nice to have that massive rejiggering in GDXJ’s underlying index past us. These elite mid-tier miners’ total revenues climbed 9.3% YoY to $5558m, well outpacing gold’s 3.9% YoY gain. That 2.2% higher production excluding AngloGold Ashanti also helped.
Those sales helped generate cash flows from operations of $1384m. While 5.1% lower YoY, that is still massively positive for this small contrarian sector. As long as gold mines are yielding far more cash than they cost to run, the mid-tier gold miners remain fundamentally healthy. Positive cash flows build capital necessary to expand operations, and helped drive these miners’ cash war chests up 9.3% YoY to $6784m in Q2.
But their hard GAAP profits as reported to regulators collectively looked terrible, collapsing from a strong $751m in Q2’17 to a big $146m loss in Q2’18! Is that the fundamental monkey wrench justifying these wretched stock-price levels? Not at all, as big unusual items flushed through bottom lines can make profits comparisons very misleading. There were two huge non-recurring items that mostly drove this big swing.
A year ago in Q2’17, elite mid-tier miner IAMGOLD reported a colossal $524m one-time non-cash gain from the reversal of mine-impairment charges. That accounted for nearly 70% of the top 34 GDXJ gold miners’ overall profits that quarter! Without that unusual item, their total Q2’17 profits were just $227m. Another unusual item heavily skewed last quarter’s latest profits, coming from mid-tier gold miner New Gold.
Gold mining is very challenging and risky, with many problems not evident until mining is well underway. New Gold’s serious troubles illustrate why diversifying capital across multiple gold miners is essential for all contrarian investors. NGD’s young Rainy River gold mine isn’t living up to potential due to variability in ore grades and processing. So in late July NGD slashed Rainy River’s 2018 production outlook by a huge 30%!
Not only did NGD’s stock crater, but this Rainy River situation is so bad New Gold recorded a $282m impairment charge on that mine! Such unusual non-recurring items flow directly into profits. Without that New Gold disaster, the top 34 GDJX gold miners’ total GAAP earnings in Q2’18 were $136m. While still down a major 40.2% YoY, that $91m drop is a fraction the size of the $897m including those unusual items.
The mid-tier gold miners’ recently-reported solid-to-strong Q2’18 results prove that their brutal plunge in August wasn’t fundamentally righteous. Like all capitulations fueled by cascading stop-loss selling, it was merely a sentimental and technical thing. As gold surges on the record futures short-covering buying that is imminent, the battered gold stocks will mean revert dramatically higher. And the mid-tiers will lead the way.
While GDXJ should certainly no longer be advertised as a “Junior Gold Miners ETF”, it offers exposure to some of the best mid-tier gold miners on the planet. It’s really growing on me, I like this new GDXJ way better than GDX. That being said, GDXJ is still burdened by overdiversification and way too many gold miners that shouldn’t be in there. They are either too large, are saddled with inferior fundamentals, or both.
So the best way to play the gold miners’ coming massive mean-reversion bull is in individual stocks with superior fundamentals. Their gains will ultimately trounce the major ETFs like GDXJ and GDX. There’s no doubt carefully-handpicked portfolios of elite gold and silver miners will generate much-greater wealth creation. GDXJ’s component list is a great starting point, but pruning it way down offers far-bigger upside.
At Zeal we’ve literally spent tens of thousands of hours researching individual gold stocks and markets, so we can better decide what to trade and when. As of the end of Q2, this has resulted in 1012 stock trades recommended in real-time to our newsletter subscribers since 2001. Fighting the crowd to buy low and sell high is very profitable, as all these trades averaged stellar annualized realized gains of +19.3%!
The key to this success is staying informed and being contrarian. That means buying low when others are scared, before undervalued gold stocks soar much higher. An easy way to keep abreast is through our acclaimed weekly and monthly newsletters. They draw on my vast experience, knowledge, wisdom, and ongoing research to explain what’s going on in the markets, why, and how to trade them with specific stocks. Subscribe today and take advantage of our 20%-off summer-doldrums sale! We’re redeploying stopped capital in new gold-stock trades at extreme fire-sale prices.
The bottom line is the mid-tier gold miners reported solid-to-strong fundamentals in their recent Q2’18 results. They were able to modestly grow their production despite the majors’ falling rather sharply. More gold mined combined with essentially-flat costs and higher average gold prices fueled solid profits growth. The mid-tiers’ production costs were far below prevailing gold prices even at mid-August’s deep capitulation lows.
That gold plunge that dragged gold stocks sharply lower was driven by crazy-all-time-record gold-futures short selling. Those extreme positions must soon be closed with proportional buying, which will catapult gold sharply higher. With gold-stock prices trading at such fundamentally-absurd levels today, they ought to soar and really leverage gold’s coming mean-reversion gains. Their post-capitulation upside is huge.
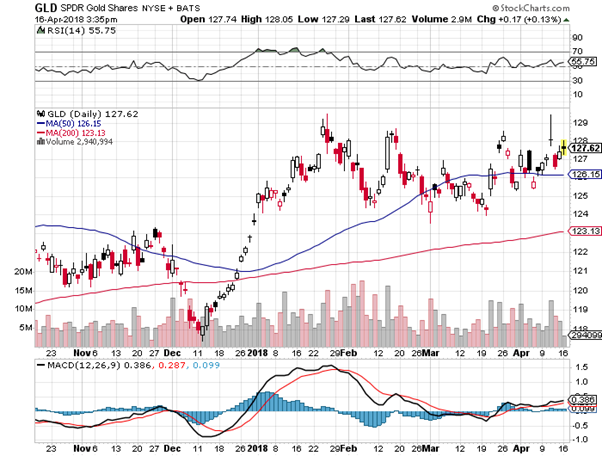
SPDR Gold Shares is an ETF that tracks the performance of gold in the financial markets. It is denominated by the ticker GLD and is one of the most widely watched gold indicators. The gold price is influenced by a unique set of factors. These include interest rates, the strength of the USD, supply and demand, etc. For casual traders, it’s important to know that gold is the go-to investment when equities markets sour.
When geopolitical uncertainty rocks the financial markets, investors typically flock to gold as a safe-haven asset. It tends to perform strongly when stock prices are volatile, and when the USD is weak. A strong dollar is a disincentive to gold investors, since gold is a dollar-denominated asset that appreciates when the precious metal is more affordable to foreign buyers.
GLD provides one access point to investments in gold (there are many options available), and it is priced at a fraction of the gold price. For example, GLD was trading around $127.62 per share (April 16, 2018), above both the 50-day moving average of $126.15, and the 200-day moving average of $123.13. This clearly illustrates that gold is bullish. Corroborating evidence is available from the anaemic performance of US stock markets.
- The Dow Jones has a year to date return of -0.43%
- The S&P 500 Index has a year to date return of 0.22%
- The NASDAQ Composite Index has a year to date return of 3.72%
Poor Stock Market Performance Feeds Gold Price
The 2018 performance of stock markets is precisely the cannon fodder that commodities like gold need to appreciate. When traders and investors are pulling their money from the stock market, they are either investing it in fixed-interest-bearing securities or shifting resources to gold stocks and physical gold.
The current price of gold (April 16, 2018) is $1,349.10 per ounce on the Comex. Gold was priced at around $1,316.10 on 2 January 2018, and it has consistently appreciated ever since. In percentage terms, gold is up 2.5% for the year to date. This represents the opposite of what we are seeing in equities markets, and it holds true from a theoretical perspective.
Commodities trading options include a wide range of choices These include physical assets, futures contracts, options, exchange traded funds, CFDs, stocks, and even binary options. Gold ranks as one of the most commonly traded commodities and has been a store of value for millennia. Its price is determined by supply & demand considerations, and it is heavily influenced by monetary policy (interest rate hikes), political considerations, and the strength of the USD. A useful barometer of USD strength or weakness is the US dollar index, DXY. This indicator tracks the performance of the greenback against a trade-weighted basket of currencies including the SEK, CAD, GBP, EUR, CHF, and JPY.
Trump and Oil Boosted Gold Prices in 2017
US stock markets have floundered in 2018, and gold is in the black. If we extrapolate back to 2017, gold traded at around $1,151 per ounce in January 2017 and by the end of the year it closed at over $1,309 per ounce. That represents a 13.8% appreciation in the gold price. Equities markets also defied gravity in 2017, with double digit gains for major bourses. It appears that confidence in gold was boosted by uncertainty with oil prices and additional uncertainty related to Trump’s election as president. We have seen a tempering of these concerns as time progressed, and gold has stabilized while equities markets have retreated.
- I’ve predicted that in 2018 the US stock market would suffer a series of crashes somewhat akin to the 1987 event, but smaller in size.
- Please click here now. Double-click to enlarge this interesting chart of the US stock market. Clearly, these mini-crashes are starting to happen.
- Having said that, I haven’t sold any of my US bank stocks and I have no plans to do so.
- To understand why I’m still “long and strong” the bank stocks in this environment, please click here now. Bank profits are soaring because of tax cuts, QT, and rate hikes.
- Corporate boards are still using the bulk of the profits for stock buybacks and bonuses for the “fat cats”, while throwing crumbs to the lower-paid workers.
- As disgusting as that is, it’s a good environment to own stock market indexes, and a great environment to own bank stocks.
- This is the stage of the business cycle where “big growth” transitions to “decent growth with inflation”. Simply put, in this environment bank stocks do well, growth stocks stumble, and gold stocks start to get modest liquidity flows from institutions.
- As the cycle moves to “inflation with low growth”, growth stocks crash, bank stocks fade, and gold stocks soar.
- Please click here now. Double-click to enlarge this key T-bond chart. US interest rates are rising now and poised to rise relentlessly for the next several years.
- There are “institutional thresholds” of importance in major markets. For the US stock market, institutions will generally continue to buy stocksuntil the ten-year yield reaches the 4%-5% range.
- Please click here now: http://www.graceland-updates.com/images/stories/18mar/2018mar27tenyearyield1.png Double-click to enlarge.
- Goldman is predicting four rate hikes this year and I’m predicting a minimum of three. The yield should get close to 4% by the end of this year.
- I realise that most gold bugs are “stock market crash enthusiasts”. There’s no question that the US stock market has soared mainly because the “hot air” of QE and low rates has incentivized corporate boards to focus on stock market buybacks rather than worker wages and business expansion.
- Having said that, patience is required. Investors need to focus on the slow but steady cyclical transition from growth to inflation as the Fed pushes the enormous QE money ball out of government bonds and into the fractional reserve banking system.
- Please click here now. Double-click to enlarge this fabulous daily gold chart. The rectangle pattern is flag-like, and suggests gold is coiling to burst above my key $1370 resistance zone.
- Short term traders who took my recommendation to buy the $1310 area should be sellers in this $1340-$1355 area. That’s because there could be quite a bit more coiling action before a true breakout above $1370 occurs. The bottom line is that investors need to be patient and traders need to book profits now!
- Looking at the big picture, the inflation trade is clearly becoming more positive for gold every day. The Trump decision to appoint John “The Hawk” Bolton to a key post in his administration makes the geopolitical trade for gold a positive one as well.
- What about the love trade? Well, please click here now. The 2019 Indian elections are approaching and the Modi government is likely to win again.
- Modi is backed with “monster money” and to ensure he wins again he’s launching a huge farm income program called MSP. This program is inflationary because it boosts crop prices. That alone is positive for the global price of gold.
- The MSP program also is poised to create a massive boost in farmer income, and rural Indians always use extra income to buy more gold. Please click here now. This MSP policy launch is happening at the same time as the influential Niti Aayog panel pushes the Modi government to implement a massive gold-positive policy agenda.
- I’ve been adamant that 2018 would see the absolute end of gold-negative policy from the Modi government, and the launch of positive policy. That’s clearly in play, and it’s going to exponentially accelerate relentlessly.
- Please click here now. Double-click to enlarge this GDX chart. The technical action is superb, and investors should now be buyers of their favourite GDX and GDXJ component stocks on all two and three-day pullbacks.
- Please click here now. Double-click to enlarge. With food inflation set to surge in India and general wage and price inflation on the move in America, it’s time for investors to take a more serious interest in silver stocks. The big upside action won’t start until there’s a volume-based breakout from the bull wedge pattern on this silver stocks ETF chart.
- Call option buyers should wait for that breakout before buying, but all silver stock enthusiasts should be buyers of key SIL component stocks right now. Use two and three-day pull backs to take buy-side action, in preparation for the imminent upside rocket ride!
Thanks and Cheers,
Stewart Thomson, Graceland Updates
https://www.gracelandupdates.com
Risks, Disclaimers, Legal
Stewart Thomson is no longer an investment advisor. The information provided by Stewart and Graceland Updates is for general information purposes only. Before taking any action on any investment, it is imperative that you consult with multiple properly licensed, experienced and qualified investment advisors and get numerous opinions before taking any action. Your minimum risk on any investment in the world is: 100% loss of all your money. You may be taking or preparing to take leveraged positions in investments and not know it, exposing yourself to unlimited risks. This is highly concerning if you are an investor in any derivatives products. There is an approx $700 trillion OTC Derivatives Iceberg with a tiny portion written off officially. The bottom line:
Are You Prepared?
The world’s leading gold-stock ETF is nearing a major upside breakout from key technical levels. GDX is getting closer to challenging and powering above $25. That would accelerate the sentiment shift in this deeply-undervalued sector back to bullish, enticing investors to return. Good operating results from the major gold miners in their upcoming Q4’17 earnings season could prove the catalyst to fuel this GDX $25 breakout.
The classic way to measure gold-stock-sector price action is with the HUI NYSE Arca Gold BUGS Index. But the HUI benchmark is being increasingly usurped by the GDX VanEck Vectors Gold Miners ETF as the gold-stock metric of choice. GDX is used far more often than the HUI in gold-stock analyses these days, both online and on financial television. I haven’t seen the HUI mentioned on CNBC for years now.
GDX does have major advantages over the HUI. Most importantly it is readily tradable as an ETF and with options. GDX’s component stocks and their weightings are also regularly updated by elite gold-stock analysts, keeping it current. The HUI is rarely if ever updated to reflect company-specific changes in the ranks of the world’s top gold miners. GDX is dynamic where the HUI is effectively static and outdated.
GDX also has limitations as a gold-stock metric though. It was only born in May 2006, so that’s the limit of its price history available for analysis. And because its managers are paid 0.51% of its assets each year to maintain this ETF, GDX is not as pure of measure of gold-stock performance as a normal index. Over a decade that adds up to a substantial 5% difference. Nevertheless GDX’s popularity continues to grow.
This week GDX had $7.7b in assets under management, dwarfing its direct competitors. That was 21x larger than the next-biggest 1x-long major-gold-stock ETF! GDX’s sister GDXJ Junior Gold Miners ETF weighed in at $4.7b, but that generally includes smaller gold miners. GDX is the undisputed king of the gold-stock ETFs. As a contrarian speculator, I watch GDX’s price action in real-time all day every day.
For an entire year now, GDX has meandered in a relatively-tight trading range between $21 to $25. As gold stocks periodically fell even deeper out of favor, this ETF slumped down near $21 lower support. Then as they inevitably rallied back out of those lows, GDX climbed back up near $25 resistance. That made for a roughly-20% gold-stock price range, certainly narrow by this sector’s standards and tough to trade.
This GDX chart over the past couple years or so highlights 2017’s gold-stock consolidation. With this unloved sector neither rallying nor falling enough to get interesting, investors mostly abandoned it over the past year. So gold stocks largely drifted sideways on balance, which certainly proved vexing for the few remaining contrarian speculators and investors. A GDX $25 breakout would greatly improve psychology.
Last year’s gold-stock performance per GDX was very poor. This ETF’s price climbed 11.1% in 2017, which is better than a kick in the teeth. But gold’s impressive 13.2% gain last year well outpaced the gold stocks’ performance. Normally the major gold miners’ stocks amplify gold advances by 2x to 3x, so GDX should’ve powered 26% to 40% higher in 2017. Gold stocks are only worthwhile if they outperform gold.
That’s because gold miners face many additional operational, geological, and geopolitical risks compared to just owning gold outright. So if the gold stocks don’t outperform gold, they simply aren’t worth owning. Seeing them lag the metal which drives their profits for essentially an entire year is extremely anomalous. It’s a reflection of the entire global markets proving extremely anomalous in 2017, an exceedingly-weird year.
Gold stocks normally perform much more like 2016 than 2017. A couple years ago GDX rocketed 52.5% higher in one of the best major-sector-ETF performances in all the stock markets. That greatly amplified 2016’s underlying 8.5% gold advance by 6.2x. All those gains rapidly accrued in that year’s first half, as GDX skyrocketed 151.2% higher in 6.4 months on a parallel 29.9% gold upleg! Gold stocks can really move.
But last year as extreme record-high stock markets and the even-more-extreme bitcoin popular speculative mania stole the spotlight from gold, gold stocks were largely left for dead. Speculators and investors alike wanted nothing to do with classic alternative investments when everything else proved much more exciting. Thus GDX hasn’t been able to decisively break out above its $25 upper resistance, despite trying.
GDX did power 34.6% higher in 1.8 months early last year, peaking on a closing basis at $25.57 in early February 2017. But that rally fizzled with gold’s when stock markets started surging to new records on hopes for big tax cuts soon from the newly-Republican-controlled US government. By early March GDX had retreated back down to $21.14, right at its $21 support line. At least that held strong throughout 2017.
The gold stocks soon rebounded into another rally, but that topped at $24.57 in GDX terms in mid-April. Again gold had stalled out amidst epic general-stock euphoria. Gold is the key to gold-stock fortunes, as traders only think about the gold miners when gold itself catches their attention. GDX was repelled right at its 200-day moving average, which can prove both major support or resistance depending on market direction.
By early May GDX was right back down to $21.10 again, increasingly establishing the clear consolidation trend seen in this chart. The gold stocks couldn’t rally significantly heading into their summer-doldrums lull, and GDX was soon right back down to $21.21 in early July. That very day I published an essay on gold stocks’ summer bottom, predicting a new upleg once those usual weak summer seasonals passed.
And that indeed happened, with GDX rebounding and then accelerating to power 20.2% higher to $25.49 by early September. That was right at its early-February peak, a critical level technically to see a major upside breakout. But once again gold didn’t cooperate, selling off sharply as general stock markets yet again blasted to another series of record highs on renewed hopes for big tax cuts soon. Taxphoria was huge!
Thus the gold stocks slumped again, falling back down near GDX’s strong $21 support as this ETF hit $21.42 on close in mid-December. That was the day before the Federal Reserve’s fifth rate hike of this cycle, so gold-futures speculators were scared. They irrationally fear Fed rate hikes are bearish for gold, even though history has long proven just the opposite. Gold and gold stocks surged after that hike as I predicted.
From the day before that latest FOMC meeting to this week, GDX rallied 13.8% to $24.37. Wednesday morning when I decided to pen this essay, GDX was nearing $24.50. So the long-awaited decisive $25 breakout is in easy reach. Gold stocks are a volatile sector, with 3%+ daily swings in prices relatively common. So all it will take to propel GDX above its $25 resistance is a few solid-to-strong sector up days.
The upcoming Q4’17 earnings season for the major gold miners in the next few weeks could prove the catalyst to spark serious gold-stock buying. Because gold stocks are so deeply out of favor, the small fraction of traders that even think about them assume they are struggling operationally. Throughout all the markets, traders wrongly attribute prices stretched to anomalous levels by extreme herd sentiment to fundamentals.
A month ago bitcoin skyrocketed near $20k as many traders believed such extremes were fundamentally righteous due to the underlying blockchain technology. Yet it was a popular speculative mania, extreme greed sucking people in. In early December I warned “Once this mania bitcoin bubble bursts, and it will, the odds are very high that bitcoin will lose 50% to 75% of its value within a few months on the outside!”
This week just over a month later bitcoin has indeed been cut in half, falling to $9k intraday. Extreme prices are the result of irrational and ephemeral herd sentiment, not fundamentals. Gold stocks are now stuck on the other end of the psychology spectrum, plagued with extreme fear. Since their prices have been so weak, traders think poor fundamentals must be the reason. But that’s simply not true at all.
As a contrarian speculator and market-newsletter writer for the past couple decades, few people are more deeply immersed in the gold-stock realm than me. Every quarter just after earnings season I dive into the actual operating and financial results of the major GDX gold miners. I’m eagerly looking forward to doing that again with their new Q4’17 results, which will be reported between late January and mid-February.
So now the latest quarterly results available from the major gold miners are Q3’17’s. I explored them for the top 34 GDX gold miners, representing almost 92% of its total holdings, back in mid-November. In Q3’17 these elite gold miners reported average all-in sustaining costs of $868 per ounce. That’s what it costs them not only to produce gold, but to explore for more and build new mines to maintain production levels.
Q3’17’s average gold price was $1279, which means the major gold miners were collectively earning profits around $411 per ounce. That made for hefty 32% profit margins, revealing an industry actually thriving fundamentally instead of struggling as herd-sentiment-blinded traders wrongly assume. Gold miners make such excellent investments because their mining costs generally don’t follow gold prices.
Gold-mining costs are essentially fixed during mine-planning stages, when engineers and geologists work to decide which ore to mine, how to dig to it, and how to process it. Once mines’ necessary infrastructure is built, their actual mining costs don’t change much. Quarter after quarter generally the same levels of equipment, employees, and supplies are needed to mine gold. So all-in sustaining costs hold pretty steady.
In the four quarters leading into Q3’17, the top-34 GDX gold miners’ all-in sustaining costs averaged $855, $875, $878, and $867. That works out to an annual average of $869, virtually identical to Q3’17’s $868 per ounce. Those flat AISCs happened despite the gold price varying greatly in that five-quarter span, with this metal slumping as low as $1128 and surging as high as $1365. Gold-mining costs are static.
So as long as prevailing gold prices remain well above all-in sustaining costs, mining gold remains very profitable and spins out big positive operating cashflows. And relatively-flat mining costs generate big gold-miner profits leverage to gold. These core fundamental truths about gold-mining stocks are what could help their upcoming Q4’17 results ignite the buying necessary to propel GDX above $25 for a major breakout.
These new Q4 results aren’t going to be spectacular, as gold’s $1276 average price last quarter was just under Q3’s $1279 average. But assuming flat all-in sustaining costs as usual, $868 in Q4 would still yield fat profit margins of $408 per ounce. That too is virtually unchanged from Q3’s $411. So the major gold miners as a sector shouldn’t see collective downside surprises in earnings in Q4, avoiding damaging sentiment.
It’s not the Q4’17 results that should spark major gold-stock buying, but their implications for the current Q1’18 quarter. While Q1 is young, gold is averaging nearly $1323 so far as of the middle of this week. That is already 3.6% above Q4’s average, which is a big move higher. If these gold levels hold and the major gold miners’ all-in sustaining costs hold, they are looking at Q1’18 profits way up at $455 per ounce!
That’s a whopping 11.5% higher quarter-on-quarter! Not many if any sectors in all the stock markets can even hope for such massive earnings gains. And if gold continues powering higher in the coming months in a major new upleg, Q1’s average gold price will be pulled higher accordingly. That means even larger major-gold-miner profits growth. These super-bullish prospects ought to rekindle material gold-stock demand.
Investors usually buy stocks not because of current earnings, but because of what they expect profits to do over the coming year or so. Rising gold prices coupled with flat costs give gold-mining profits growth in 2018 some of the greatest upside potential in the entire stock markets. Institutional investors should take notice of this as Q4’17 results are released, leading to funds upping their tiny allocations to gold stocks.
On top of that January tends to be a big news month for the gold miners, as many publish their cost and production outlooks for the new year. These reports tend to be bullish on balance, with the major gold miners forecasting higher production and lower costs tending to garner the most attention. So there’s good odds of positive newsflow over the coming weeks as well, drawing investors’ focus back to gold stocks.
All this shows why the gold miners’ stocks have usually enjoyed strong seasonal rallies in January and most of February. So GDX now has its best chance in a year of decisively breaking out above $25 in the coming weeks. That would work wonders for bearish gold-stock psychology. The more gold stocks rally, the better herd sentiment, and the more traders want to buy them. And GDX’s potential upside is huge.
This last chart encompasses nearly all of GDX’s entire history going back to early 2007, a half-year after it was birthed. Gold stocks remain wildly undervalued today, so GDX $25 and even its $31.32 seen at gold stocks’ latest major interim high in early August 2016 are super-low in longer-term context. GDX is actually still down near stock-panic levels, highlighting vast upside as gold stocks inevitably mean revert higher.
The shaded area in the lower right encompasses the last couple years. Despite GDX seeing one heck of a bull-spawning upleg in early 2016, the gold stocks remain very low. GDX itself actually hit an all-time low in January 2016. The gold stocks were trading at fundamentally-absurd prices as I pointed out that very week. That extreme anomaly was the product of fleeting herd sentiment, it had nothing to do with fundamentals.
So far in young 2018, GDX is averaging $23.66 on close. That’s actually worse than Q4’08’s $25.13, which was during the most-extreme market-fear event of our lifetimes. For the first time since 1907, the general stock markets suffered a full-blown panic in late 2008. Everything else including gold and its miners’ stocks were sucked into that epic maelstrom of fear. Traders were terrified, fleeing in horror from everything.
So GDX plummeted as low as $16.37 in late-October 2008, climaxing a devastating 71.0% drop in just 7.5 months. In that panic quarter of Q4’08, gold averaged just $797. While industry costs were lower then, the major gold miners were still earning much less in both profit-margin and absolute terms than they are today. Yet the average GDX share price was much higher in Q4’08 than it’s been over the past year!
The fact GDX could trade around $25.13 during a stock-panic quarter with $797 gold highlights the sheer madness of today’s gold-stock prices. Since 2017 dawned, GDX has averaged just $22.99 with $1261 average gold levels. Seeing gold-stock prices 8.5% lower despite strong profits and average gold prices being a whopping 58.2% higher makes zero sense! The gold stocks have to mean revert far higher from here.
That’s what happened after the extreme pricing anomalies of that late-2008 stock panic too. Over the next 2.9 years, GDX more than quadrupled with a 307.0% gain! Another proportional mean-reversion bull out of early 2016’s all-time GDX low would catapult this ETF back up near $51. That’s still more than another double from today’s levels. And with gold mining so profitable, this new bull’s gains should be far larger.
While investors and speculators alike can certainly play gold stocks’ powerful coming upleg with major ETFs like GDX, the best gains by far will be won in individual gold stocks with superior fundamentals. Their upside will far exceed the ETFs, which are burdened by over-diversification and underperforming gold stocks. A carefully-handpicked portfolio of elite gold and silver miners will generate much-greater wealth creation.
At Zeal we’ve literally spent tens of thousands of hours researching individual gold stocks and markets, so we can better decide what to trade and when. As of the end of Q4, this has resulted in 983 stock trades recommended in real-time to our newsletter subscribers since 2001. Fighting the crowd to buy low and sell high is very profitable, as all these trades averaged stellar annualized realized gains of +20.2%!
The key to this success is staying informed and being contrarian. That means buying low before others figure it out, before undervalued gold stocks soar much higher. An easy way to keep abreast is through our acclaimed weekly and monthly newsletters. They draw on my vast experience, knowledge, wisdom, and ongoing research to explain what’s going on in the markets, why, and how to trade them with specific stocks. For only $12 per issue, you can learn to think, trade, and thrive like contrarians. Subscribe today, and get deployed in the great gold and silver stocks in our full trading books!
The bottom line is the leading GDX gold-stock ETF looks to be on the verge of a major breakout. The upcoming Q4’17 results from the major gold miners along with Q1’s higher prevailing gold prices ought to catch investors’ attention. The gold miners should prove very profitable in Q4, with prospects for big and fast earnings growth in Q1 and all of 2018 as gold powers higher. This should help GDX get bid well over $25.
Once gold stocks power decisively above that vexing upper resistance level of the past year, the shift in trader psychology back to bullish will really accelerate. Gold stocks should enjoy relatively-large capital inflows from institutional investors looking for undervalued sectors in an extremely-overvalued stock market. The forgotten gold miners’ stocks have a good chance to outperform everything again this year like in 2016.
Adam Hamilton, CPA
January 19, 2018
Copyright 2000 – 2018 Zeal LLC (www.ZealLLC.com)
If you would like to receive our free newsletter via email, simply enter your email address below & click subscribe.
 Follow us on Twitter
 Become our facebook fan
CONNECT WITH US
Tweets
Tweet with hash tag #miningfeeds or @miningfeeds and your tweets will be displayed across this site.
MOST ACTIVE MINING STOCKS
Daily Gainers
 CMC Metals Ltd. CMC Metals Ltd. |
CMB.V | +900.00% |
 Eden Energy Ltd Eden Energy Ltd |
EDE.AX | +200.00% |
| GoviEx Uranium Inc. |
GXU.V | +42.86% |
| Eagle Nickel Ltd. |
ENL.AX | +41.67% |
| Citigold Corp. Limited |
CTO.AX | +33.33% |
| Mount Burgess Mining NL |
MTB.AX | +33.33% |
| Exalt Resources Limited |
ERD.AX | +31.94% |
| Casa Minerals Inc. |
CASA.V | +30.00% |
| Cariboo Rose Resources Ltd |
CRB.V | +28.57% |
| Belmont Resources Inc. |
BEA.V | +28.57% |


