
First Vanadium Corp. (TSX-V: FVAN) / (OTCQX: FVANF) has been under pressure, along with hundreds of battery metal juniors and the underlying metals including vanadium, cobalt, lithium. Even vanadium giant Largo Resources is down 61% from its 52-week high. Yet, if one believes in vanadium, it’s hard to ignore First Vanadium’s shares at C$0.44, down 78%! The pro forma Enterprise Value [market cap + debt – cash] is just US$12.8M. The Company has C$1.9M in cash.
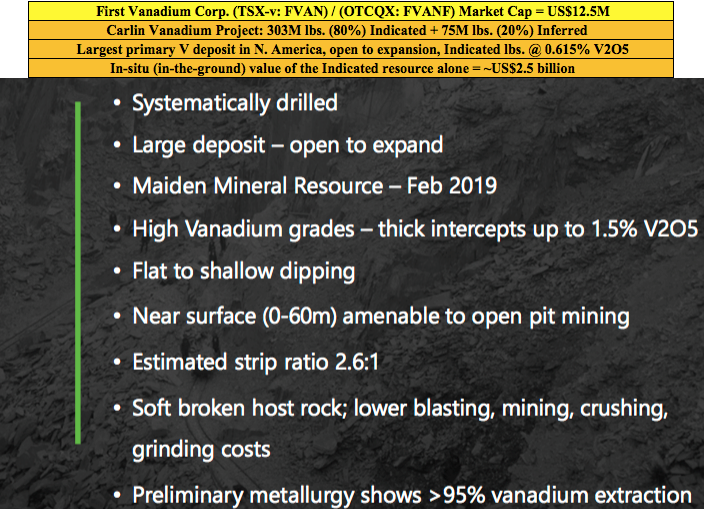
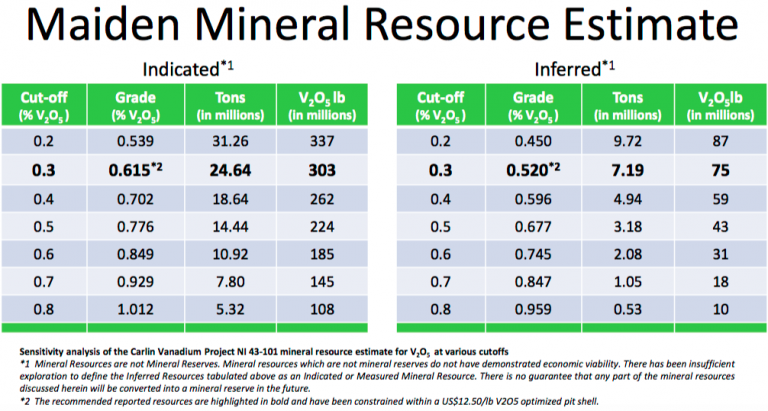
Yet, even at current vanadium pentoxide (“V2O5“) prices, the in-situ value of the Indicated-only portion (303 million pounds) of the Company’s estimated resource is ~US$2.5 billion. Management believes it has the largest high-grade primary vanadium resource in North America.
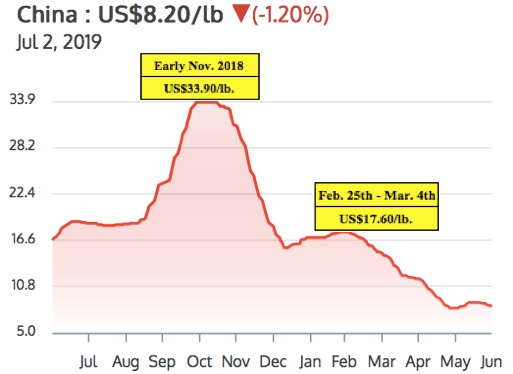
There has been a lot of weeping and gnashing of teeth over the V2O5 (China) price falling from a 2019 high of US$17.6 to its current US$8.2 per pound. But, as the saying goes, the cure to low prices is…. low prices. Few new projects make sense at today’s levels. I believe that V2O5 (China) between US$10-US$15 per pound might be a sweet spot, good for both producers and end users.
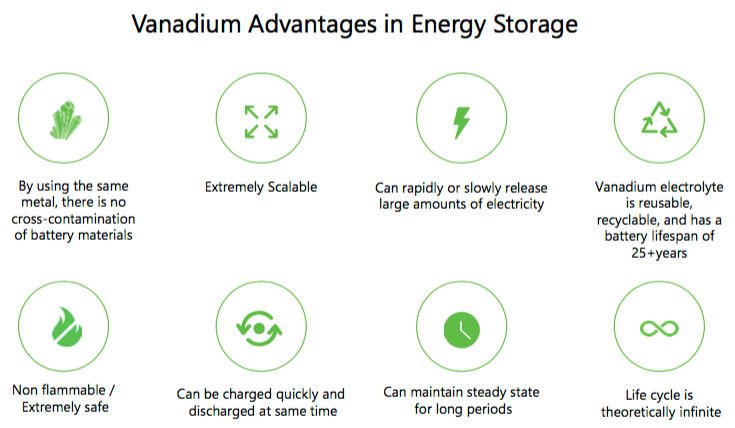
Steel companies can afford to pay higher prices for V2O5, but grid-scale, Vanadium Redox Flow Battery (“VRBs“) Energy Storage Systems (outside of China) might need prices below US$10/lb. to go mainstream. Importantly though, VRB plant costs are coming down. Vincent Sprenkle, a lead researcher at the U.S. Department of Energy’s Pacific Northwest National Laboratory, (“PNNL“) recently said, “VRB costs could be lowered by another 50%.” That would be very bullish for vanadium prices, it would allow for widespread adoption of VRBs even with V2O5 prices above US$10/lb.
First Vanadium has a sizable resource, a good grade, in a great jurisdiction. A Preliminary Economic Assessment (“PEA”) is expected by year end. The following interview of Paul Cowley, P.Geo., President, CEO & Director of First Vanadium, was conducted by phone & email between June 24th & July 2nd.
Please tell us about yourself and your team.
I’m an exploration geologist with 40 years’ experience in the discovery & evaluation of mineral deposits around the world. About half of my career was with a Major, BHP Minerals. I was involved in leading the team in the Canadian arctic that made 4 gold deposit discoveries that generated about 6 million ounces of gold. I also worked at Escondida and BHP’s Ekati diamond mine during their exploration days.
I’m a senior guy, but I’m the youngest of our group. The others have even more years of experience. We have two mining engineers that held mine general manager positions of very significant mines at Majors. We have four metallurgists that have worked for Majors, in senior roles. We have a construction engineer who’s built 20 mines in North & South America, he’s currently building Lundin’s mine in Ecuador.
What do you make of the recent volatility in the vanadium price?
Since early March 2019 the vanadium price has taken an unexpected turn lower. Prices are not responding to the bigger picture demand and supply imbalance. Chinese steel plants did not recharge their vanadium inventories in this period, as many expected they would, putting pressure on traders to liquidate at undercutting prices, but they will have to restock. The U.S.-China trade wars, and some shortfall of enforcement of new Chinese rebar standards, appear to have exacerbated the situation in the short term.
It’s our view that the fundamentals of demand in global steel applications will outstrip supply and should push vanadium prices higher again in the second half of the year, and beyond. Adding to the demand side is the exciting boom in solar & wind projects, all of which require battery storage. This is happening on so many levels around the world that we expect to see the vanadium battery carve out a healthy market share in this expanding renewable space. Some are calling the 2020’s, the Solar Decade.
Please explain the significance of the historical data you recently received, that extended the strike length by 300 meters to the south.
It means more potential than we had expected. From our drilling, the deposit appears to be open to expansion in several areas, but we did not expect the deposit to be open to the south. The newly acquired data demonstrates a 15% strike length increase to the south and it’s still open in that direction. This is exciting news as this data was not included in the resource estimate we put out in February.
You already have a 303 million pound vanadium resource (in-situ value of ~US$2.5 billion) in the Indicated category alone. Does the resource need to get any bigger?
That’s a good question. But it needs to be answered through an economic study. In our view, the resource is sizable. It’s currently the largest, highest-grade primary vanadium resource in North America. Our immediate priority is to demonstrate potential economic viability with what we have, knowing that we believe we could always make it bigger if and when we need to.
Several readers may assume that First Vanadium will need an expensive roaster in its operating flow sheet. What are your latest thoughts?
Not true. The path we are on with our metallurgical flow sheet does not include, or require, a roaster.
Although Nevada is the #1 global mining jurisdiction in the latest Fraser Institute Mining Survey, some complain that it takes a long time to get permits. What does your team expect in this regard?
In general, in the U.S. that is true, but not in Nevada. Nevada has a responsible review and process, but it’s a mining state. And, even more so for us now that vanadium is on the critical minerals list. The U.S. has unveiled its strategy in an effort to rebuild struggling domestic supply chains for metals & minerals it deems “critical” to the country’s manufacturing & defense sectors. Recently this was reiterated when President Trump & Prime Minister Trudeau announced a plan for the U.S. & Canada to collaborate on critical minerals.
What are the latest developments on the metallurgical front?
We continue to make strides on the metallurgical front. In April we announced an average of 95% vanadium extraction from the rock across the deposit, into solution. We do not know what ultimate recoveries will look like just yet, but we are making good progress. And, we’re making strides in the area of pre-concentration, with the aim to reduce the plant size, which would lower the capital intensity of the project.
What are First Vanadium’s plans for a Preliminary Economic Assessment (“PEA”)? Might that be a 1H 2020 event?
No, we think that we can move faster, our aim is to initiate a PEA in the 3rd quarter, with results to be reported before the end of the year.
Why should readers consider buying shares of First Vanadium?
I see very good value and upside; an exceptional senior technical team, a good share structure and a great project. We now have C$1.9 million in cash with the recent private placement closing, and 42.4 million shares. Our share price now is where it was at the beginning of 2018! Yet, we have delivered two successful drill campaigns, a mineral resource with considerably higher grades, and more metal in the ground than our historical resource, and 80% (303 million pounds) of it is in the Indicated category.
That, plus positive metallurgical test work and environmental baseline studies to advance permitting. If one is bullish on the vanadium price, currently at US$8.20/lb., then First Vanadium’s (TSX-V: FVAN) / (OTCQX: FVANF) project in the #1 of 84 ranked global jurisdiction of Nevada should be high on the list of projects to consider investing in.
Thank you Paul, very interesting and timely commentary on the vanadium market and on First Vanadium. I look forward to seeing a PEA later this year!
Peter Epstein
Epstein Research
July 9, 2019
Disclosures: The content of this interview is for information only. Readers fully understand and agree that nothing contained herein, written by Peter Epstein of Epstein Research [ER], (together, [ER]) about First Vanadium Corp., including, but not limited to, commentary, opinions, views, assumptions, reported facts, calculations, etc. is not to be considered implicit or explicit investment advice. Nothing contained herein is a recommendation or solicitation to buy or sell any security. [ER] is not responsible under any circumstances for investment actions taken by the reader. [ER] has never been, and is not currently, a registered or licensed financial advisor or broker/dealer, investment advisor, stockbroker, trader, money manager, compliance or legal officer, and does not perform market making activities. [ER] is not directly employed by any company, group, organization, party or person. The shares of First Vanadium Corp. are highly speculative, not suitable for all investors. Readers understand and agree that investments in small cap stocks can result in a 100% loss of invested funds. It is assumed and agreed upon by readers that they will consult with their own licensed or registered financial advisors before making any investment decisions.
At the time this article was posted, Peter Epstein owned no shares of First Vanadium Corp. and the Company was an advertiser on [ER].
Readers understand and agree that they must conduct their own due diligence above and beyond reading this article. While the author believes he’s diligent in screening out companies that, for any reasons, are unattractive investment opportunities, he cannot guarantee that his efforts will (or have been) successful. [ER] is not responsible for any perceived, or actual, errors including, but not limited to, commentary, opinions, views, assumptions, reported facts, financial calculations, etc., or for the completeness of this interview or future content. [ER] is not expected or required to subsequently follow or cover events & news, or write about any particular company. [ER] is not an expert in any company, industry sector or investment topic.
I continue to receive questions regarding the direction of the market, to which I can only reply “I don’t know.” I certainly have thoughts about the factors affecting metals markets, but am not under the illusion that I KNOW where the market is headed.
What I do know is that my money is best invested, in tranches, in the best companies in the sector. The best companies are led by the best management teams and, besides the pure exploration companies, are the owners of the highest quality projects.
By high quality, I’m referring to their economics. The best projects have robust economics at today’s metal prices.
It’s my opinion that when market sentiment does eventually change, the bull portion of the next cycle will be HUGE. Along with the supply shortages that I see in the fundamentals of most of the metals, the demand side of the equation looks particularly strong as, globally, the world begins to push toward electrification.
With the short-term direction of the market hard to gauge, one avenue for investors who want to give themselves the potential to profit in the relative immediate future, is to look at exploration companies with a program happening now or in the near future.
Like development companies, the best exploration companies are headed by the best management teams, who have chosen their exploration projects by a set of criteria which gives them the best possible chance at success.
I highly encourage investors to meet, or at the very least call, the people who are running the companies with which they are going to place their money. One of the questions that I think needs to be asked is how the company came to the conclusion that the project they are going to be exploring gives them the best chance at finding a mineral deposit of value.
A company which has been one of my favourites for some time now is Adventus Zinc Corporation (ADZN:TSXV). They are developing their Curipamba project in Ecuador. While I’m looking forward to an updated PEA on Curipamba in the new year, it’s Adventus’ exploration potential with their Pijili and Santiago projects that has my full attention – and excitement – at the moment.
Let’s take a look!
Determining Potential Value in Exploration
Determining the upside potential or value of an exploration company isn’t easy, as much of the criteria is subjective in nature. Here are, in my opinion, a few of the most important points to ponder when it comes to evaluating investment in an exploration company:
#1 – Quality of the Management Team – Take a good look at the management team and any advisors or consultants associated with the company. Past success is a very good indicator of future potential. A good CEO should be able to clearly define the details, mainly the why and how of their upcoming exploration program.
#2 – Jurisdiction –Typically, the regions with the highest potential for uncovering a high value mineral deposit are those which have the most associated risk. It’s imperative to do your due diligence and understand where you are putting your money. Know your risk tolerance – buyer beware.
#3 – A Project’s Historical Work – Answer the following questions:
- In what stage of exploration is the project?
- Has surface work been completed? Grab samples, soil samples, geophysics?
- Is the project drill ready? How were the targets chosen?
- Historical work on the project?
- Has the project already been explored by multiple companies?
- If yes, what were their results? Why should you expect anything different?
NOTE: If a company is looking at exploring or developing a project that has already had a lot of work or exploration completed on it, the company needs to clearly outline how their exploration approach is different from the previous operators, and why it has a chance to be successful.
#4 – Cash – Cash is especially important in the current market. Does the company have enough money to execute on the exploration program that they have planned?
#5 – If unsuccessful, will I be able to sell? – This is an important question to answer and is partially overlapped with the previous point regarding cash. For me, I want to speculate in a company that will have cash remaining after their exploration program is complete in both positive and negative scenarios. An even better situation is to speculate in a company that will have cash remaining and an additional project(s) further down the development path, to which the market can assign value. In my opinion, you don’t want to be invested in a company that doesn’t have any money at this point in the market cycle, let alone own one with a recent unsuccessful exploration program.
Adventus’ Exploration Potential
Let’s use the criteria I just outlined to look at Adventus.
#1 – Quality of the Management Team – In my opinion, the Adventus team is as good as they come in the junior resource sector. The company is led by CEO, Christian Kargl-Simard, who has over 14 years of experience in both technical and finance roles in the mining industry. Additionally, and core to the team, is VP Corporate Development, Sam Leung. Leung has over 10 years of experience in the mining industry, having worked for Lundin Mining Corporation prior to joining Adventus. Finally, and key to Adventus’ exploration efforts in Ecuador, is VP Exploration Jason Dunning. Dunning has over 20 years experience in the mining industry and has worked in a similar role for Alamos Gold Inc., Selwyn Resources Ltd. and Yukon Zinc Corporation.
In addition to the main team, a major strength of the company, in my opinion, is in their association and close connection with Altius Minerals. For those who are unaware, Altius is both a diversified mining royalty company and mineral exploration project generator. Altius is headed by CEO, Brian Dalton, who is also Chairman of Adventus’ Board of Directors.
Also, Dr. Lawrence Winter, Altius’ VP Exploration, is an advisor to Adventus and, in my experience, has a top notch reputation throughout the resource sector.
People are key to the success of any company and, in the case of Adventus, I’m confident that this team will make 2019 a pivotal year in the company’s development.
#2 – Jurisdiction – Adventus’ project exploration and development focus is in Ecuador. For those who are unaware, Ecuador has a rocky past when it comes to mining investment. In my opinion, however, it’s changing in a direction that is attractive to mining investment and is a place where I have invested my cash. Earlier this year, I wrote an article regarding Ecuador’s mining investment attractiveness; for those considering investment in Ecuador, I believe it’s a must-read.
#3 – Historical Work
Adventus is in, what I consider to be, a highly advantageous position when it comes to exploration and development in Ecuador; they are partnered with Salazar Resources, a junior resource company led by a senior Ecuadorian management team.
The Curipamba project was the first deal on which the two companies partnered, giving Adventus the opportunity to earn-in on 75% of the project, given development and payment requirements over a 5-year period.
Since this initial deal, Adventus and Salazar have expanded their relationship into an Ecuador-wide exploration Alliance. The Alliance ownership is 80% Adventus and 20% Salazar, and allows the Alliance Board, which is made up of Sam Leung and Jason Dunning of Adventus, and Fredy Salazar, to pick and choose what they feel are the highest potential projects, and bring them into the Alliance for exploration and development.
Pijili Project
The first project to be brought into the Alliance is the Pijili project, which was granted to Salazar by the Republic of Ecuador.
The Pijili project consists of 3 concessions totalling 3,246 hectares, and is located in the Ecuadorian province of Azuay. Its potential has been revealed only through the legally permitted artisanal mining which is currently taking place – exploration through modern techniques has yet to take place.
Artisanal miners are mining precious metals bearing structures via several small open pits and underground tunnels. Also, Salazar notes that there is visible evidence of copper mineralization along the walls of the small open pits.
In their most recent news release, Adventus announced the commencement of an airborne MobileMT geological survey of the Pijili and Santiago projects. As VP of Exploration, Jason Dunning, cites in the news release,
“MobileMT will greatly enhance drill hole targeting by defining high-priority targets for follow-up in early 2019. This is the first time there will be a deep penetrating, uniform dataset for Pijilí and Santiago projects that will allow us to more accurately visualize the geological and structural framework in 3D to define potentially prospective host rocks for intrusion-related mineralization.”
Pijili presents a blank slate for exploration, one that I believe holds a ton of mineral potential.
Santiago Project
The second project brought into the Alliance is the Santiago project, which is roughly 110 km west of Lundin’s Forte del Norte gold deposit. Santiago consists of a single concession, which covers an area of 2,350 hectares.
Unlike Pijili, Santiago has seen the use of modern exploration techniques, which has exposed a series of vein occurrences. The occurrences have yielded good reconnaissance chip sampling results. Here are a few highlights, which can be found on Salazar’s website and SEDAR.
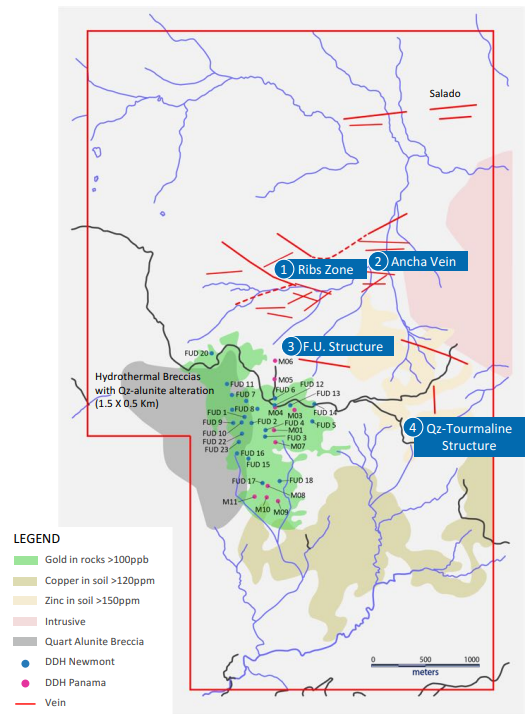
Espanola Vein
2.0 m @ 28.1g/t Au and 231 g/t Ag
1.0 m @ 26.0 g/t Au and 242 g/t Ag
Quartz-Tourmaline Vein
1.9 m @1.19 g/t Au, 14.3 g/t Ag and 296 ppm Mo
3.3 m @ 0.59g/t Au, 36.6 g/t Ag and 390 ppm Mo
Ribs Zone and Ancha Vein
1 m @ 1.29 g/t Au and > 100 g/t Ag
1 m @1.65 g/t Au and > 100 g/t Ag
F.U. Structure
1.40 m @ 4.8 g/t Au and 378 g/t Ag
1.20 m @ 6.4 g/t Au and 136 g/t Ag
In addition to the chip samples, Santiago has seen historical drilling on the project by a previous operator, Newmont Mining Corporation.
The historical results are very intriguing as they exhibit characteristics of a Cu-Au porphyry system. I must, however, caution anyone from drawing any conclusions from these results as they are not confirmable – the drill core is unavailable.
Here are a few of the highlights, which can be found on SEDAR:
Hole FU 01 – Interval 0 to 323 m, 0.37 g/t Au, 0.23% Cu – 0.47% CuEq
Hole FU 02 – Interval 129 to 300 m, 0.5 g/t Au, 0.33% Cu – 0.66% CuEq
Hole FU 08 – Interval 0 to 300 m, 0.24 g/t Au, 0.11% Cu – 0.27% CuEq
As mentioned earlier, Adventus has announced an airborne MobileMT geological survey of Santiago, which will assist the exploration team in identifying the highest potential drill targets.
Personally, I will be watching for news from the airborne work and the targets that Adventus decides to pursue. In my opinion, there’s a lot of potential here.
#4 – Cash – In Adventus’ current corporate presentation, the company lists their cash position as $10 million, as of October 30th 2018. Given the current market dynamics, this is a great position to be in. Additionally, I might add, Adventus has enjoyed the uncanny ability to raise money through this bear market portion of the resource cycle, which I expect will continue in the future.
#5 – Downside Risk – Currently, as an investor of Adventus, I believe the biggest risk to my capital comes from the jurisdiction – Ecuador, for reasons I outlined in my article. While there’s risk of failure in exploration at Pijili and Santiago, I don’t see the stock price taking a big hit for failure. Given the MCAP and the value I assign to Adventus’ assets, I see little to no value assigned to exploration upside at Pijili or Santiago.
Furthermore, given Adventus’ cash position, their access to funds and the assets they hold under management, I believe the risk to reward potential presented by the exploration is fantastic.
Conclusion
The end of the year is upon us and with it typically comes a great opportunity to buy the best junior resource companies at a discount. While no one can predict the direction of a market with any consistency, buying the highest quality companies, with catalysts for share price appreciation, puts us, in my opinion, in the best possible position to profit.
To me, Adventus is one of those high quality companies that give the investor multiple avenues for success. First, you have their flagship Curipamba project, which should have an updated PEA early in the new year. Second, you have their high potential exploration projects, Pijili and Santiago, whose upside potential, in my opinion, hasn’t been factored into Adventus’ MCAP as of yet. Third, you have Adventus’ portfolio of Irish projects, for which they are actively looking to find a JV partner. Finally, you have Adventus’ large stake in Canstar Resources, who will be beginning their inaugural exploration program on their Newfoundland based projects next year.
I’m looking forward to 2019!
Don’t want to miss a new investment idea, interview or financial product review? Become a Junior Stock Review VIP now – it’s FREE!
Until next time,
Brian Leni P.Eng
Founder – Junior Stock Review
Disclaimer: The following is not an investment recommendation, it is an investment idea. I am not a certified investment professional, nor do I know you and your individual investment needs. Please perform your own due diligence to decide whether this is a company and sector that is best suited for your personal investment criteria. I do own shares in Adventus Zinc Corporation. All Adventus Zinc Corporation analytics were taken from their website and press release. I have NO business relationship with Adventus Zinc Corporation.
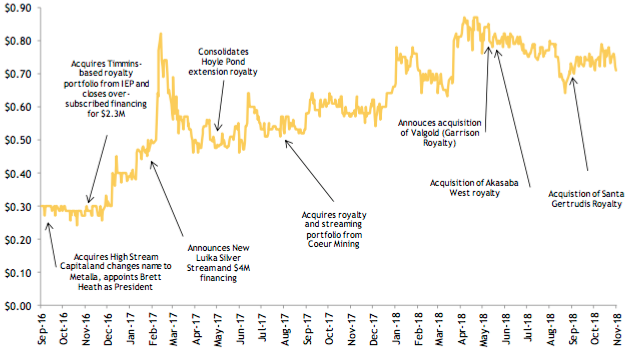
The following interview of Brett Heath, CEO of Metalla Royalty & Streaming, took place by phone & email over the past 10 days. Brett and his expert team have achieved quite a lot over the past year. In this interview I asked Brett for an update as I am especially interested in Metalla’s latest transaction, (a 2% NSR) on the Santa Gertrudis Royalty.
Please describe the importance of your most recent acquisition, the Santa Gertrudis Royalty (a 2% NSR).
The Santa Gertrudis royalty has the potential to be a Company maker for Metalla. The expansive 42,000-hectare property in Sonora Mexico hosts Carlin-type deposits, similar in nature to what has created some of the largest hydrothermal gold deposits in the world. This, combined with a world-class major gold producer in Agnico Eagle as the operator, that has invested upwards of $100 million into the asset shows the confidence and potential of further upside surprises like the new high-grade discovery of the Centauro Zone. With an overall strike length of 18 km on the Santa Gertrudis property that has already been identified, Metalla is positioned to benefit from additional exploration success from the balance of Agnico’s 2018 drilling campaign and beyond.
Can we get an update on your 2 or 3 most important assets?
The Endeavor mine, operated by CBH Resources where we have a silver stream that contributes the most significant portion of Metalla’s cash flow continues to show signs of further exploration success of the Deep Zinc Lode discovery that was made earlier this year. We hope to have an update in 2019 that outlines a mine plan extension past December 2020.
Also, we are expecting a resource update in January 2019 from Osisko Mining on the Garrison gold property where Metalla has a 2% NSR royalty. Osisko has drilled an additional 90,000 m since the latest PEA (the PEA has just under 2 million ounces of gold resources). We are expecting a significant improvement in total ounces, but also an improvement in the categories of Measured & Indicated.
Finally, the Joaquin project which is being developed by Pan American Silver, where Metalla owns a 2% NSR continues to show progress. Pan American has stated that they now expect production in Q1 of 2020.
The Santa Gertrudis deal puts your market cap above C$80 M. At what stage might a mid-tier precious metals Royalty & Streaming company like Sandstorm Gold (~C$1 billion market cap), or Maverix Metals (~C$515 M market cap) show interest in acquiring Metalla?
The bigger royalty companies historically look to take over smaller royalty companies when gold & silver enter into a bull market. This is because mining company equity often becomes over-valued, making it is less costly to acquire a company like Metalla outright rather than take on a royalty or stream. Bigger royalty companies that trade at much higher valuations can provide big premiums to smaller royalty companies while still being accretive.
One of the biggest problems the big royalty companies have in a bull market in precious metals is growth. That’s because providing project capital to mining companies usually gives them a 2-3 year window for those projects to come online. They are forced to look at buying companies like Metalla or price royalties or streams at a much higher cost. Historically that hasn’t worked out so well.
A crucial part of our portfolio is royalties on development projects with major mining companies. We think these assets will command a large premium in the future, potentially even more than our royalties that are already producing.
Silver & Gold prices (in USD) have been weak this year, down 16% & 6%, respectively, how much is that likely to impact your FY 2019 earnings (for the year ending May 2019)?
We take metal price risk along with the mining companies, specifically on silver where 100% of our cash flow comes from currently. What is important to remember is that royalty & streaming contracts offer guaranteed margins. So where a mining company may be break even or losing money at a slightly lower gold or silver price, Metalla will always have cash flow as long as the asset is in production. More importantly, when precious metals prices rise, there is a tremendous amount of leverage built in that translates directly to the shareholders of Metalla.
On the other hand, lower precious metals prices might enable Metalla to strike better deal terms, do you see more attractive transaction opportunities?
We are looking to lock up as much gold and silver in royalty & streaming contracts as we can at current prices. These are the times when incredible deals can be struck, and, as an investor of Metalla, we pay you to wait through our monthly dividend program.
What can you tell readers about new deals that you’re actively working on, deals that could be announced within the next 6 months?
I can tell readers that the hardest part of building a royalty company is getting to a place of critical mass. I believe we have achieved this in the first two years at Metalla and I think it will be easier to scale this company from C$80M to C$500M than it was to go from C$0 – C$80M. Now is the time to position for the next cycle before the institutions take notice of what we have built.
Your current annualized distribution yield is 2.25% (based on C$0.80 stock price), the highest of any precious metals-focused Royalty/Streamer I know of. As the company grows, what are the implications for monthly distributions over the next 6-12 months?
We hope to bring on some royalties that are currently producing over the next 6 months. If we do, the development pipeline could allow us to enhance our dividend program. We have stated a 50% dividend payout goal, but we are prudently working our way towards that goal.
In terms of company valuation, how does Metalla compare to peers? What metrics do you use in your comparisons?
We still trade at a steep discount to peers based on a Net Asset Value (NAV) perspective. As we grow Metalla to C$100M+ in market cap, we expect investment banks to pick up research coverage of us showing the deep value Metalla has to offer. This could be a big potential catalyst for shareholders over the coming year.
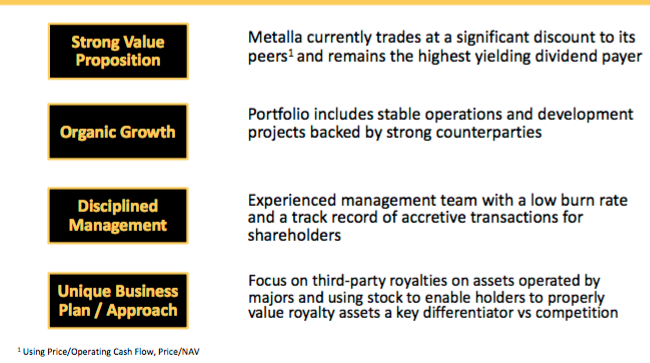
Why should readers consider buying shares of Metalla Royalty & Streaming Ltd. instead of other precious metals companies?
We have a strategy, focusing on the pre-existing royalty market that has allowed up to excel in what is a very competitive industry. As a first mover, this should continue to translate into outperformance among our peers.
Thank you again Brett for your time and thoughtful responses to my questions.
Disclosures: The content of this interview is for illustrative and information purposes only. Readers fully understand and agree that nothing contained herein, written by Peter Epstein of Epstein Research, [ER] including but not limited to, commentary, opinions, views, assumptions, reported facts, estimates, calculations, etc. is to be considered implicit or explicit, investment advice. Further, nothing contained herein is a recommendation or solicitation to buy or sell any security. Mr. Epstein and [ER] are not responsible for investment actions taken by the reader. Mr. Epstein and [ER] have never been, and are not currently, a registered or licensed financial advisor or broker/dealer, investment advisor, stockbroker, trader, money manager, compliance or legal officer, and they do not perform market making activities. Mr. Epstein and [ER] are not directly employed by any company, group, organization, party or person. Shares of Metalla Royalty & Streaming are speculative, not suitable for all investors. Readers understand and agree that investments in small cap stocks can result in a 100% loss of invested funds. It is assumed and agreed upon by readers that they consult with their own licensed or registered financial advisors before making investment decisions.
At the time this article was posted, Peter Epstein owned shares in Metalla Royalty & Streaming, and the Company was an advertiser on [ER]. By virtue of ownership of the Company’s shares and it being an advertiser on [ER], Peter Epstein is biased in his views on the Company. Readers understand and agree that they must conduct their own research, above and beyond reading this article. While the author believes he’s diligent in screening out companies that are unattractive investment opportunities, he cannot guarantee that his efforts will (or have been) successful. Mr. Epstein & [ER] are not responsible for any perceived, or actual, errors including, but not limited to, commentary, opinions, views, assumptions, reported facts & financial calculations, or for the completeness of this article. Mr. Epstein & [ER] are not expected or required to subsequently follow or cover events & news, or write about any particular company or topic. Mr. Epstein and [ER] are not experts in any company, industry sector or investment topic.
The major silver miners’ stocks have been largely abandoned this year, spiraling to brutal multi-year lows. Such miserable technicals have exacerbated the extreme bearishness plaguing this tiny contrarian sector. While profitable silver mining is challenging at today’s exceedingly-low silver prices, these miners are chugging along. Their recently-reported Q3’18 results show their earnings are ready to soar as silver recovers.
Four times a year publicly-traded companies release treasure troves of valuable information in the form of quarterly reports. Companies trading in the States are required to file 10-Qs with the US Securities and Exchange Commission by 40 calendar days after quarter-ends. Canadian companies have similar requirements at 45 days. In other countries with half-year reporting, many companies still partially report quarterly.
Unfortunately the universe of major silver miners to analyze and invest in is pretty small. Silver mining is a tough business both geologically and economically. Primary silver deposits, those with enough silver to generate over half their revenues when mined, are quite rare. Most of the world’s silver ore formed alongside base metals or gold. Their value usually well outweighs silver’s, relegating it to byproduct status.
The Silver Institute has long been the authority on world silver supply-and-demand trends. It published its latest annual World Silver Survey covering 2017 in mid-April. Last year only 28% of the silver mined around the globe came from primary silver mines! 36% came from primary lead/zinc mines, 23% copper, and 12% gold. That’s nothing new, the silver miners have long produced less than a third of world mined supply.
It’s very challenging to find and develop the scarce silver-heavy deposits supporting primary silver mines. And it’s even harder forging them into primary-silver-mining businesses. Since silver isn’t very valuable, most silver miners need multiple mines in order to generate sufficient cash flows. Traditional major silver miners are increasingly diversifying into gold production at silver’s expense, chasing its superior economics.
So there aren’t many major silver miners left out there, and their purity is shrinking. The definitive list of these companies to analyze comes from the most-popular silver-stock investment vehicle, the SIL Global X Silver Miners ETF. In mid-November at the end of Q3’s earnings season, SIL’s net assets were running 6.6x greater than its next-largest competitor’s. So SIL continues to dominate this tiny niche contrarian sector.
While SIL has its flaws, it’s the closest thing we have to a silver-stock index. As ETF investing continues to eclipse individual-stock picking, SIL inclusion is very important for silver miners. It grants them better access to the vast pools of stock-market capital. Differential SIL-share buying by investors requires this ETF’s managers to buy more shares in its underlying component companies, bidding their stock prices higher.
In mid-November as the silver miners were finishing reporting their Q3’18 results, SIL included 23 “Silver Miners”. Unfortunately the great majority aren’t primary silver miners, most generate well under half their revenues from silver. That’s not necessarily an indictment against SIL’s stock picking, but a reflection of the state of this industry. There aren’t enough significant primary silver miners left to fully flesh out an ETF.
This disappointing reality makes SIL somewhat problematic. The only reason investors would buy SIL is they want silver-stock exposure. But if SIL’s underlying component companies generate just over a third of their sales from silver mining, they aren’t going to be very responsive to silver price moves. And most of that ETF capital intended to go into primary silver miners is instead diverted into byproduct silver miners.
So silver-mining ETFs sucking in capital investors thought they were allocating to real primary silver miners effectively starves them. Their stock prices aren’t bid high enough to attract in more investors, so they can’t issue sufficient new shares to finance big silver-mining expansions. This is exacerbating the silver-as-a-byproduct trend. Only sustained much-higher silver prices for years to come could reverse this.
Silver miners’ woes are really exacerbated by silver’s worst performance in decades. In mid-November silver sunk to a 2.8-year low of $13.99. That naturally dragged down SIL to a similar 2.7-year low. But relative to gold which usually drives it, silver was faring far worse. The Silver/Gold Ratio sunk to 85.9x in mid-November, meaning it took almost 86 ounces of silver to equal the value of a single ounce of gold.
The SGR hadn’t been lower, or silver hadn’t been more undervalued relative to gold, since all the way back in March 1995! That’s pretty much forever from a markets perspective. With silver languishing at an exceedingly-extreme 23.7-year low relative to gold, it’s hard to imagine it doing much worse. So the silver miners are weathering one of the toughest environments they’ve ever seen, which we have to keep in mind.
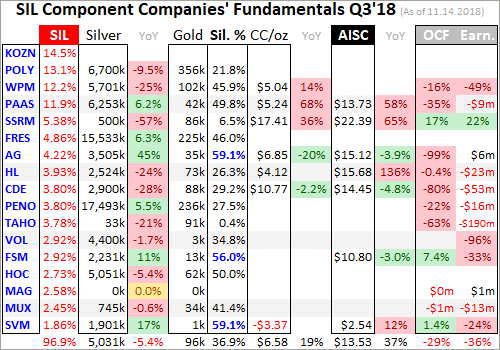
Every quarter I dig into the latest results from the major silver miners of SIL to get a better understanding of how they and this industry are faring fundamentally. I feed a bunch of data into a big spreadsheet, some of which made it into the table below. It includes key data for the top 17 SIL component companies, an arbitrary number that fits in this table. That’s a commanding sample at 96.9% of SIL’s total weighting!
While most of these top 17 SIL components had reported on Q3’18 by mid-November, not all had. Some of these major silver miners trade in the UK or Mexico, where financial results are only required in half-year increments. If a field is left blank in this table, it means that data wasn’t available by the end of Q3’s earnings season. Some of SIL’s components also report in gold-centric terms, excluding silver-specific data.
The first couple columns of this table show each SIL component’s symbol and weighting within this ETF as of mid-November. While most of these stocks trade on US exchanges, some symbols are listings from companies’ primary foreign stock exchanges. That’s followed by each miner’s Q3’18 silver production in ounces, along with its absolute year-over-year change. Next comes this same quarter’s gold production.
Nearly all the major silver miners in SIL also produce significant-to-large amounts of gold! That’s truly a double-edged sword. While gold really stabilizes and boosts silver miners’ cash flows, it also retards their stocks’ sensitivity to silver itself. So the next column reveals how pure these elite silver miners are, approximating their percentages of Q3’18 revenues actually derived from silver. This is calculated two ways.
The large majority of these top SIL silver miners reported total Q3 revenues. Quarterly silver production multiplied by silver’s average price in Q3 can be divided by these sales to yield an accurate relative-purity gauge. When Q3 sales weren’t reported, I estimated them by adding silver sales to gold sales based on their production and average quarterly prices. But that’s less optimal, as it ignores any base-metals byproducts.
Next comes the major silver miners’ most-important fundamental data for investors, cash costs and all-in sustaining costs per ounce mined. The latter directly drives profitability which ultimately determines stock prices. These key costs are also followed by YoY changes. Last but not least the annual changes are shown in operating cash flows generated and hard GAAP earnings, with a couple exceptions necessary.
Percentage changes aren’t relevant or meaningful if data shifted from positive to negative or vice versa, or if derived from two negative numbers. So in those cases I included raw underlying data rather than weird or misleading percentage changes. This whole dataset together offers a fantastic high-level read on how the major silver miners are faring fundamentally as an industry. They are hanging in there quite well.
Production is naturally the lifeblood of the silver-mining sector. The more silver and increasingly gold that these elite miners can wrest from the bowels of the earth, the stronger their fundamental positions and outlooks. These top 17 SIL miners’ overall silver production slipped 2.2% YoY to 75.5m ounces in Q3’18. But their shift into more-profitable gold mining continued, with aggregate production up 1.6% YoY to 1.4m ounces.
According to the Silver Institute’s latest WSS, total world silver mine production averaged 213.0m ounces per quarter in 2017. So at 75.5m in Q3, these top 17 SIL components were responsible for 35.4% of that rate. There is one unusual situation that slightly skewed this result. SSR Mining, which used to be known as Silver Standard Resources, saw its silver production plummet 57% YoY as its lone silver mine is depleting.
The winding down of SSRM’s old Pirquitas silver mine is proceeding as forecast and has been going on for some time. This once major silver miner is morphing into a primary gold miner, which accounted for a record 94% of its revenue in Q3. Excluding SSRM, the rest of these top SIL silver miners saw their silver production retreat an immaterial 1.3% YoY. That’s pretty impressive given this year’s collapse in silver prices.
Q3’s average silver price was just $14.96, down a major 11.2% YoY. That was far-worse performance than gold, with its quarterly average merely sliding 5.3% lower between Q3’17 to Q3’18. Considering how miserable this silver-price environment is with the worst relative performance to gold in decades, the major silver miners are doing well on production. They continue to hold out for silver mean reverting higher.
Silver is likely so down in the dumps because it effectively acts like a gold sentiment gauge. Generally big silver uplegs only happen after gold has rallied long enough and high enough to convince traders its gains are sustainable. Then the way-smaller silver market tends to start leveraging and amplifying gold’s moves by 2x to 3x. But gold sentiment was so insipid over this past year that no excitement was sparked for silver.
Unfortunately at these bombed-out silver prices the economics of silver mining are way inferior to gold mining. The traditional major silver miners are painfully aware of this, and have spent years actively diversifying into gold. In Q3’18, the average percentage of revenues that these top 17 SIL miners derived from silver was just 36.9%. That’s right in line with the prior 4 quarters’ 39.3%, 35.3%, 36.8%, and 36.3%.
Silver mining is every bit as capital-intensive as gold mining, requiring similar large expenses for planning, permitting, and constructing mines and mills. It needs similar heavy excavators and haul trucks to dig and move the silver-bearing ore. Similar levels of employees are necessary to run these mines. But silver generates much lower cash flows due to its lower price. Consider hypothetical mid-sized silver and gold mines.
They might produce 10m and 300k ounces annually. At last quarter’s average prices, these silver and gold mines would yield $150m and $363m of yearly sales. Thus regrettably it is far easier to pay the bills mining gold these days. So primary silver miners are increasingly becoming a dying breed, which is sad. The traditional major silver miners are adapting by ramping their gold production often at silver’s expense.
With major silver miners so rare, SIL’s managers are really struggling to find components for their leading ETF. So in Q3’17 they added Korea Zinc, which is now SIL’s largest component at over 1/7th of its total weighting. In my decades of studying and trading this tiny sector, I’d never heard of it. So I looked into Korea Zinc and found it was merely a smelter, not even a miner. It really needs to be kicked out of SIL.
Every quarter since I’ve tried to dig up information on Korea Zinc, but its English-language disclosures are literally the worst I’ve ever seen for any company. Its homepage gives an idea of what to expect, declaring “We are Korea Zinc, the world’s one of the best smelting company”. I’ve looked and looked and the latest production data I can find in English remains 2015’s. I can’t find it from third-party sources either.
That year Korea Zinc “produced” 63.3m ozs of silver, which averages to 15.8m quarterly. That is largely a byproduct from its main businesses of smelting zinc, lead, copper, and gold. Korea Zinc certainly isn’t a major silver miner, and has no place in a “Silver Miners ETF”. No silver-stock investor wants to own a base-metals smelter! Korea Zinc should be removed, its overweighting reallocated to the rest of SIL’s holdings.
SIL investors ought to contact Global X to ask them to stop tainting their ETF’s utility and desirability with Korea Zinc. If they want it to be successful and grow, they need to stick with their mission of owning the major silver miners exclusively. Silver-stock exposure is the only reason investors would buy SIL. There is another situation investors need to be aware of with Tahoe Resources and its held-hostage Escobal mine.
Tahoe was originally spun off by Goldcorp to develop the incredible high-grade Escobal silver mine in Guatemala, which went live in Q4’13. Everything went well for its first few years. By Q1’17, Escobal was a well-oiled machine producing 5700k ounces of silver. That provided 1000+ great high-paying jobs to locals and contributed big taxes to Guatemala’s economy. Escobal was a great economic boon for this country.
But a radical group of anti-mining activists managed to spoil everything, cruelly casting their fellow countrymen out of work. They filed a frivolous and baseless lawsuit against Guatemala’s Ministry of Energy and Mines, Tahoe wasn’t even the target! It alleged this regulator hadn’t sufficiently consulted with the indigenous Xinca people before granting Escobal’s permits. They don’t even live around this mine site.
Only in a third-world country plagued with rampant government corruption would a regulator apparently not holding enough meetings be a company’s problem. Instead of resolving this, a high Guatemalan court inexplicably actually suspended Escobal’s mining license in early Q3’17! Tahoe was forced to temporarily mothball its crown-jewel silver mine, and thus eventually lay off its Guatemalan employees.
That license was technically reinstated a couple months later, but the activists appealed to a higher court. It required the regulator to study the indigenous people in surrounding areas and report back, and then needs to make a decision. The government also needs to clear out an illegal roadblock to the mine site by violent anti-mine militants, who have blockaded Escobal supplies and physically attacked trucks and drivers!
So Escobal has been dead in the water with zero production for 5 quarters now, an unthinkable outcome. This whole thing is a farce, a gross miscarriage of justice. I hope this isn’t a stealth expropriation, that Guatemalan bureaucrats will get their useless paperwork done sooner or later and let Escobal come back online. Within a year, Escobal’s silver production should return to pre-fiasco levels of 5700k ounces a quarter.
At that rate, Escobal would retake the throne of being the world’s largest primary silver mine! It would boost overall SIL-top-17 production by a massive 7.6%. Last year no one expected this unprecedented Escobal debacle to last very long, as the economic damage to Guatemala was too great. But as it drags on and on, TAHO stock has been decimated. It slumped to a brutal all-time record low in mid-November.
Sadly for long-suffering TAHO shareholders, management capitulated. In mid-November they agreed to sell the company to Pan American Silver at rock-bottom prices despite a 55% premium over that all-time low. That’s devastating for TAHO investors but a steal for PAAS, which is SIL’s 4th-largest component at 11.9% of its total weighting. That keeps Escobal’s huge production in SIL if PAAS can finesse its reopening.
Unfortunately SIL’s mid-November composition was such that there wasn’t a lot of Q3 cost data reported by its top component miners. A half-dozen of these top SIL companies trade in South Korea, the UK, Mexico, and Peru, where reporting only comes in half-year increments. There are also primary gold miners that don’t report silver costs, and a silver explorer with no production. So silver cost data remains scarce.
Nevertheless it’s always useful to look at what we have. Industrywide silver-mining costs are one of the most-critical fundamental data points for silver-stock investors. As long as the miners can produce silver for well under prevailing silver prices, they remain fundamentally sound. Cost knowledge helps traders weather this sector’s left-for-dead unpopularity without succumbing to selling low like the rest of the herd.
There are two major ways to measure silver-mining costs, classic cash costs per ounce and the superior all-in sustaining costs. Both are useful metrics. Cash costs are the acid test of silver-miner survivability in lower-silver-price environments, revealing the worst-case silver levels necessary to keep the mines running. All-in sustaining costs show where silver needs to trade to maintain current mining tempos indefinitely.
Cash costs naturally encompass all cash expenses necessary to produce each ounce of silver, including all direct production costs, mine-level administration, smelting, refining, transport, regulatory, royalty, and tax expenses. In Q3’18, these top 17 SIL-component silver miners that reported cash costs averaged $6.58 per ounce. While that surged 35.3% YoY, it still remains far below today’s anomalously-low silver prices.
There are a couple of extreme cash-cost outliers that are skewing this average, but offsetting each other. SSRM’s depleting silver mine is producing less with each passing quarter, forcing fewer ounces to bear the fixed costs of mining. Its crazy-high $17.41 per ounce in Q3 isn’t normal. But on the other side of this is Silvercorp Metals, which produces silver in Chinese mines yielding enormous base-metals byproducts.
Selling those and crediting their value across the silver ounces mined dragged down SVM’s cash costs to an unbelievable negative $3.37 in Q3! Excluding these extreme outliers, the rest of the SIL top 17 saw average cash costs of $6.40. That’s not too far above the past 4 quarters’ $4.86, $4.66, $5.05, and $3.95. As long as silver prices remain over those low levels, the silver miners can keep the lights on at their mines.
Way more important than cash costs are the far-superior all-in sustaining costs. They were introduced by the World Gold Council in June 2013 to give investors a much-better understanding of what it really costs to maintain silver mines as ongoing concerns. AISCs include all direct cash costs, but then add on everything else that is necessary to maintain and replenish operations at current silver-production levels.
These additional expenses include exploration for new silver to mine to replace depleting deposits, mine-development and construction expenses, remediation, and mine reclamation. They also include the corporate-level administration expenses necessary to oversee silver mines. All-in sustaining costs are the most-important silver-mining cost metric by far for investors, revealing silver miners’ true operating profitability.
In Q3’18 these top 17 SIL miners reporting AISCs averaged $13.53 per ounce, which also surged 39.0% YoY. Again that was skewed in both directions by SSRM’s extremely-high $22.39 on Pirquitas’ depletion and SVM’s exceedingly-low $2.54 on those huge base-metals byproducts. Without them, the rest of the top 17 averaged $13.96 AISCs. That was much higher than the past 4 quarters’ $9.73, $10.16, $10.92, and $10.93.
The lower production was definitely a factor, which is inversely proportional to per-ounce costs. Silver-mining costs are largely fixed quarter after quarter, with actual mining requiring roughly the same levels of infrastructure, equipment, and employees. So the lower production, the fewer ounces to spread mining’s big fixed costs across. The major silver miners also reported lower ore grades, exacerbating the decline.
Nevertheless, the top 17 SIL miners’ AISCs both with and without the outliers still remained under silver’s weak average $14.96 price in Q3. So even with silver faring its worst relative to gold in decades thanks to devastated sentiment, the silver mines were profitable. And interestingly the closer AISCs crowd the prevailing silver prices, the more profits leverage the miners have to silver mean reverting much higher.
In mid-November silver and SIL slumped to their lowest levels since back in January and March 2016. That was early in a new silver bull which emerged from conditions like today’s where silver was despised. Over 7.6 months between December 2015 and August 2016, silver soared 50.2% higher as gold surged in its own new bull. And with silver moving again, investors eagerly started returning to the battered silver stocks.
Thanks to that silver-bull upleg, SIL skyrocketed 247.8% higher in just 6.9 months in essentially that first half of 2016! That ought to give embattled silver-stock investors some hope. All it will take to turn silver stocks around is a typical gold-driven silver upleg, and then they will soar again. The reason that silver miners’ stocks blast dramatically higher with silver is their high inherent profits leverage to silver prices.
Assume another 50% silver upleg, which is pathetically small by historical standards, from silver’s recent secular low in mid-November. That would catapult silver back up to $21 per ounce for the first time since July 2014. At Q3’18’s top-17-SIL-stock average AISCs of $13.53, profits were just $0.47 per ounce at $14 silver. But at $21 assuming stable AISCs, they would soar an astounding 1489% higher to $7.47 per ounce!
You better believe silver-stock prices would skyrocket with that kind of earnings growth. The higher their AISCs, the greater their upside profits leverage. Now consider this same 50% silver upleg using the rolling-past-4-quarter top-17-SIL-stock average AISCs of $10.43 per ounce. That implies the $3.57 profit seen at $14 silver would only balloon 196% to $10.57 per ounce at $21 silver. So higher costs aren’t necessarily bad.
As long as AISCs are below prevailing silver prices, the major silver miners can weather anything. The closer their AISCs creep to silver, the greater their earnings growth when silver mean reverts higher. So the major silver miners’ upside from here is truly explosive as silver recovers, just like back in early 2016. And silver will power much higher soon as the record silver-futures shorts of early September continue to be covered.
While all-in sustaining costs are the single-most-important fundamental measure that investors need to keep an eye on, other metrics offer peripheral reads on the major silver miners’ fundamental health. The more important ones include cash flows generated from operations, GAAP accounting profits, revenues, and cash on hand. As you’d expect given the miserably-low silver prices, they were on the weak side in Q3.
Operating cash flows among these SIL top 17 reporting them fell 23.0% YoY to $830m, which is totally reasonable given the 2.2%-lower silver production and 11.2%-lower average silver prices. Sales fell 9.5% YoY to $2717m, with some of the silver-side weakness offset by the 1.6%-higher gold production. And cash on hand fell 9.8% YoY to a still-hefty $2419m, giving these silver miners plenty of capital to weather this storm.
The hard GAAP accounting profits looked pretty ugly though, plunging to a $243m loss from being $88m in the black in Q3’17. But most of those losses didn’t reflect operations. TAHO alone wrote off a massive $170m for the impairment of Escobal, which reflected an estimated restart date of the end of 2019. Coeur Mining reported a smaller $19m writedown for one of its mines. These two non-cash charges alone were $189m.
Without them GAAP profits would’ve sunk from $88m in Q3’17 to a milder $54m loss in Q3’18. That’s still poor, but not unexpected given the lowest silver prices seen in almost several years. Again silver-mining earnings will soar if not skyrocket as silver inevitably mean reverts higher from here. All it takes for silver to surge in major bull-market uplegs is for gold itself to power higher, and huge gold upleg fuel abounds now.
The silver-mining stocks are doing way better fundamentally than they’ve been given credit for. Their higher Q3’18 mining costs still remained below the recent deep silver lows. And the compressed gap between their AISCs and low prevailing silver prices guarantees epic profits upside as silver recovers and mean reverts higher. That will attract back investors fast, catapulting silver stocks up sharply like in early 2016.
While traders can play that in SIL, this ETF has problems. Its largest component is now a base-metals smelter of all things! And the great majority of its stocks are primary gold miners with byproduct silver production. The best gains by far will be won in smaller purer mid-tier and junior silver miners with superior fundamentals. A carefully-handpicked portfolio of these miners will generate much-greater wealth creation.
The key to riding any silver-stock bull to multiplying your fortune is staying informed, both about broader markets and individual stocks. That’s long been our specialty at Zeal. My decades of experience both intensely studying the markets and actively trading them as a contrarian is priceless and impossible to replicate. I share my vast experience, knowledge, wisdom, and ongoing research through our popular newsletters.
Published weekly and monthly, they explain what’s going on in the markets, why, and how to trade them with specific stocks. They are a great way to stay abreast, easy to read and affordable. Walking the contrarian walk is very profitable. As of Q3, we’ve recommended and realized 1045 newsletter stock trades since 2001. Their average annualized realized gains including all losers is +17.7%! That’s double the long-term stock-market average. Subscribe today and take advantage of our 20%-off holidays sale!
The bottom line is the major silver miners’ fundamentals remain solid based on their recently-reported Q3’18 results. They continue to mine silver at all-in sustaining costs below even mid-November’s deep silver lows. Their profits will multiply dramatically as silver rebounds higher driven by gold’s own upleg and record silver-futures short covering. Investment capital will flood back in, catapulting silver stocks up violently.
So traders need to look through the recent forsaken herd sentiment to understand the silver miners’ hard fundamentals. These left-for-dead stocks are seriously undervalued even at today’s low silver prices, let alone where silver heads during the next major gold upleg. Silver can’t languish at extreme anomalous multi-decade lows relative to gold for long. And once it catches a bid, silver stocks will really amplify its upside.
Adam Hamilton, CPA
November 23, 2018
Copyright 2000 – 2018 Zeal LLC (www.ZealLLC.com)
By Daniel Cook
Part 2: It’s Only Natural…
Every mining company has the same problem, they’ve got to replenish their inventory every year. That means if they’re mining 100,000 ounces of gold annually they need to discover at least 100,000 ounces every year to stay afloat. Analysts and investors demand it and watch these inventory levels closely.
- Did you know SSR Mining’s most profitable operation could run out of gold reserves in 7 years or less?
- Did you know they just spent $337 million buying that mine (Seabee) in 2016?
- Did you know Seabee now accounts for approximately 39% of SSR Mining’s total cash flow and arguably one third of their $1.7 billion market cap?
Imagine if SSR Mining (SSRM, TSX) wasn’t able to find more gold before their reserves run out at Seabee, not enough to sustain production of +100,000 ounces per year anyway, and the negative impact it could have on the Company’s long-term growth plans (SSRM would take a negative hit too).
It’s a legitimate concern, but as a shareholder of SSR Mining you shouldn’t have to worry about that scenario because of the option agreement they signed recently with a little known microcap explorer called Taiga Gold (TGC, CSE).
*Editor’s Note: Taiga is the latest of what’s becoming a tradition of successful spinoffs from Eagle Plains (EPL, TSX-V)
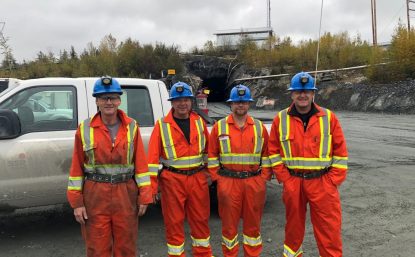
Taiga Gold Staff visiting the Seabee Gold Operation
Here’s the deal…
Taiga Gold has granted SSR Mining an opportunity to earn up to an 80% interest in the 34,000 hectare Fisher property by completing $4 million exploration expenditures and making $3.3 million in cash payments to Taiga Gold.
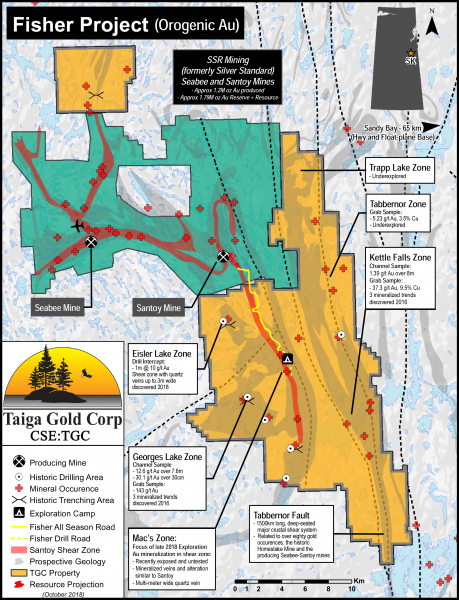
Looking at the map you can see this isn’t what some might call “closeology” in a derogatory way.
Taiga’s Fisher property is close to Seabee in a complimentary way!
In fact, the majority of what SSR Mining has mapped as the “Santoy shear zone” extends onto Fisher.
Think about that…
According to SSR Mining’s own maps the majority, call it 66%, of the Santoy shear zone extends onto Fisher!
That’s pretty major.
The two properties might as well be one.
This is the same belt of rocks, all underexplored and highly prospective geology for hosting gold deposits. More than 80 gold occurrences including the Homestake Mine and SSR Mining’s Seabee-Santoy mines are situated along the Tabbernor fault, a deep-seated crustal shear system that underlies Fisher for a strike length of 40 kilometres.
Fisher increases SSR Mining’s overall land package in the region by 150%!
Can you see how the Fisher property is majorly important for SSR Mining’s future in Saskatchewan?
Knowing Seabee is SSR Mining’s most profitable mine and it only has roughly 7 years of reserves, maybe less, making new discoveries and adding ounces is crucial.
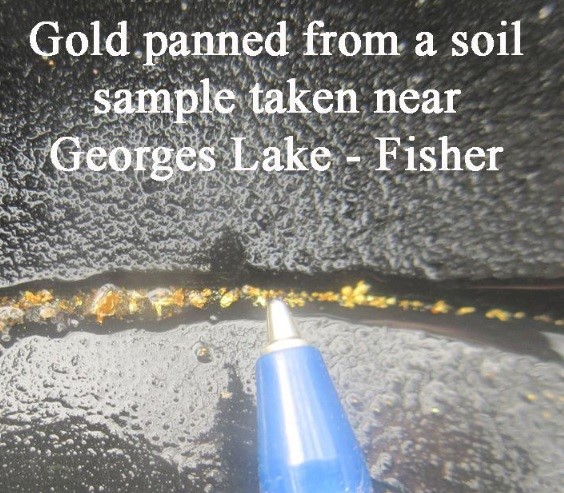
Early stage exploration work to date includes 1,600 soil samples, 600 rock samples, and 5,200 line km of geophysical data. Highlights being 25 rock samples grading +1 g/t Au and grab sample grading nearly 2 ounces Gold.
SSR Mining had a field crew of 8 people and 2 drill rigs working on the ground all summer. As of the most recent update 8,550 metres (14 holes) have been completed of a 15,000 metre drill program on Fisher in 2018. Results will be formally announced as they are received, compiled, and interpreted.
Who knows, we don’t have a crystal ball, but could you imagine a $1.7 billion company like SSR Mining being content with 80% ownership?
Assuming they meet their JV obligation by spending $4 million on exploration and give $3.3 million cash to Taiga I could see SSR Mining buying Taiga outright. That’s just my gut talking, but it’s certainly within the realm of possibilities.
Also within the realm of possibilities is that SSR Mining plays to win right away by acquiring Taiga before making a $3 million cash payment. As per the terms of the JV SSR Mining first spends $4 million on exploration to earn 60%, from there they have a one year, one-time option, to earn an additional 20% (for a total of 80%) by making the $3 million cash payment to Taiga.
Either way, both roads lead toward a takeover of Taiga.
If the Fisher property secures their future at Seabee why wouldn’t they make an offer?
SSR Mining is sitting on $493 million worth of cash.
Taiga Gold, at 9 cents per share, has a market cap of $5.4 million.
It’s only natural.
Geologically speaking the Seabee and Fisher properties are essentially one, so they belong together.
About the author: Starting out, Daniel Cook was a stockbroker during his college years. At the age of 23 he founded his own Registered Investment Advisory (RIA) firm. Daniel is a full-time investor and prospector of the markets, constantly digging for exceptional opportunities. Helping those companies get discovered and gain traction in the marketplace is Mr. Cook’s main objective.
By Tina Leto
The odds seem to be against uranium. Fukushima’s nuclear power plant is still disabled; the U.S. Supreme Court seems to be leaning towards staying Virginia’s moratorium on uranium mining, and projects such as Berkeley Energía’s Salamanca mine in Spain are facing major opposition.
So, why mine uranium and why now?
The answer is quite simple, actually. There is increased demand, and, after a period of volatility, prices are going up.
A series of current events are increasing demand and pushing up the value of U308. Bank of America Merrill Lynch commodities team raised its uranium concentrate price estimates for 2018, 2019 and 2020 by 3%, 22% and 32%, respectively.
Cameco CEO Tom Gitzel has a bullish look on uranium but remarked prices still have a long way to go to create some sort of optimism in the market, things are moving forward, even if it is in a slow and steady pace. The current spot price is up 40% from last year and has reached its highest level in over two-and-a-half years at around $28.75/lbs.
So, what is happening?
First, we need to take into account that, nearly eight years after the Great East Japan Earthquake, the resource-poor country has already reactivated five nuclear plants and nine reactors and has approved a 20-year operations extension for the Tokai Daini reactor located some 115 kilometres northeast of central Tokyo.
Although it is unlikely that it achieves it by 2030 as promised by the government, the Land of the Rising Sun is working towards its goal of generating a fifth of its electricity from nuclear plants in the next decade. To achieve this, of course, they will need the raw material, uranium.
Then we have China, whose uranium demand is expected to grow to around 10,800 tonnes by 2020 and rise to between 16,300 tonnes and 18,500 tonnes by 2025. The Xi administration has said it will spend $2.4 trillion to expand its nuclear power generation by 6,600% and in the near term, it plans to connect five reactors to the electricity grid and start building six to eight additional units.
In Southeast Asia, India is carrying out an aggressive growth policy reliant on nuclear power that uses both local and imported uranium. At present, the subcontinent has 22 nuclear reactors, 14 of which use foreign inputs, and it is in the process of finishing up six new units. In the next few years, 19 reactors are expected to be built.
In the Middle East, Saudi Arabia commenced reactor procurement discussions with supplier countries, as it plans to build two large nuclear power reactors and projects 17 GWe of nuclear capacity by 2040 to provide 15% of the kingdom’s power.
Canada, on the other hand, just launched its Small Modular Reactor Roadmap to promote the construction of such infrastructures, which are capable of generating up to 300 MW for small and remote communities and mines that are not connected to the electric grid.
As all of this is happening, supply is starting to see cuts given the decision by Canada’s Cameco to suspend its McArthur River/Key Lake operations in Saskatchewan, the world’s largest uranium mine, and the resolution of Kazakhstan’s state-owned Kazatomprom to lower output by 20% over the next three years as well as perform another 6% production cut over previous expectations.

*image courtesy of Bloomberg
In addition to the reduced supply, Kazatomprom recently sold 8.1 million lbs of its annual production to Yellow Cake, a new uranium holding company that raised $200 million in a London-based IPO and whose management is buying and storing large amounts of the metal in anticipation of higher prices.
Back in March, the World Nuclear Association reported that there are 448 reactors operative and 57 new reactors under construction, 158 reactors planned or on order, and another 351 proposed. The need for uranium is there and it is not going anywhere. Financial advisors believe that global consumption will grow from about 172 million lbs in 2017 to some 190 million lbs in 2019 while a supply gap should be in place by 2022-2023.
The balance seems to be slowly shifting into a deficit for the first time in more than a decade and, on top of all the cuts previously mentioned, the decision of producers like Cameco to buy larger quantities of material from the spot market going forward to fulfill long-term sales contracts will add upward pressure to the prices.
A drill hole away from a game changer
In other words, now is the time to invest in uranium stocks. With three projects underway, Azincourt Energy Corp (TSX.V: AAZ) is betting on a bright nuclear future. The primary focus of the Vancouver-based explorer and developer is its advanced exploration joint-venture with Skyharbour Resources, the 25,000+ ha East Preston Project, located in the Athabasca Basin, Saskatchewan where their team generated new drill targets to follow up after a successful geophysical exploration program.
Azincourt President and CEO Alex Klenman “These targets are similar to NexGen’s Arrow deposit and Cameco’s Eagle Point mine. East Preston is near the southern edge of the western Athabasca Basin, where targets are in a near surface environment without Athabasca sandstone cover.”
This region is gathering a lot of attention lately, especially after Skyharbour’s option partner Orano Canada (formerly Areva) announced recently that it plans to spend $2.22 million over the next year on exploration and drilling programs at the Preston project, which is right next door to the Azincourt/Skyharbour JV on East Preston.
In the next six years, big player Orano may end up investing about $6.04 million on exploration at Preston in exchange for up to 70% of the project. This is a hot zone of exploration with the Preston property and Azincourt/Skyharbour’s East Preston to be drilled at the same time. Who will make the first major discovery is anyone’s guess but, as always, it only takes one drill hole to transition from dwarf to giant.
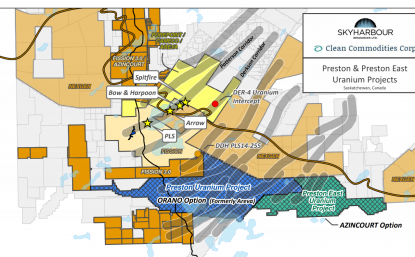
Skyharbour President and CEO Jordan Trimble “Over the past decade, we have seen a number of notable discoveries in the Athabasca Basin. The most notable of which was made by Nexgen Energy, at their Arrow deposit (25 km away from Skyharbour and Azincourt’s East Preston Project) where they have hundreds of millions of lbs of uranium at a high grade and boast a $1B market cap.”
And Azincourt seems to be betting at growing big time in the uranium space. Besides East Preston, the company led by Alex Klenman carries 10% of the Fission 3.0 Patterson Lake North project in Athabasca, and it recently acquired three highly prospective Peruvian-based properties known as the Escalera Group.
The South American project consists of three concessions occupying over 7,400 hectares on the Picotani Plateau, which have yielded historical samples of 6500 ppm uranium and recent samples of 3500 ppm uranium. Escalera is currently undergoing a mapping and sampling program.
According to Azincourt’s management, this latter grassroots play in an emerging uranium district combined the firm’s presence in the world-famous Athabasca basin are the well-founded pillars that boost its confidence in the silvery-white metal.
About the author: Tina Leto is a seasoned Canada-based writer focusing on the resource world.
The major gold miners’ stocks remain mired in universal bearishness, largely left for dead. They are just wrapping up their third-quarter earnings season, which proved challenging. Lower gold prices cut deeply into cash flows and profits, and production-growth struggles persisted. But these elite companies did hold the line on costs, portending soaring earnings as gold recovers. Their absurdly-cheap stock prices aren’t justified. Four times a year publicly-traded companies release treasure troves of valuable information in the form of quarterly reports. Companies trading in the States are required to file 10-Qs with the U.S. Securities and Exchange Commission by 40 calendar days after quarter-ends. Canadian companies have similar requirements at 45 days. In other countries with half-year reporting, many companies still partially report quarterly.
These quarterlies offer the best fundamental data available for individual major gold miners, showing how their operations are really faring. That helps dispel the thick obscuring fogs of sentiment that billow up the rest of the time. While I always eagerly anticipate perusing these key reports, I worried what this Q3’18 earnings season would reveal. Lower gold prices, flagging production, and weak sentiment are a witches’ brew.
The definitive list of major gold-mining stocks to analyze comes from the world’s most-popular gold-stock investment vehicle, the GDX VanEck Vectors Gold Miners ETF. Its composition and performance are similar to the benchmark HUI gold-stock index. GDX utterly dominates this sector, with no meaningful competition. This week GDX’s net assets are 50.5x larger than the next-biggest 1x-long major-gold-miners ETF!
GDX is effectively the gold-mining industry’s blue-chip index, including the biggest and best publicly-traded gold miners from around the globe. GDX inclusion is not only prestigious, but grants gold miners better access to the vast pools of stock-market capital. As ETF investing continues to rise, capital inflows into leading sector ETFs require their managers to buy more shares in underlying component companies.
My earnings-season trepidation soared on October 25th. The gold stocks were doing fairly well then, with GDX rallying 14.4% out of mid-September’s deep forced-capitulation lows . Sentiment was slowly improving. But that day GDX plunged 4.4% out of the blue, and the flat gold price at upleg highs certainly wasn’t the driver. The most-loved major gold miner had plummeted after reporting shockingly-bad Q3 results. Goldcorp has always been one of GDX’s top components. It reported mining just 503k ounces of gold last quarter, which plunged 11.9% sequentially quarter-on-quarter and 20.5% year-over-year! That forced its all-in sustaining costs a proportional 20.8% higher YoY to $999 per ounce. Investors panicked and fled, hammering GG stock 18.7% lower. That was the worst down day in the 24.6-year history of this company.
That left it at an extreme 16.2-year low! GG hadn’t been lower since August 2002 when gold was still in the low $300s, it was apocalyptic. That really torpedoed still-fragile sentiment in this sector, even though GG’s woes looked short-lived. It was bringing a new expansion online at one of its big mines, which was what caused the shortfall. Now in Q4’18 Goldcorp expects production to rebound to 620k ounces at $750 AISCs.
After GG’s Q3 disaster, I worried frayed investors would dump other gold stocks on any hints of less-than-optimal quarterly results. But GDX has ground sideways on balance since that GG shock, weathering this risky earnings season with sentiment so fragile. Ever since I’ve been anxious to analyze the collective Q3 results of the major gold miners as a whole, to see if GG’s travails were unique to it or more systemic.
GDX’s component list this week ran 48 “Gold Miners” long. While the great majority of GDX stocks do fit that bill, it also contains gold-royalty companies and major silver miners. All the world’s big primary gold miners publicly traded in major markets are included. Every quarter I look into the latest operating and financial results of the top 34 GDX companies, which is just an arbitrary number fitting neatly into these tables.
That’s a commanding sample, as GDX’s 34 largest components now account for a whopping 93.5% of its total weighting! These elite miners that reported Q3’18 results produced 296.4 metric tons of gold, which accounts for fully 33.9% of last quarter’s total global gold production. That ran 875.3t per the recently-released Q3’18 Gold Demand Trends report from the World Gold Council. I’ll discuss production more below.
Most of these top 34 GDX gold miners trade in the U.S. and Canada where comprehensive quarterly reporting is required by regulators. But some trade in Australia and the U.K., where companies just need to report in half-year increments. Fortunately those gold miners do still tend to issue production reports without financial statements each quarter. There are still wide variations in reporting styles and data offered.
Every quarter I wade through a ton of data from these major gold miners’ latest results and dump it into a big spreadsheet for analysis. The highlights make it into these tables. Blank fields mean a company had not reported that data for Q3’18 as of this Wednesday. Looking at the major gold miners’ latest results in aggregate offers valuable insights on this industry’s current fundamental health unrivaled anywhere else.
The first couple columns of these tables show each GDX component’s symbol and weighting within this ETF as of this week. While most of these stocks trade on US exchanges, some symbols are listings from companies’ primary foreign stock exchanges. That’s followed by each gold miner’s Q3’18 production in ounces, which is mostly in pure-gold terms. That excludes byproduct metals often present in gold ore. Those are usually silver and base metals like copper, which are valuable. They are sold to offset some of the considerable costs of gold mining, lowering per- ounce costs and thus raising overall profitability. In cases where companies didn’t separate out gold and lumped all production into gold-equivalent ounces, those GEOs are included instead. Then production’s absolute year-over-year change from Q3’17 is shown.
Next comes gold miners’ most-important fundamental data for investors, cash costs and all-in sustaining costs per ounce mined. The latter directly drives profitability which ultimately determines stock prices. These key costs are also followed by YoY changes. Last but not least the annual changes are shown in operating cash flows generated, hard GAAP earnings, revenues, and cash on hand with a couple exceptions. Percentage changes aren’t relevant or meaningful if data shifted from positive to negative or vice versa, or if derived from two negative numbers. So in those cases I included raw underlying data rather than weird or misleading percentage changes. This whole dataset together offers a fantastic high-level read on how the major gold miners are faring fundamentally as an industry. Was Goldcorp’s disaster systemic?
Major miners need to boost their reserves, and one way for them to do that is to invest in junior mining exploration corporations to find the next great deposit.
Here is a list of the companies that Barrick Gold (TSX-V: ABX) has invested in.
1) ATAC Resources (TSX-V: ATC)
ATAC is a Yukon-based exploration company focused on developing Canada’s only known Carlin-type gold district alongside Barrick at its Rackla Gold Property. ATAC and Barrick have partnered to explore the Rackla Gold Property’s Orion Project, with Barrick having the option to earn up to a 70% interest in Orion by spending $55 million in exploration.
2) Alicanto Minerals (ASX: AQI)
Alicanto is an ASX-listed mineral exploration Company focused on the exploration and development of a portfolio of gold projects in the prospective geological province of the Guiana Shield in South America.
Its main project, the Arakaka Gold Project, lies in an area that has been the source of more the 1Moz of alluvial and saprolite gold production, with a 100-year mining history.
The project covers an area of over 300km2 which is 100% held by Alicanto Minerals Ltd. and fully funded by Barrick Gold Corp. earning a 65% interest in the project with a US$10m funding commitment over 4 years from 1 March 2016.
http://www.alicantominerals.com.au
3) Royal Road Minerals (TSX-V: RYR)
Royal Road Minerals was founded in 2010 by the original founders and shareholders of Lydian International Ltd. Whilst at Lydian, the team discovered, financed and developed the +5 million oz Amulsar Gold deposit in Armenia.
Barrick agreed to purchase 9,875,876 ordinary shares at a purchase price of 16 cents per share for for $5-million. Royal Roads Minerals is exploring for Copper and Gold deposits in Central and South America.
https://www.royalroadminerals.com/
4) Midas Gold (TSX-V: MAX)
Midas Gold Corp., through its wholly owned subsidiaries, is focused on the exploration and, if warranted, site restoration and development of gold-antimony-silver deposits in the Stibnite-Yellow Pine district of central Idaho that are encompassed by its Stibnite Gold Project.
Midas Gold Corp. entered into an agreement with Barrick Gold Corp., whereby Barrick will purchase 46,551,731 common shares of Midas Gold for $38,065,907 (U.S.). The investment will result in Barrick owning 19.9 per cent of the issued and outstanding shares in Midas Gold.
Barrick’s investment supports Midas Gold’s continued efforts to permit the Stibnite gold project so that Midas Gold can build and operate a world-class mining operation that addresses legacy environmental impacts and generate economic benefits to the local community.
https://www.midasgoldcorp.com/
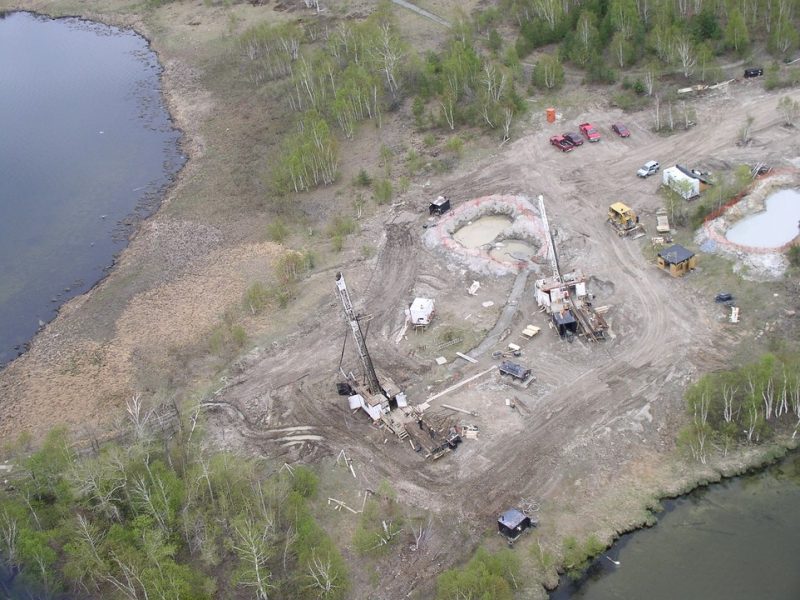
Exploration is at the heart of mining. Nobody can build a mining company without exploration. The greatest mining companies in Africa today invested in top geologists and exploration projects many years ago. The geologists’ brief was simple: hunt down and find the next best deposit. These geologists had flair, a spirit of adventure and a great appetite for taking risks, as had the companies that employed them. Mark Bristow, CEO of Randgold, perhaps epitomises this pioneering spirit best of all. Through continuously investing in exploration, Bristow has been able to find exceptional ore bodies which enabled him to develop extremely profitable mining operations in regions of Africa most were hesitant to enter at the time that he did. Bristow was lightyears ahead of his compatriots. He realised that Africa not only presents huge opportunities, but that exploration is the bedrock on which the African mining industry will be built.
With commodity prices on an upward curve, and a business friendly philosophy taking root in Africa, now is the time to get the hands and boots dirty. Countries like Sierra Leone, Liberia, Zimbabwe, South Africa, Angola and Senegal presents prodigious opportunities for geologists and exploration entrepreneurs. The recent Zimbabwean, Nigerian and Angolan offensives to lure investors has paid off, and more and more junior exploration companies are enquiring about opportunities in these countries. Towards the end of last year (before the regime change), the Zimbabwean government had only awarded three new exploration licenses. Today, a mere five moths later, more than 100 permits have been issued. New Zimbabwean Minster of Mines Winston Chitando, recently assured a room full of investors and exploration companies at the inaugural Harare Indaba in Johannesburg, which I attended, that they would be welcomed back into the country with open arms. More alluring though is Angola, which hosts prolific copper, iron ore, gold and diamond deposits.
Up until now Angola has been a bit of an enigma in terms of mining. But the countries’ new Minister of Mineral Resources and Petroleum, Dr. Diamantino Pedro Azevedo (a mining engineer) presented some enticing information acquired through solid geological surveys at a recent presentation, to which I was invited. What’s more, the Angolan government is now pursuing private investors, in a bid to broaden its mining base.
Barely a month after Azevedo promised that there are great opportunities for exploration, a few Canadian juniors announced that they are wetting their toes in Angolan waters. Moreover, the Nigerian drive to diversify has tempted several explorers to take on that massive unchartered territory. The big constraint though, especially for African exploration companies, remains financing. At the moment their only option is to raise money on the London, Canadian or Australian Stock Exchanges. For now, it seems that African investors just don’t want to walk that extra mile to fund high-risk exploration projects on their own continent, and it’s a shame. Until they do that, it is highly unlikely that we will see homegrown African mining companies dominating the African mining scene.
About Leon Louw:
Leon specializes in African affairs and doing business in Africa, and has been writing about mining in Africa for 8 years. He was born in Johannesburg, South Africa, and has traveled Africa extensively, especially southern Africa. He has a BA degree with a specialization in African studies and an honours degree in Africa Politics. He also have a national diploma in Nature Conservation and an honours degree in Environmental Management. It is is passion to promote business in Africa and I can assist companies that are interested in doing business in African countries.
You can see his work at African Mining and Mining Mirror and online at http://www.miningafricaonline.co.za/.
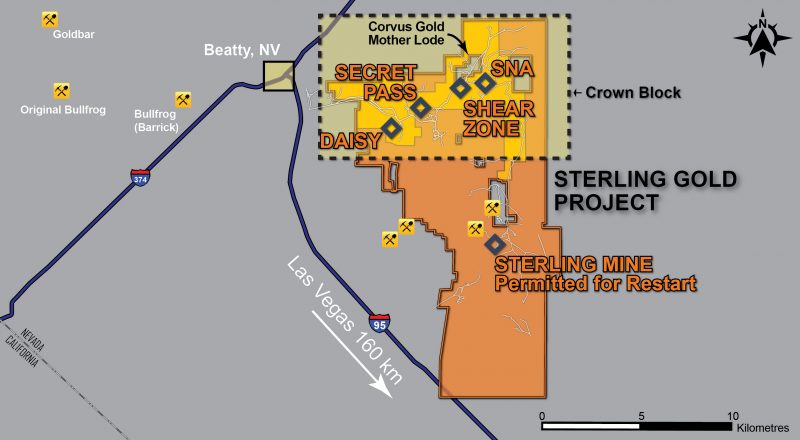
Northern Empire Resources Corp. (TSX-V: NM) released results from its Daisy Deposit as part of its 2018 15,000-metre drill program to expand resources at the Sterling Gold Project in Nevada. These results will go towards an updated resource due in the first half of 2019 and indicate the potential for an open pit, heap leach operation. The Daisy Deposit is located within the Crown Block of deposits in the north of the Company’s property.
Drill hole D18-003C was a vertical core hole that returned an intercept of 123.93 meters of 1.41 grams per tonne (g/t) gold (Au). The intercept included 38.25 meters of 3.09 g/t Au and oxides in the hole extended to a depth of 173 meters.
This is the third drill hole Northern Empire has reported from the Daisy Deposit. Results from last year included 47.24 meters of 1.47 g/t Au in hole D17-001 and 21.34 meters of 1.83 g/t Au in hole D17-002. All historical drilling at Daisy occurred before the introduction of NI 43-101 reporting standards, so confirmation drilling is required to expand the resource. Historical drilling was also all reverse circulation (RC), so core holes are vital for developing a comprehensive geological model.
In comparison to historical holes near D18-003C, yesterday’s result encountered mineralization closer to surface than expected. In concert with nearby mapping and sampling which returned surface grades of up to 15g/t, these results are demonstrative of the potential this system could be larger than previously thought.
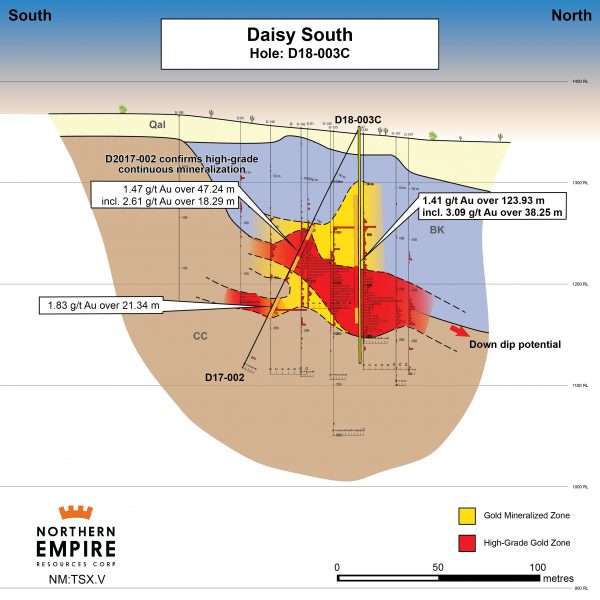
Michael G. Allen, President and CEO, commented:
“D18-003C is the first of at least 10 exploratory, resource expansion, and infill holes that we plan to drill into the Daisy Deposit as part of our 15,000-meter program. The exceptional grade of these results is very encouraging. All of the mineralization from 67.88 to 173.22 meters down the hole was oxidized, as was the final 2.87 meters of mineralization. For the high-grade core of the deposit, where we cut 38.25 meters of 3.09 g/t gold, cyanide solubility assays averaged 90% of fire assay, indicating that the Daisy deposit may be amenable to open pit mining with heap leach recovery of gold.”
The broad intervals of relatively shallow, high-grade oxide mineralization present here are key if Daisy is to ever benefit from a low cost and efficient open pit, heap leach operation. The advantage of heap leach mining is that they generally have low all-in sustaining costs and provide rapid payback to the operator. The average grade of heap leach operations in Nevada is approximately 0.7g/t gold, which would make the inferred resource at Daisy of 174,000oz of gold at 2.12g/t triple that.
The Daisy Deposit is located in the Bare Mountain district known for its legacy of past production. The trend is along an east-west structure that hosts Barrick’s Bullfrog Mine on the westernmost extension and stretches to the east where Northern Empire’s SNA deposit and Corvus Gold’s (TSX: KOR) Mother Lode deposit. Mother Lode is located completely within Northern Empire’s claim package. Along this trend, more than four million ounces of gold have been extracted or identified in situ.
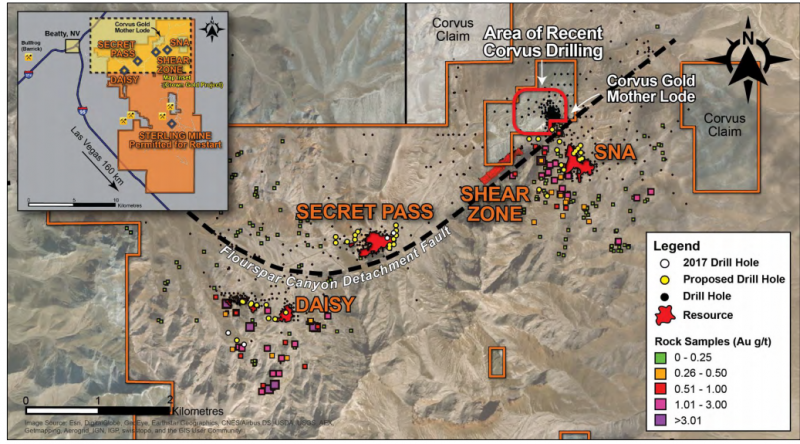
With several high-grade historical holes and showings, Northern Empire’s overall land package remains underexplored and numerous regional targets demand follow-up. For 2018, Northern Empire management put together a large exploration program with the intention to expand the resource through drilling. The company’s exploration is starting to demonstrate the potential at the Daisy Deposit.
The market has been responding positively to drill results. Since initial results released from the Daisy deposit on October, 04, 2017, shares in the company have moved from 77 cents per share to a year-high of $1.43, and at close of Feb. 23, 2018, $1.30. Upon release of the most recent results from Daisy, the stock rose 12 cents to $1.39 on 231,088 shares.
The company is also responding positively to these results with immediate plans to mobilize an additional drill rig to Daisy. Currently rigs are working on the SNA and Secret Pass deposits which are part of the Crown Block of deposits which includes the Daisy Deposit. In addition, field crews are mapping extensions of the known deposits and new drill targets.
This is just the beginning for Northern Empire in Nevada. Nevada is one of the largest gold producers in the world, renowned for open pit deposits which are amenable to heap leach mining. The early results from Daisy are indicating that the company is on the right track to adding high grade ounces to support the case for another open pit, heap leach mine in Nevada.
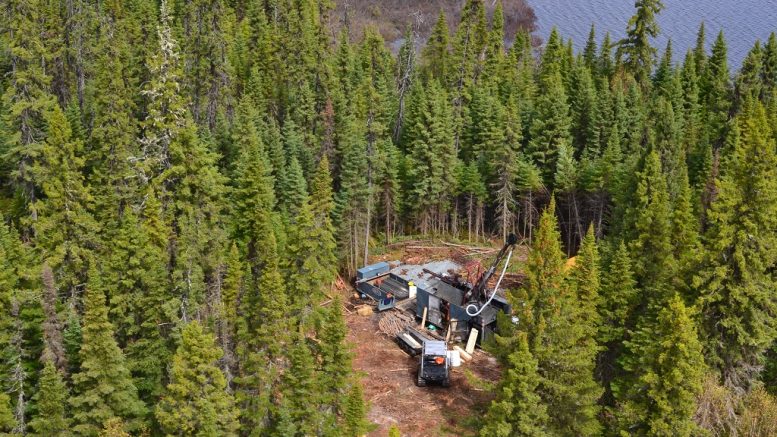
by: Northern Miner Staff Writer, SEPTEMBER 27, 2017
The geological model Bonterra Resources (TSX-Venture: BTR) is applying to its Gladiator gold project in the Abitibi belt of Quebec is proving to be a reliable predictor of where extensions of the already substantial deposit will appear.
As a result, the Vancouver-based company has been able to quickly expand the known gold mineralization along strike and at depth and is finding multiple new mineralized horizons within the 105 square kilometre land package.
“We let the deposit do the talking,” says Dale Ginn, Bonterra’s Vice-President of Exploration. “It’s a classic stacked vein system that responds well to a combination of till sampling, magnetics, and LIDAR (remote sensing using lasers).”

Location map of Bonterra Resources’ gold projects in the Abitibi gold belt of Ontario and Quebec. Credit: Bonterra Resources.

An ownership map outlining Bonterra Resources’ Gladiator gold property and surrounding area in Quebec. Credit: Bonterra Resources.
The Gladiator gold deposit occurs within highly silicified, altered and sheared mafic volcanics, with local intrusions of syenite and quartz porphyry. Smoky quartz veins contain most of the mineralization including free gold, minor pyrite, chalcopyrite and sphalerite, especially in or near the vein contacts.
In 2012 Snowden Mining Industry Consultants identified an inferred resource of 905,000 tonnes grading 9.37 grams gold per tonne (273,000 contained oz.) within a relatively small deposit.
Since then, Bonterra has extended mineralization to a strike length of 1,200 metres and a depth of 1,000 metres below surface. The deposit remains open in all directions and drilling has identified at least five distinct sub-parallel zones.

A gold-rich core sample from Bonterra Resources’ Gladiator gold project in Quebec. Credit: Bonterra Resources.
The Abitibi greenstone belt straddling the mining-friendly jurisdictions of Ontario and Quebec is receiving a great deal of attention these days because of its potential to host more gold deposits such as Gladiator within an already prolific camp with excellent infrastructure. A relatively high gold price, at roughly US$1,300 per oz., is an added incentive.
The Urban-Barry sub-belt that hosts the Gladiator deposit is an underexplored section of the Abitibi. Encouraged by progress at Gladiator, Bonterra has more than doubled its land position along the northeast trending shear structure and its exploration team is consistently intersecting high-grade zones at mineable widths with step out drilling.
“Bonterra has found a new high-grade deposit that looks like it will have some size and that’s a very rare thing, especially within a jurisdiction that is open for business,” says Ginn, an experienced geologist and mine executive who has participated in several gold and base metal discoveries. “Every single drill hole is adding ounces and the mineralization is becoming predictable.”
High profile investors have taken note. In March, Kinross Gold (TSX: K; NYSE: KGC) purchased a 9.5% stake in the company for $5.2 million. Other major shareholders include Eric Sprott, Kirkland Lake Gold (TSX: KL; NYSE: KL) and New York-based Van Eck. Their confidence in the junior has had a domino affect, allowing Bonterra to raise another $35 million through two oversubscribed bought deal financings and one private placement.
As a result of the recent deals, Bonterra now has about 162 million shares outstanding and a market capitalization of $65 million. Shares have been trading in a 52-week range of 21-55 cents with recent trades closer to 40 cents.
With exploration financing secured, Bonterra will ramp up its drill program at Gladiator, adding two drills to the four already turning. Some of the work will focus on infill drilling in preparation for an updated National Instrument 43-101 resource estimation in the first half of 2018. The rest will test exploration targets identified along the company’s extensive land package.
If Bonterra continues to demonstrate continuity in the 800 metre long gap (the “Rivage Gap”) between the Rivage Zone — once thought to be a distinct, separate deposit to the west — and Gladiator, resources would increase significantly from the 273,000 ounces identified by Snowden. Recent drill results within the gap include 3.8 metres grading 16.8 gpt and three metres grading 21.5 gpt gold.
Bonterra also has a 100% stake in the Larder Lake project in the Abitibi belt, acquired in 2016 for $4 million in cash and shares, or approximately $4 per ounce of gold in historical resources. The property hosts the Bear Lake, Cheminis and Fernland deposits that occur along 10 kilometres of the Cadillac-Larder break between Kirkland Lake and Virginiatown in Ontario.
Various groups have drilled more than 100,000 metres at Bear Lake over the years and the deposit remains open at depth. It has two shafts and mine development extends to a depth of 330 metres. With access to such an extensive database for modelling, Bonterra intends to conduct a thorough geological review of the historical data and conduct further exploration based on the results.
But for now, all eyes are focused on Gladiator, where an aggressive drilling program is confirming and adding ounces to a gold deposit that drew the attention of sophisticated investors early on and continues to reward them.
— The preceding Joint Venture Article is promoted content sponsored by Bonterra Resources Inc. and written in conjunction with The Northern Miner. Visit bonterraresources.com to learn more
— Bonterra is an advertiser with MiningFeeds.com. MiningFeeds was compensated in cash for marketing services. This article was published with permission from management at Bonterra Resources.
Day 3 of my Newfoundland trip started at the crack of dawn, when I was awakened before 4am by the alarm of the logger in the room next to me at the Lakeview Inn in Millertown. I tossed and turned for the next hour and a half and then made my way downstairs, where I had a terrific breakfast with Antler Gold’s exploration team. After breakfast, we headed to the team’s exploration home base, a rented cabin a few blocks away from the Inn.
Millertown located on the Shores of Red Indian Lake
For the exploration team, each day starts here with a safety review and a delegation of assignments by Exploration Manager, Dave Evans. By about 7 am, we were on the road headed south of Millertown, down a set of logging roads, to Antler’s Wilding Lake Gold Project.
Yours Truly standing in Antler’s Elm Zone Trench
Before getting any further into my site visit report, I’m going to share some interesting facts about the history of Millertown.
Millertown
Just south of Buchans junction, which sits at the north end of Red Indian Lake in central Newfoundland, is Millertown. Millertown was established in about 1900 by Lewis Miller, a timber baron and merchant from Crieff, Scotland.
Having exhausted his timber lands in Sweden, Miller brought a team of Scots and 100 Swedish lumberman to the Red Indian Lake area, in an effort to establish a logging operation that could supply the British Empire with pine timber.
What is left of the old saw mill in Millertown
The town was created to house this team of lumbermen as they built 80 Swedish style, two-room cottages along the shores of the lake. Additionally, they constructed a school and a church on the hill overlooking the lake, which still stands today.
Millertown Church and homes along the shores of Red Indian Lake
During my visit, I asked about the logging industry in the area, and was told that since the closure of the pulp and paper mill in Grand Falls, logging in the area has really declined with only a small number of companies still in operation. Unfortunately, the industry’s decline has had a major effect on the town and many younger families have left.
Shores of Red Indian Lake
With the area’s great geology and the access provided by the logging roads, however, a mining renaissance could be coming to Millertown and the surrounding area. Companies such as Antler Gold, Marathon Gold and Torq Resources are exploring heavily in this general region. A large discovery and the development of a mine could bring much needed cash and jobs to this beautiful area in central Newfoundland.
The Wilding Lake Gold Project
After driving for about an hour on the rough logging roads, we arrived at the point of the original Wilding Lake gold mineralization discovery, which occurred just a few years ago. The gold was found in 2015 by prospectors, Brian Jones and Gary Rowsell, in quartz boulders alongside a new logging road. Grab samples from these boulders assayed up to 74.8 g/ton gold.
Approximate location of the first boulders discovered by Jones and Rowsell
Jones and Rowsell eventually sold the property to Altius Minerals, which is a large mining royalty company based in St. John’s, Newfoundland and Labrador. Altius then carried out further exploration activities in the fall of 2016, such as soil and basal till sampling, airborne and ground geophysics.
Fast-forwarding to today, Altius has since optioned the property to Antler Gold, who is currently conducting a systematic exploration program of the property with soil sampling, trenching and, most recently, a 2,500m drill program of some highly prospective targets.
To note, Antler’s Wilding Lake Project covers 215 sq. km and more than 50 km of strike length of the projected structural trend that is believed to control the regional gold mineralization. This trend is the same as Marathon Gold’s Valentine Lake Gold Camp, which currently boasts a total over 2 million ounces of 43-101 compliant gold resources in the Measured and Indicated, and Inferred Resource categories.
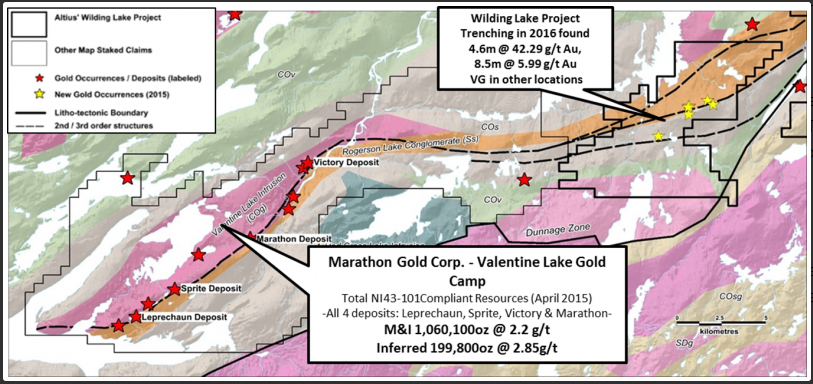
Wilding Lake Gold Project Geology Map
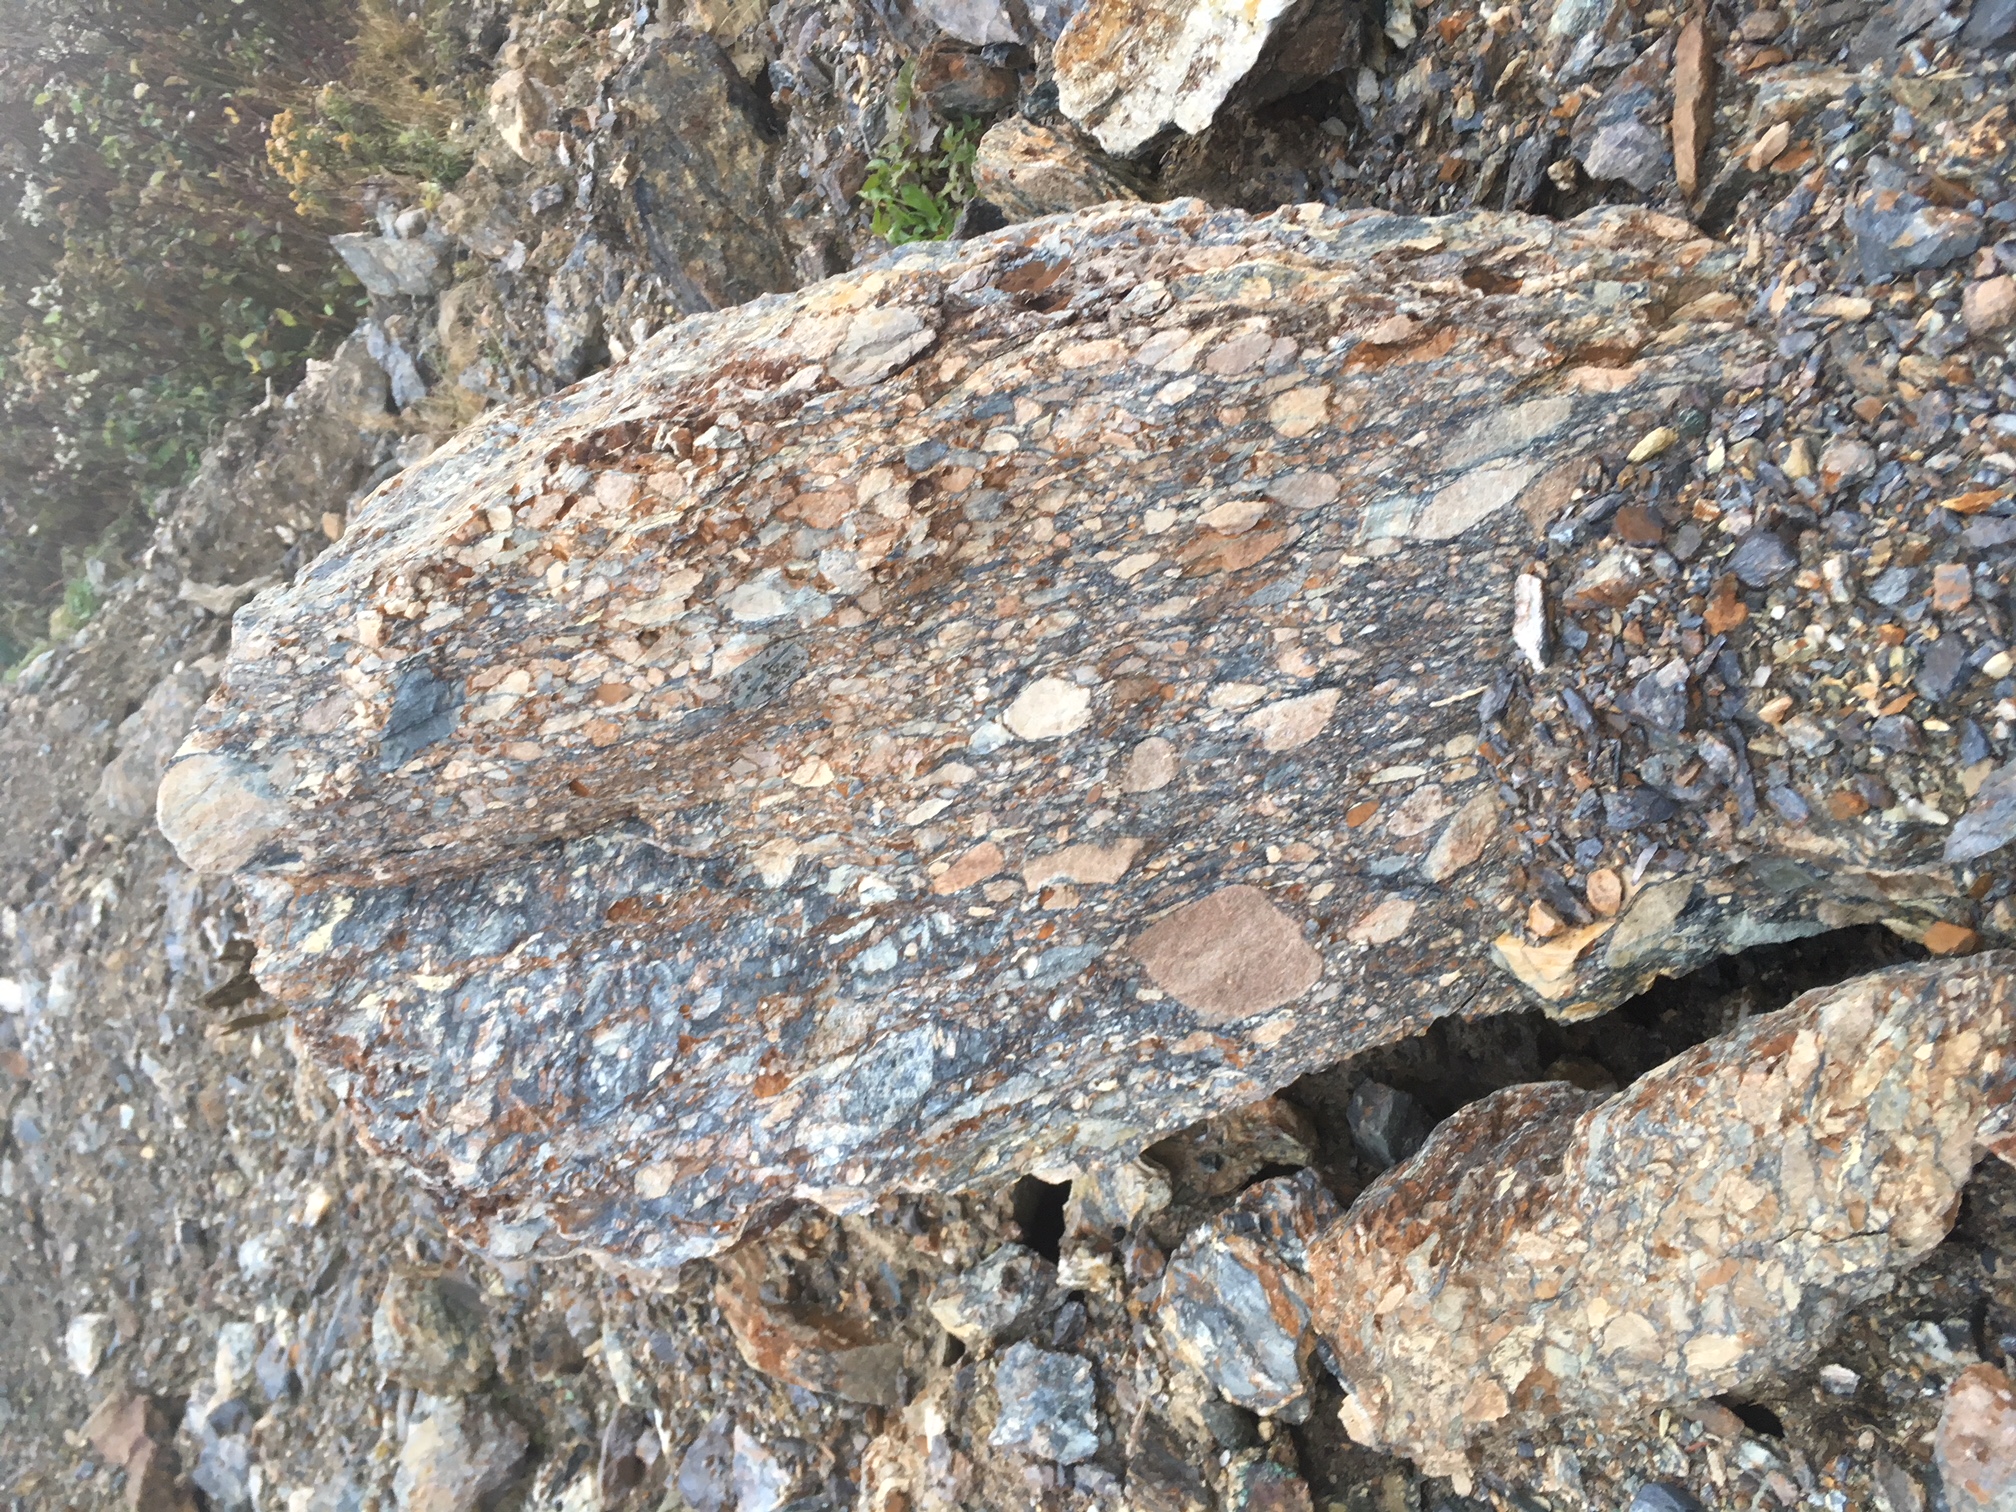
Text Book Example of Rogerson Lake Conglomerate
Gold Mineralization Zones
In 2016, 5 gold mineralization zones – Alder, Taz, Elm, Cedar and Dogberry – were found by Atlius’ exploration team. The gold showings mainly consist of quartz-tourmaline veins containing clots of coarse-grained chalcopyrite, hematite, malachite and visible gold is hosted by the Rogerson Lake Conglomerate.
Taz Zone Trench located in Close Proximity to Original Boulder Discovery
In the picture below, the purplish coloured rock is the Rogerson Lake Conglomerate. As the conglomerate nears the quartz veining, its colour changes to brownish. The Elm Zone was the most developed trench I saw, and the focus of drilling at the time of my visit.

Elm Zone Trench – Rogerson Lake Conglomerate, bottom left purplish colour
Elm Zone Trench – Site of drilling on the day of my visit
Taz Trench Rock
Systematic Exploration
The drive down the logging roads to Wilding Lake gave Exploration Manager Dave Evans and I a chance to talk about the project, and the systematic approach they are using to find gold mineralization on the property. In the mining industry, a systematic approach is paramount to conserving capital and making every dollar count.
Beginning in the summer, Evans and his team set out to explore as much of the property as possible, taking soil samples and mapping the property, in hopes of identifying further targets for this fall’s 2,500m drill program.
This systematic approach is particularly important for exploration in Central Newfoundland and Labrador because of the amount of overburden which masks most outcroppings. This overburden layer can vary in depth from 0.5m to 15m throughout Newfoundland and Labrador.
The layering of the soil can be seen when standing in the dug trenches, as the top thin layer of organics clearly sticks out on top, followed by an overburden blanket of varying thickness, which is followed by basal till along the top of the rock.
Evans pointed out that the key to proper soil sampling is to get a sample below the organics in the A horizon, down to the brownish soil, where there is the possibility for gold to be present. When high potential soil samples or boulders are found, the geologists identify the path of the glaciers, which would have worn the mineralized outcrops as they moved across, many years ago. The exploration team then moves up ice of the high gold in soil or boulder samples to (hopefully) find the buried quartz vein outcrops.
By overlaying soil and till sampling data with the geophysical data, followed by trenching and channel sampling along the quartz veins in each zone, the team has identified high potential targets which, at the time of my visit, were the focus of the drilling.
Evans told me that, to date, they have collected over 6000 samples across the property. In the July 26th, 2017 news release, Antler released the gold soil geochemistry diagram seen below.
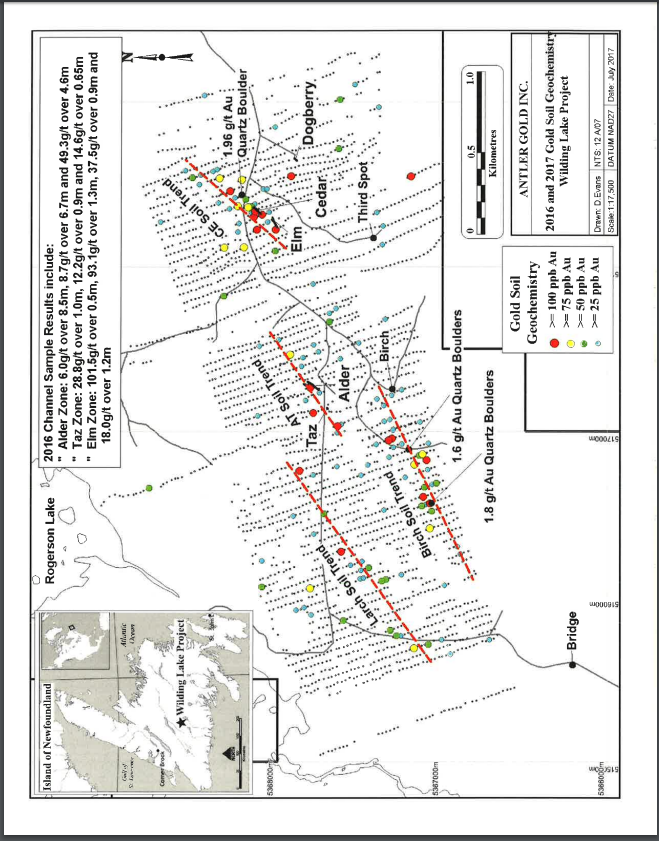
2016 and 2017 Soil Geochemistry Wilding Lake Project – News Release July 26th, 2017
Further in the August 30th, 2017 news release, Antler announced the discovery of new mineralized zones, Red Ochre and Raven. The Red Ochre Zone is located roughly 900 meters to the southwest of the Alder Zone, while the Raven Zone is located 400m to the northeast of the Red Ochre Zone.
Antler’s systematic approach to exploration is clearly working and makes me confident that if there is more gold mineralization within their claim boundaries, they will find it!
Pointing out a Fleck of Gold at the Taz Trench Outcrop
Trenching Work
I have included a few pictures from my visit and a few images produced by Antler depicting the Elm Zone, Alder Zone and Dogberry Zone trenches, which have channel sampling data included from the quartz veins. These were a part of a January 24, 2017 news release.
Elm Zone Trench – Quartz Vein Outcrop
Elm Zone Trench – Exploration Manager, Dave Evans
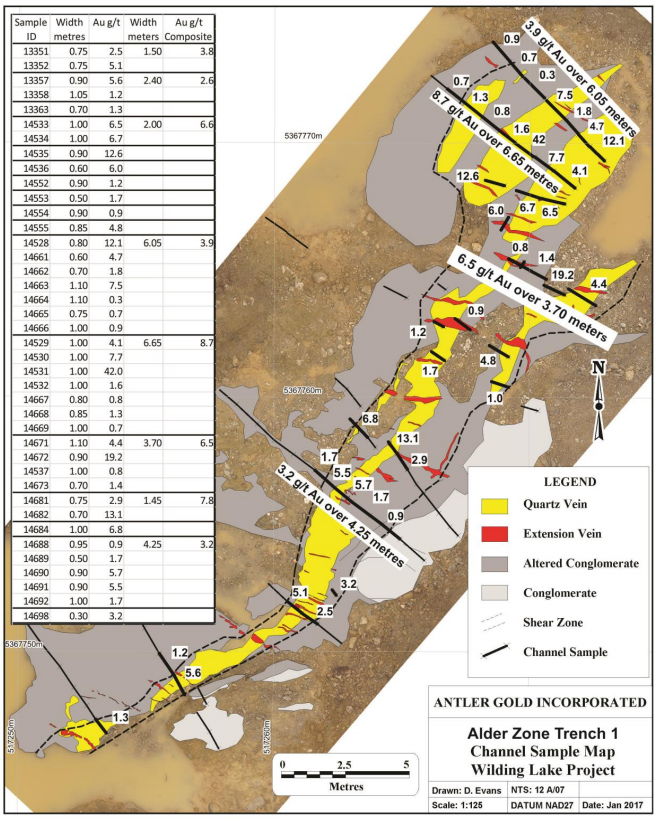
News Release Jan.24, 2017 – Alder Zone Trench
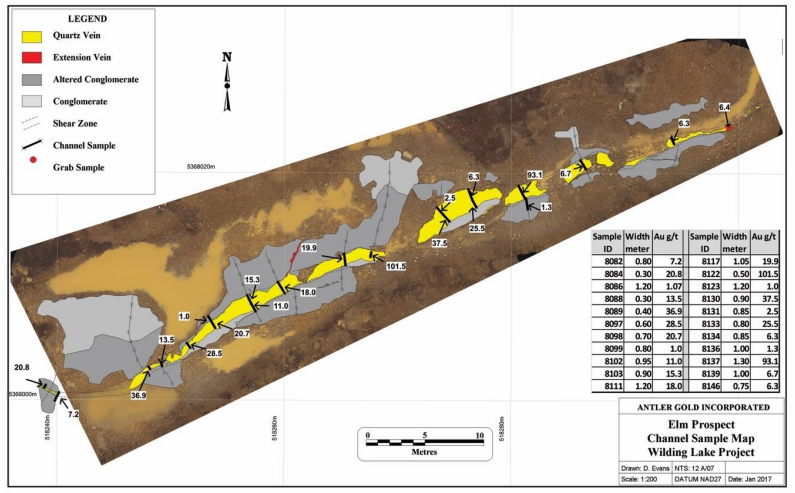
News Release Jan.24, 2017 – Elm Zone Trench
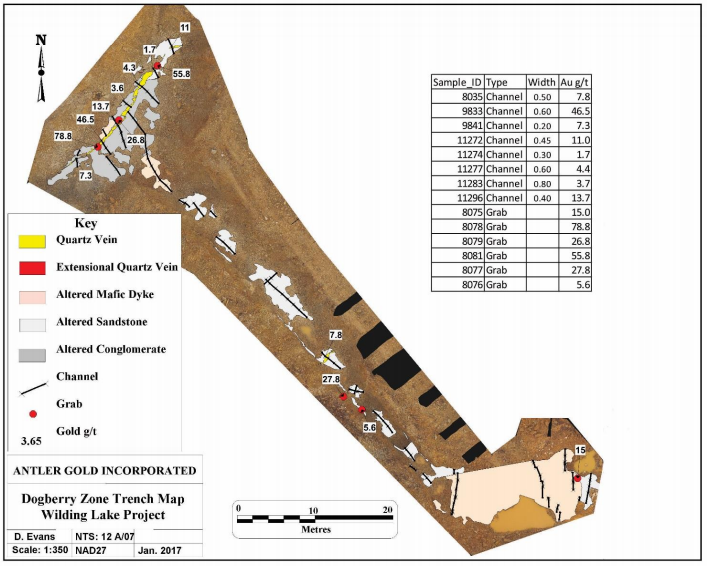
News Release Jan.24, 2017 – Dogberry Zone Trench
Newfoundland and Labrador – A New Frontier for Gold Exploration
Finally, for those who haven’t read my article on Newfoundland and Labrador as a mining jurisdiction, and/or don’t know much about this great province on Canada’s East Coast, you can find it here.
Concluding Remarks
Touring the property with Exploration Manager, Dave Evans, was an exciting and very insightful experience. In any mineral exploration endeavour, a systematic approach that ensures dollars are spent wisely is vital to the success of the operation. In the case of Antler, I had the chance to see, first hand, the dividends that are paid when you have a defined process that’s performed by an experienced team.
Secondly, having met Antler CEO, Dan Whittaker, this past summer in Toronto, I’m confident Antler shareholders, including myself, are in good hands moving forward. I am a buyer of Antler Gold and look forward to the first round of drill results in the coming weeks.
Don’t want to miss a new investment idea, interview or financial product review? Become a Junior Stock Review VIP now – it’s FREE!
Until next time,
Brian Leni P.Eng
Founder – Junior Stock Review
Disclaimer: The following is not an investment recommendation, it is an investment idea. I am not a certified investment professional, nor do I know you and your individual investment needs. Please perform your own due diligence to decide whether this is a company(s) and sector that is best suited for your personal investment criteria. Junior Stock Review does not guarantee the accuracy of any of the analytics used in this report. I do own Antler Gold shares. I have NOT been compensated to write this article and have No business relationship with Antler Gold.
Canada’s North is a mysterious and forbidding land. There are stories of European explorers disappearing without a trace and place names such as Deadman’s Island. Native legends from the original occupants – not to mention strangely colourful lights that often dance across the night sky – add to the intrigue. I saw the Northern Lights for the first time during the site visit. The scientific explanation does little to diminish their mystique.

Flying over the barren lands of Northwest Territories and Nunavut gave me a renewed respect for Chuck Fipke and all the other Northern pioneers who identified mineral deposits there. Between Yellowknife and Sabina Gold & Silver’s Goose camp, the plane travelled over hundreds of kilometres of waterlogged tundra with nary an interruption. Then, rather suddenly, an open-pit diamond mine – a mineralized pin prick in a pin cushion measuring millions of square kilometres. The diamond mine was Diavik; Ekati is nearby.
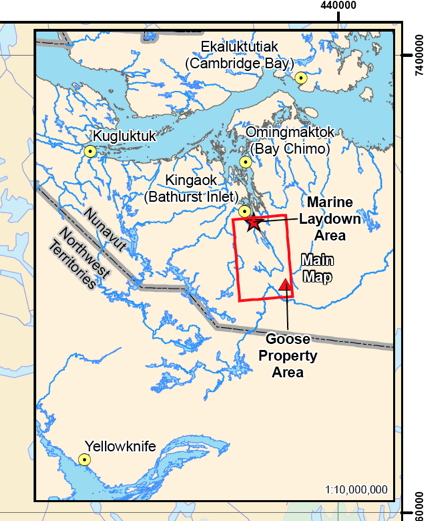
This is about as far from “civilization” as it’s possible to get. For perspective, driving from Billings, Montana to Edmonton, Alberta, a major Canadian northern outpost, takes about 11 hours – roughly akin to driving from Durango to Los Angeles. It takes another 15 hours to drive from Edmonton to Yellowknife — the equivalent of travelling from Los Angeles to Portland. Sabina’s Back River project is a further 520 kilometres beyond Yellowknife, to the northeast.
As for Sabina, the main mystery on the company’s vast Back River property may be just how many high-grade ounces are buried under the Arctic tundra. It’s a puzzle this summer’s drill program should go some way to solving. A single early result from the 10,000-metre summer exploration program was promising. The first drill hole, 17GSE516B – released the morning I flew into Yellowknife en route to the site visit – intercepted 9.48 g/t gold over 38.55 metres in a down-plunge extension of the Llama deposit. Not bad for a 460-metre step-out hole.
FIRST IMPRESSIONS
Our plane of analysts landed at the Goose camp on a high-quality air strip made from gravel produced on-site. The camp gets its name from adjacent Goose Lake, which serves as the winter landing strip for 737s that come in laden with fuel. The well-run camp felt more like a mining operation than an exploration camp.
Inside, we were briefed on the objectives of the summer drill program and the path forward by CEO Bruce McLeod, VP Exploration Angus Campbell and Exploration Manager Jamex Maxwell. The broad outlines of the mine were established by the initial project 3,000-tonnes-per-day Feasibility Study (3KFS) McLeod commissioned when he took over in February 2015. At US$1,150/oz gold, C0.80 exchange and a 5% discount rate, the FS showed:
- 240,000 oz annually for first 8 years, about 200,000 oz for 12-year life of mine;
- $415 million initial capex, $185M sustaining capex;
- 6.3 g/t Au average head grade, 93% recovery;
- life-of-mine, all-in cash costs of US$763/oz (incl initial & sustaining capex & closure costs)
VP Ex Campbell spoke about uber-high-grade exploration upside (more on that later), while derisking was the major theme for McLeod: “We can’t afford to make mistakes in this part of the world.” Sabina has spent about $5.5 million on basic engineering since the completion of the Feasibility Study, he said, and is now into detailed engineering.
The CEO describes the Back River project as a straightforward mine in a complex environment. From a geotechnical perspective, McLeod says Back River is probably the simplest project he’s been involved with. His assertion was confirmed by a visit to the nearby mill site, the helicopters landing on flat bedrock terrain. One of the benefits of a vast property is the ability to choose exactly where the mill will be. Standing on the flat terrain of scrub and bedrock, with a 360-degree panorama view, it was easy to visualize a mine taking shape.

I found an analogy McLeod used in his recent presentation at the Beaver Creek precious metals summit useful: “To a layperson, a feasibility is a concept, basic engineering is a plan and detailed engineering is a blueprint.” As Sabina constructs the blueprint, the focus is on investing upfront to avoid problems down the road. During the site visit, McLeod talked about his love for technology and some of the high-tech toys at his house, which he said “has lots of gizmos and bells and whistles and shit that breaks down all the time. It won’t happen here.”
It’s not typical CEO bluster: McLeod has already built a mine in Canada’s North. That was Capstone’s Minto copper mine in the Yukon, built by Sherwood Copper and the first hard-rock mine constructed in the territory in a decade. Sherwood was founded and run by McLeod and later bought by Capstone for $244 million. Minto was built on time and under budget – no small feat in Canada’s North.
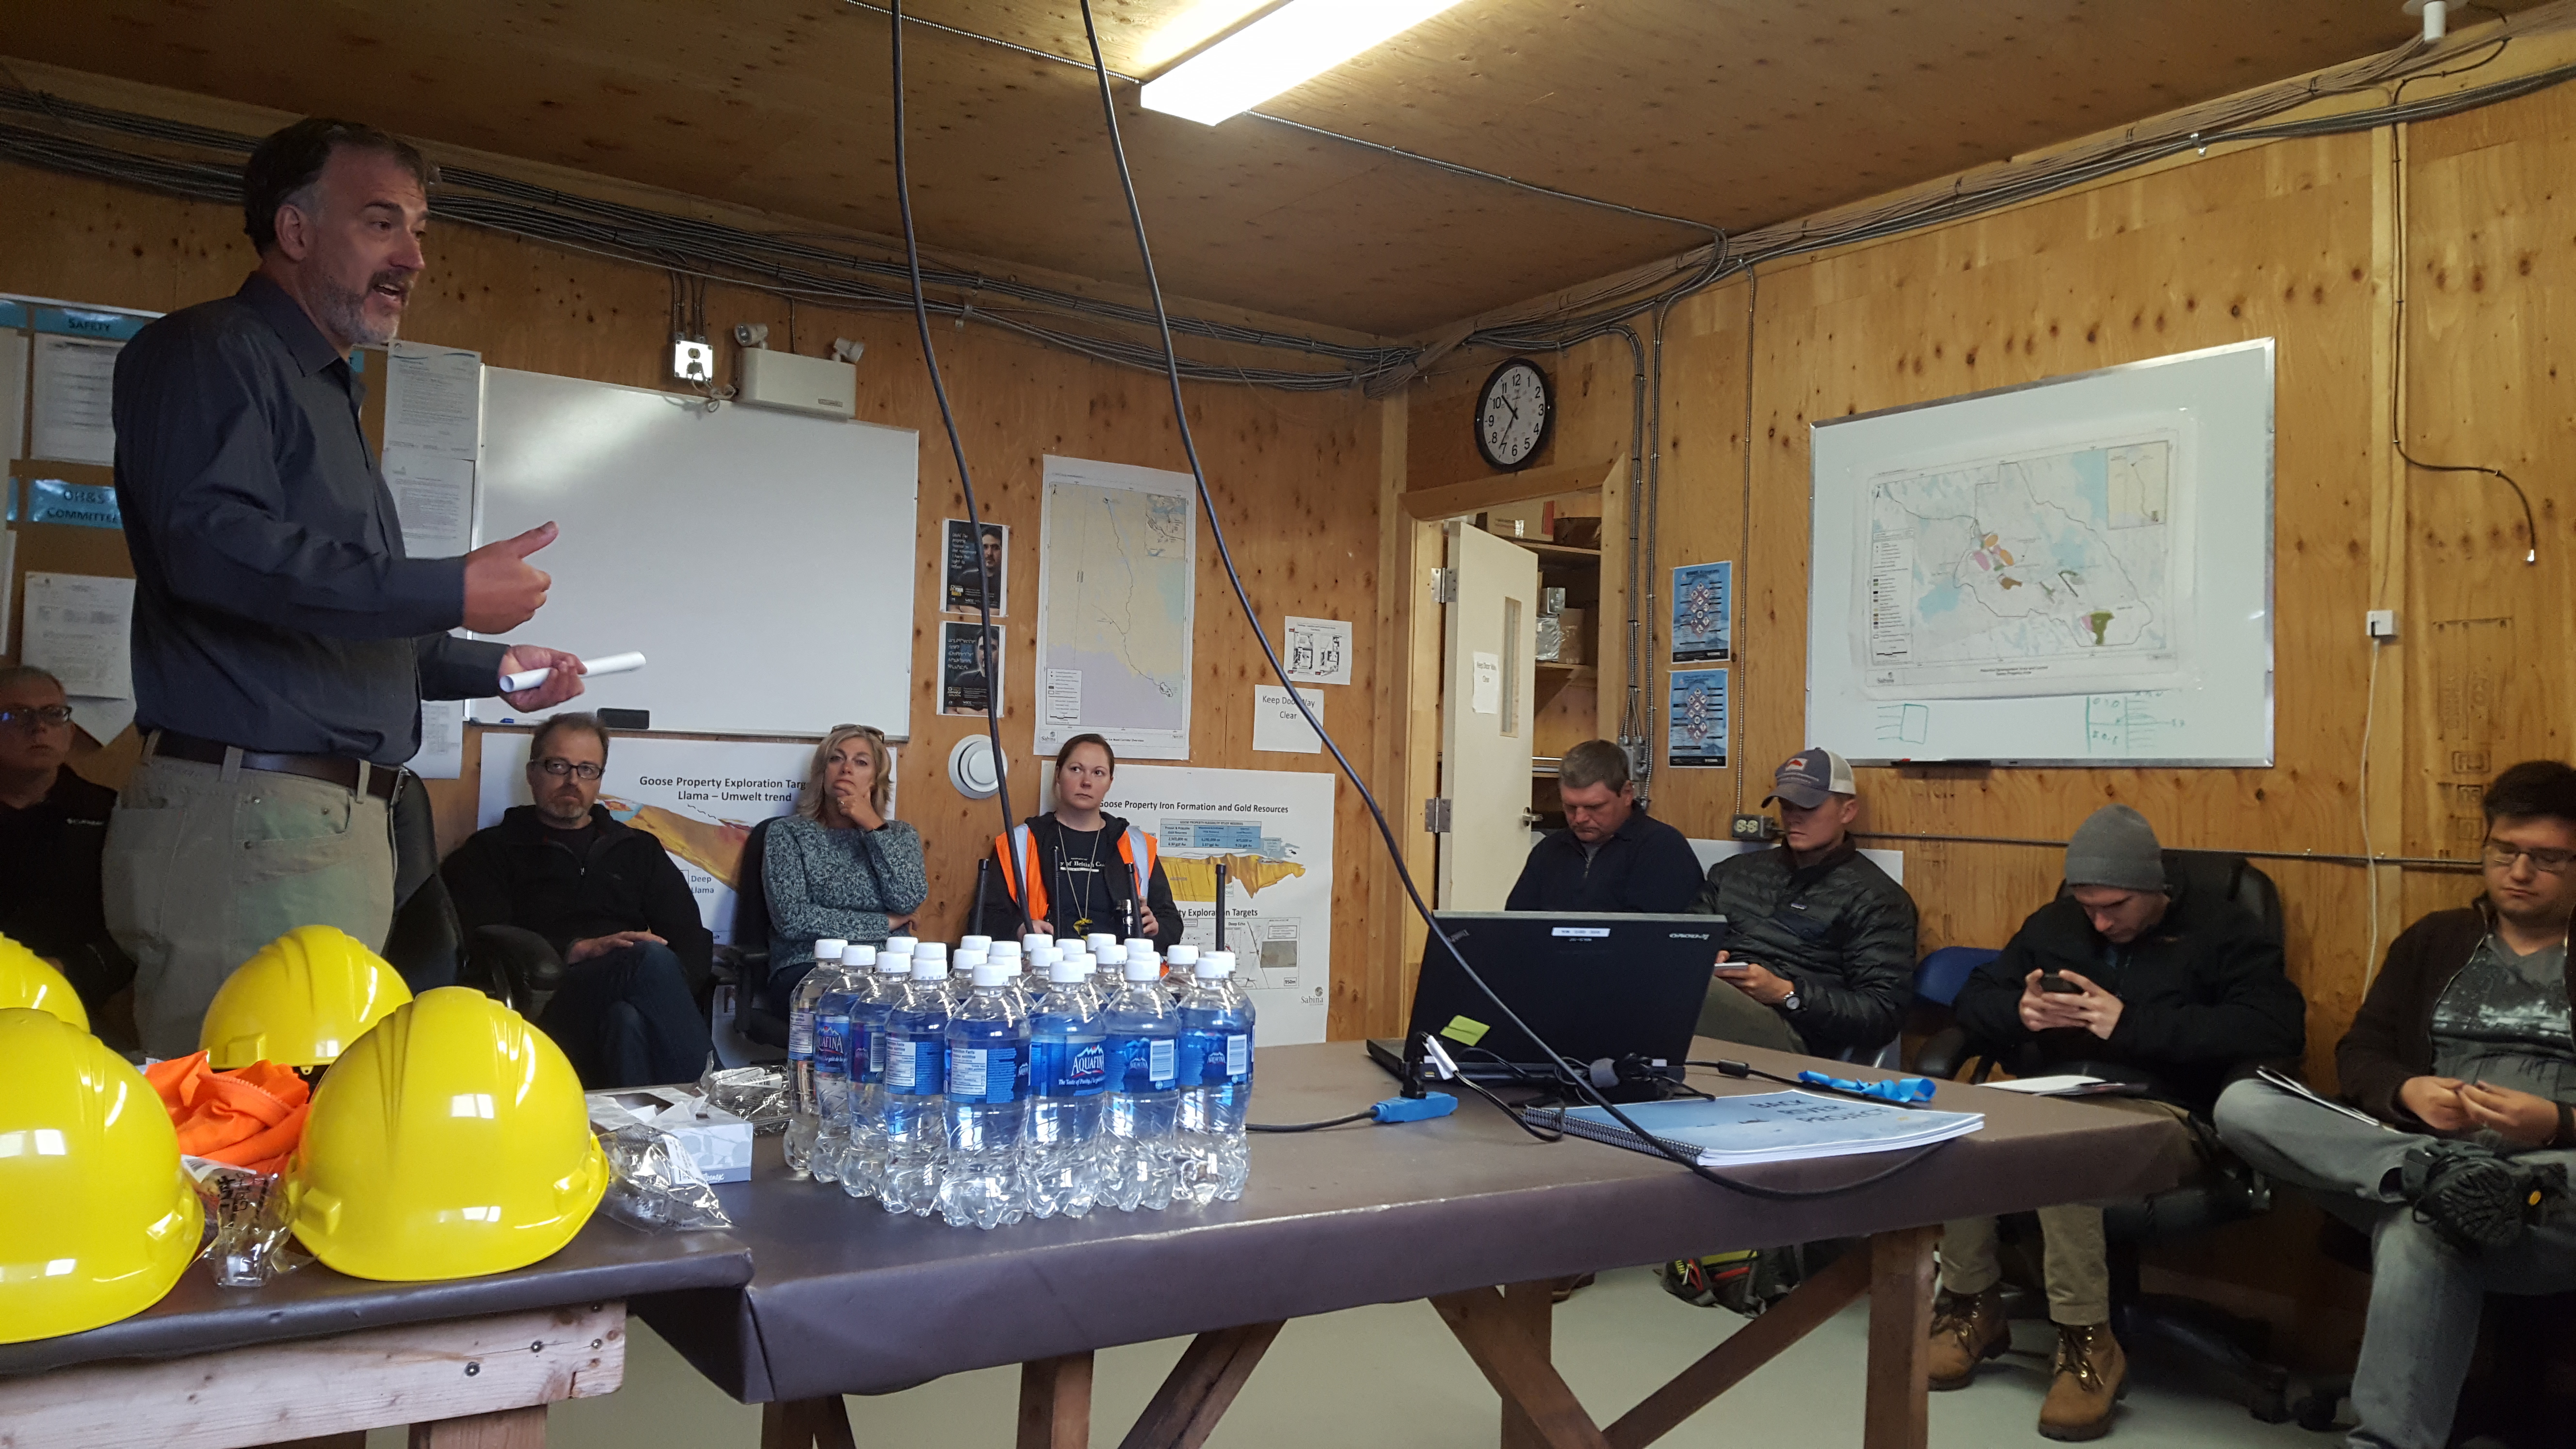
Recent problems experienced by Nunavut neighbour TMAC Resources (TMR-T) at its recently opened Hope Bay gold mine illustrate the importance of “doing it right the first time.” TMAC recently slashed its annual guidance in half – from 100,000 to 120,000 ounces of gold to 50,000 to 60,000 ounces – due to processing issues and recovery problems. Sabina is paying close attention to metallurgy and a potential processing change from whole ore leach to flotation is one of the optimizations Sabina is studying.
BACK TO THE FUTURE
Some background on Back River: Sabina Silver became Sabina Gold & Silver with its 2009 purchase of the high-grade gold project from Dundee Precious Metals (DPM-T). Prior to that, the flagship was the silver-rich Hackett River VMS deposit 45 kilometres to the west, which Sabina sold to Xstrata (now Glencore) in 2011 for $50 million cash and a significant silver royalty. That transaction put Sabina into the rare category of well-funded junior, where it remains. More on the silver royalty later.
Sabina has since added about 5 million ounces, bringing the Back River resource to 7.2 million ounces in all categories. Most of the added ounces were drilled in the first two years, followed by a lull in drilling during the 2011-16 bear market. The most recent drill program has taken the number of metres drilled above 500,000.
The scale of the core-cutting facility at Goose is an indication of the size of previous programs. It can comfortably handle 85,000 metres in a single season, so is not stretched at 10,000 metres, McLeod noted. It may seem like a minor detail, but is another box ticked for any major that buys the district-scale project (Goldcorp, for example, is carrying out an aggressive exploration drill program at Coffee).
The Back River project is a banded iron formation project that consists of 10 high-grade gold deposits on Sabina’s 53,000-hectare properties. It’s an 80-kilometre district. Llama is one of four deposits at the main Goose project area, the focus of the 3KFS that McLeod commissioned. (An earlier FS modelled a 6,000tpd operation producing 350,000 oz over a 10-year mine life.) Three of the four Goose deposits are part of the 3KFS: Goose main pit, Umwelt open pit and underground and the Llama open pit. The Llama underground, including hole 17GSE516B, is not.
ECONOMICS OF EXPLORATION
One of the objectives of Sabina’s drilling is to determine if there are enough high-grade ounces underground to define a “treasure box” that could be mined up front. If the company is successful, that would involve shifting sustaining capex into the front end of the mine plan. But it could significantly improve already strong project economics, especially at the front end of the mine life. An increase of just 500 tonnes per day – to 3,500tpd – could vault Sabina into 300,000 oz/year territory.
Angus Campbell, Sabina’s VP Exploration, shed some light on how rich some of the exploration potential is on Sabina’s ground. Being the guy in charge of running exploration programs in a gold-rich 80-kilometre belt must have a kid-in-a-candy-store feel to it. But with McLeod in charge of the candy allocation, Campbell’s targets must be chosen wisely and justified. Despite 500 kilometres of drilling, there remain multiple opportunities for resource expansion, both at existing deposits and at deposits not included in either Feasibility Study.
Consider Sabina’s George deposits, about 50 kilometres away from Goose. George hosts about 2.1 million gold ounces included in the 6KFS but NOT in the 3KFS. Drilling there in the 1980s, outside the resource envelope, also hit several wide, shallow intersections of 6 and 7 g/t Au, McLeod said – rich ore by any standard. Sabina geologists were puzzled why these near-surface intercepts were not followed up at the time.
The answer, from people directly involved in the drill programs: the predecessor company was looking for higher Lupin-like grades of 9 and 10 g/t material. The nearby Lupin mine produced about 3.35 million ounces of gold between 1982 and 2004 at an average head grade of 9.27 g/t.
Under the 6,000tpd plan, George ore was slated to be trucked to the mill at Goose. But McLeod believes George is destined to become a second standalone mine once Goose is put into production. It’s a strategy both Agnico Eagle (Amaruq) and TMAC Resources (Boston) are following with their multi-deposit Nunavut gold districts.
EXPLORING A VAULT
The greatest upside potential, however, is probably where Sabina is drilling now – at the Llama extension and the Umwelt Vault zone. Particularly the latter. Vault assays are outstanding from the summer drill program, which included about 4,000 metres of Vault drilling. A spring hole there hinted at the richness, returning 16.86 g/t gold over 13.5 metres, including 27.11 g/t over 7.95 metres.

The Vault targeting is follow-up from rich 2011-12 intercepts, including 17 metres of 49.24 g/t Au. For perspective, that grade is roughly equal to GT Gold’s (GTT-V) recent intercept that helped send that Golden Triangle focused play to a $200 million market cap briefly (Sabina’s market cap is $517 million. Except Sabina’s 2012 hole was 17 metres, compared to 6.95 metres for GTT. I asked VP Ex Angus Campbell why the rich hits weren’t followed up on at the time – he said the focus then was on building open-pit ounces.
On the infrastructure and development front, Sabina plans to truck supplies to the mine via a 157-km winter road built every year at a cost of $8 million. The CEO described it as a “fairly simple” road, logistically. Sabina will have about 45 days to truck supplies from the marine laydown area, in southern Bathurst Inlet, to the Goose camp.
Sabina is not banking on it, but a Northern road plan that has been decades in the making could also intervene to lower costs for the project. That’s the Grays Bay port and road initiative, a plan for an all-season 230-km road from a deep-water Arctic port that connects to the Yellowknife winter road. With the buy-in of the Kitikmeot Inuit Association, which also strongly supports Back River, this iteration of the plan looks closer to reality than it has for some time. The road would be closer to the George deposit than Goose, but could result in significant savings.
THE PATH FORWARD
Resource Opportunities initiated coverage on Sabina Gold & Silver on May 18, 2015, during the bear market. The catalyst for coverage was McLeod’s hiring. When I met him and Sabina’s VP Communications Nicole Hoeller in a Vancouver coffee shop, McLeod gave me a taste of his tenacity: “My philosophy is like the Italian rule of driving: you rip the rear-view mirror off, put your foot on the gas and it doesn’t really matter what’s behind you but you’re moving forward … You’re not going to let your foot off the gas.” The line implies recklessness, but it’s more about a single-minded focus on advancing projects.
McLeod could not have foreseen the dark days of summer 2016, but the philosophy served him well during that period. That’s when the Nunavut Impact Review Board (NIRB) recommended to the federal government the rejection of the Back River project as currently constituted, despite widespread Inuit and community support. The reasons given were concern over caribou and climate change implications. Ottawa flipped the tables, rejecting the NIRB’s conclusions and ordering the regulatory agency to re-examine its findings. That resulted in a positive recommendation. A final ruling from the federal government is expected before year-end.

The number of high-quality gold discoveries in recent years has dropped along with the exploration budgets of the majors. Ore grades have steadily fallen and the miners are more reliant than ever on junior exploration companies to fill the supply gap. There are precious few district-scale, high-grade gold projects in safe jurisdictions. Sabina’s Back River fits the bill and has no fatal flaws. I expect Sabina to be acquired by a large gold mining company, at prices well above the current levels. In a rising gold price environment – not a given, a bidding war could well be the outcome.
CONCLUSIONS
I have described Sabina previously in the newsletter as a kind of triple leverage play, and it still holds true. The shares were at bear market levels of 39 cents when I initiated coverage, and Sabina had 194 million shares outstanding. Importantly, the share count has risen only 30 million since then as the stock has increased sixfold.
That’s in the rear-view mirror, of course, and the key question is what kind of upside exists from current levels. Gold is showing weakness again, following an increase through US$1,300/oz and rapid rise to $1,350. But I expect the precious metal to resume its rise in an easy-money world, and Sabina’s 7.2 million ounces make the company’s shares an ideal vehicle for exposure to gold. I have added to my position at levels above the current share price. The following factors give Sabina multibagger potential from these levels, and tremendous leverage:
1) Exploration – Drill plays have been getting much of the love in recent months. GT Gold Corp and other plays focused on British Columbia’s Golden Triangle plays have been leading the charge, but there have been others. The junior market’s enthusiasm for drill plays and ambivalence towards development plays reminds me of the Benjamin Graham quote: “In the short run, the market is a voting machine but in the long run it is a weighing machine.” Sabina’s recent drill results compare favourably with many drill plays that have added tens of millions of dollars of market cap on favourable assays. In Sabina’s case, the assays are overlain on a very high-grade, FS-stage gold project and potentially have a direct favourable impact on project economics. Votes come and go but the weight remains.
2) Takeover premium. Recent takeover premiums in the gold space have been at healthy premiums (see below). In Sabina’s case, the strength of the project means the premium should at least match the highest-ranking, Integra at about 50%. That offer came from a major (Eldorado Gold) that already owned about 13% of Integra shares. Sabina has no such partner, one of the reasons a bidding war is quite possible. Dundee Precious Metals and Sun Valley Gold are the largest shareholders, each with just above 10%. Here are the takeover premiums a few of the more recent takeovers. The premium to the last close is first, followed by the premium to the 20-day volume-weighted average share price:
- Eldorado – Integra Gold ($590 million): 46%, 52% (gold at US$1,233/oz)
- Kirkland Lake Gold – Newmarket Gold ($1 billion): 9.4%, 23% (US$1,318/oz)
- Goldcorp – Kaminak Gold ($520 million): 33%, 40% (US$1,279/oz).
3) Silver royalty: Sabina retained a valuable royalty when it sold the prior flagship project, the Hackett River polymetallic deposit, to Xstrata (now Glencore). It’s a 22.5% royalty on the first 190 million ounces of silver produced, and 12.5% on the remainder. Hackett River is one of the world’s largest undeveloped VMS deposits and the main price is zinc. Zinc has soared from below US70 cents/lb in January 2016 to about $1.40 today. The royalty was previously assigned a value of $300 million by analysts, and McLeod contends it would trade at a valuation of $300-$400 million in the portfolio of a larger royalty company such as Wheaton Precious Metals or Royal Gold. The silver royalty gets little to no value in Sabina’s portfolio.
Suitors? It’s a long list. Goldcorp has telegraphed its intention to only acquire district-scale projects, and Back River fits the bill. The project is superior on almost every level – grade, size, scalability – to Kaminak’s Coffee project and Goldcorp spent $520 million to purchase that operation. This is pure speculation, but I bet B2Gold CEO Clive Johnson would also love to open a high-grade gold mine in Canada to go with operations in more exciting jurisdictions that include Mali, the Philippines and Burkina Faso.
Management is the single most important ingredient in the junior mining sector, and Sabina’s is impressive. When he took over as CEO, McLeod refocused the company, trimming some fat and beefing up insider skin in the game. Under his stewardship, Sabina has smartly increased the quality of the gold ounces while controlling the share structure. I was impressed during the site visit by both VP Ex Angus Campbell and Exploration Manager James Maxwell.
Finally, a small detail. Sometimes, they tell a tale. There was no swag on the site visit – company shirts, ball caps, pens, etc – and clearly cost considerations were front and centre for Sabina. I’ve seen lots of swag from plenty of lesser projects in my travels. As a shareholder, seeing that kind of focus on the lesser details reassured me that Sabina will pay close attention on the big details, too – such as a fair takeout price.
Sabina Gold & Silver (SBB-T)
Price: $2.31
Shares outstanding: 224 million (243M f-d)
Treasury: $36.6 million (as of June 30, not including financing proceeds)
Market cap: $517.4 million
Disclosure: I own shares of Sabina Gold & Silver and the company paid for costs associated with the site visit. Readers are advised that the material contained herein is solely for information purposes. Readers are encouraged to conduct their own research and due diligence, and/or obtain professional advice. Nothing contained herein constitutes a representation by the publisher, nor a solicitation for the purchase or sale of securities. The information contained herein is based on sources which the publisher believes to be reliable, but is not guaranteed to be accurate, and does not purport to be a complete statement or summary of the available data. Any opinions expressed are subject to change without notice. The author and their associates are not responsible for errors or omissions. They may from time to time have a position in the securities of the companies mentioned herein, and may change their positions without notice. (Any positions will be disclosed explicitly.)
On April 18, 2017, Camino Minerals Corp. (TSX-V: COR) released drill results from its copper exploration project, Los Chapitos in Peru. The company intersected in hole CHR-002 1.30 per cent copper over 106 metres, with the hole ending in mineralization, including a section of 2.12 per cent copper over 38 m and hole CHR-001 intersected 0.47 per cent copper over 76 m, including 0.67 per cent copper over 22 m. These results put the company on the radar as a company to watch. On August 25th, John Kaiser of Kaiser Research Online appeared on the Discovery Watch to discuss Camino’s results, its market activity and future prospects.

According to Kaiser, there were good results but as he studied the data it became apparent to him and the company that there was a magnetic anomaly next to hole CHR-002 which suggested there might be a sulphide body at a 200-metre depth. Combined with the data that hole CHR-002 ended in mineralization, the hope was that once they get into the sulphide body that there would be high tonnage and high grade copper in this anomaly. The next phase of drilling was designed to target this anomaly with drill hole DCH-012 (hole 12).
The results drove the company’s share price to an intraday high of $2.21 settling at $1.24 by the end of the day. However, since then the stock has retreated to 47 cents at time of publication, largely in part because the company did not find what it thought was there.

On Aug. 28, the company released results from the Adriana and Katty zones on the los Chapitos project, that included hole 12. Kaiser said that the results were not what the company was expecting. Hole 12 was great until it hit the anomaly; the mineralization very quickly faded out and the company’s theory did not pan out. As a result, the company is choosing not to use IP anomalies as a targeting-tool on this project. Nonetheless, Kaiser and the company are still optimistic about the results and the project.
The company reported drill highlights for the Adriana zone from DCH-012 which intersected 0.93 per cent copper over 96.5 metres, including 2.03 per cent copper over 19.5 m and 5.01 per cent copper over 4.5 m and which DCH-019 intersected 0.97 per cent copper over 42.0 m, including 3.31 per cent copper over 7.5 m. Some drill highlights from the Katty zone included DCH-010 which intersected 0.70 per cent copper over 43.5 m, including 1.85 per cent copper over 5.6 m and DCH-014 which intersected 1.20 per cent copper over 21.4 m, including 2.70 per cent copper over 7.9 m. It is early in the exploration program and the company has plenty of work coming up.
Kaiser believes it is a still interesting project without the sulphide anomaly. The company has about 8,000 to 10,000 metres of drilling planned at the Adriana Zone plus another 2,000 to 3,000 metres at the Katty Zone. Over the next two to three months as the company drills this trend, they will put together a resource estimate. He feels it may not be that great unless they hit something different from the current trend. In addition, the company is applying for permitting at the Atajo zone.
When Kaiser asked Ken McNaughton, President of Camino, why the company is moving forward so aggressively, McNaughton replied because they are seeing copper in all of the core. Kaiser concludes that Camino results were not as spectacular as he had hoped but the company has the cash and is marching in the right direction.
Source: http://www.howestreet.com/2017/08/25/can-inzinc-get-back-in-sync/
***The author does not own any shares in Camino and provided this report for information purposes. The author was not compensated for this article.
According to Metals Economics Group’s (MEG) Corporate Exploration Strategies, the estimated total 2011 budget for nonferrous metals exploration surged to $18.2 billion. Despite increased volatility in recent months, metals prices—the primary driver of exploration spending—have remained relatively strong in 2011, giving confidence to the industry; as a result, exploration budgets increased by $6.1 billion, up 50% from 2010 to set a new all-time high. Nonferrous exploration refers to expenditures related to precious and base metals, diamonds, uranium, and some industrial minerals; it specifically excludes iron ore, aluminum, coal, and oil and gas.

Most countries are seeing increased exploration investment in 2011, and explorers are demonstrating a higher tolerance for risk despite additional concerns and uncertainty about security, policy, and tenure in many countries. Of the 120 countries for which we documented exploration spending by the industry, those commonly perceived to be high risk account for 23% of the 2011 aggregate exploration total, up from less than 16% in 2010. The potential reward often increases the industry’s appetite for risk during periods of increased exploration spending, but exploration in high-risk countries, particularly early-stage work, is usually the first to be cut when risk levels or uncertainty increases.
The proportion of overall exploration spending dedicated to early-stage and generative work has been fairly stable over the past three years; however, at just a third of overall allocations it is historically low. The decline in grassroots’s share of spending over the past decade correlates with the upward trend in late-stage and minesite budgets, as companies spent more on late-stage projects to move them towards production or to make them attractive for acquisition, and on minesite work as a less expensive and less risky means of replacing and adding reserves. However, the number of large-scale assets advancing to development has not risen proportionately with this increased focus on late-stage projects, contributing to constraints on meaningful production increases for most metals. The apparent decline in grassroots efforts relative to late-stage and minesite exploration over the past cycle and the considerable time needed to advance a new discovery to production mean that the pool of viable, large-scale assets available for actual development is unlikely to grow in the near future.
MEG’s 2011 exploration estimate is based on information collected from almost 3,500 mining and exploration companies worldwide, of which more than 2,400 had exploration budgets in 2011. The 2,400 companies (each budgeting at least $100,000) together budgeted $16.3 billion for nonferrous exploration in 2011. Including estimates for the budgets that MEG could not obtain, the 2011 worldwide exploration budget totals $18.2 billion.
From the report entitled, “Exploration budgets up 50% – surging to new all-time high” by Metals Economics Group. Metals Economics Group (MEG) is a trusted source of global mining information and analysis. With three decades of comprehensive information and analysis, MEG has an unsurpassed level of experience and historical data. The information provided herein has been provided to MiningFeeds.com by the author and, as such, is subject to our disclaimer: CLICK HERE.
If you would like to receive our free newsletter via email, simply enter your email address below & click subscribe.
 Follow us on Twitter
 Become our facebook fan
CONNECT WITH US
Tweets
Tweet with hash tag #miningfeeds or @miningfeeds and your tweets will be displayed across this site.
MOST ACTIVE MINING STOCKS
Daily Gainers
 CMC Metals Ltd. CMC Metals Ltd. |
CMB.V | +900.00% |
 Eden Energy Ltd Eden Energy Ltd |
EDE.AX | +200.00% |
| GoviEx Uranium Inc. |
GXU.V | +42.86% |
| Eagle Nickel Ltd. |
ENL.AX | +41.67% |
| Citigold Corp. Limited |
CTO.AX | +33.33% |
| Mount Burgess Mining NL |
MTB.AX | +33.33% |
| Exalt Resources Limited |
ERD.AX | +31.94% |
| Casa Minerals Inc. |
CASA.V | +30.00% |
| Cariboo Rose Resources Ltd |
CRB.V | +28.57% |
| Belmont Resources Inc. |
BEA.V | +28.57% |


