In recent days the market has moved from expecting a rate cut by January 2020 to now expecting as much as three rate cuts by then. As a result both Gold and gold stocks launched higher, forming a “three white soldiers” bullish reversal pattern.
Last week and in previous writings, we noted the importance of the actual rate cut for Gold and gold stocks. Their performance in both nominal and relative terms usually takes hold after the actual cut.
Now, the question is, is this a rally or a bull market? (There is a difference even though financial media talks about multi-year bull moves as “rallies.”)
The start of a new rate cut cycle hasn’t always produced a bull market in precious metals. For example, after the rate cuts in 1989 and 1995 Gold rallied by only 12% and 18%. Fortunately for us bulls, the current context is totally different but I digress.
The stock market will answer the question.
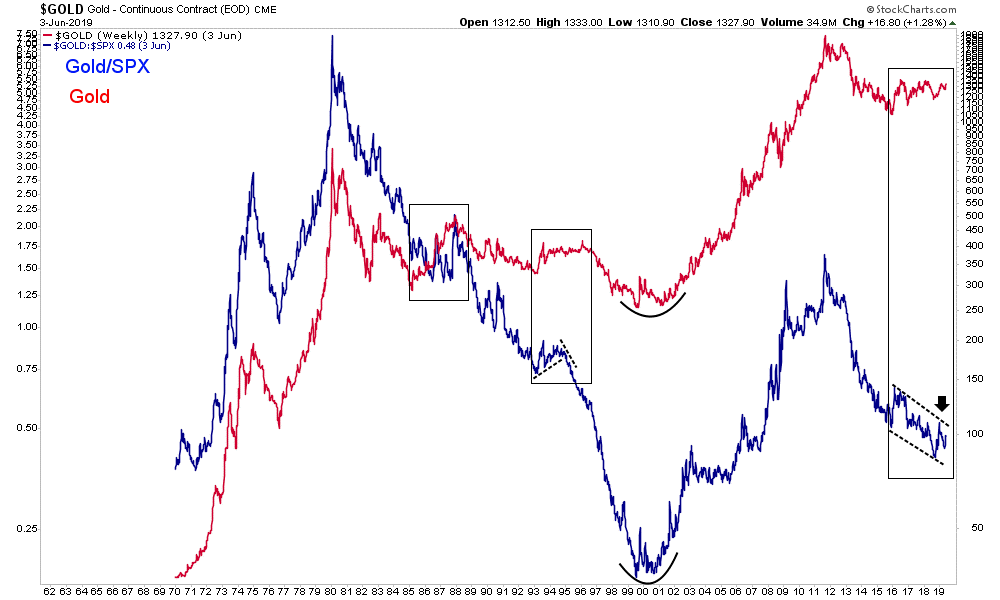
There has never been a real bull market in precious metals without Gold outperforming the stock market (excluding the 1985-1987 period during a 50% decline in the US Dollar).
The chart below plots Gold (red) and Gold against the stock market (blue).
As you can see, during the 1970s and 2000s, the Gold/S&P 500 ratio rose alongside Gold. That wasn’t the case in the mid 1980s, the mid 1990s and the past few years.
If the Fed rate cuts and other measures are able to successfully revive the U.S. economy and stock market then Gold isn’t going to receive enough capital inflows to sustain a bull market. On the other hand, if the U.S. economy slips into recession and the stock market experiences a real bear market then Gold should have enough fuel to retest its all time highs.
In the scenario in which the stock market and economy stabilize and recover, Gold can still perform well. Fed rate cuts and the like could push it past $1400/oz and potentially to $1500/oz.
How the Gold/S&P 500 ratio performs will inform us on the sustainability of that move. It will tell us if it’s just a rally or the start of a real bull market.
The gold stocks are nearly as historically cheap and hated as they’ve ever been. They could make quite a run on a clean breakout in Gold through the wall of resistance at $1375/oz, which we think is more likely than not. To learn what stocks we own and intend to buy that have 3x to 5x potential, consider learning more about our premium service.
Jordan Roy-Byrne CMT, MFTA
June 7, 2019
The widely-held mega-cap stocks that dominate the U.S. markets recently finished reporting their Q4 2018 financial results. Because the tenor of stock markets changed radically last quarter, this latest earnings season is more important than usual. An extreme monster bull market suddenly rolled over into a severe near-bear correction in Q4. How major corporations fared offers insights into whether a young bear is upon us.
Four times a year publicly-traded companies release treasure troves of valuable information in the form of quarterly reports. Required by the U.S. Securities and Exchange Commission, these 10-Qs and 10-Ks contain the best fundamental data available to traders. They dispel all the sentiment distortions inevitably surrounding prevailing stock-price levels, revealing corporations’ underlying hard fundamental realities.
While 10-Qs with filing deadlines of 40 days after quarter-ends are required for normal quarters, 10-K annual reports are instead mandated after quarters ending fiscal years. Most big companies logically run their accounting on calendar years, so they issue 10-Ks after Q4s. Since these annual reports are larger and must be audited by independent CPAs, their filing deadlines are extended to 60 days after quarter-ends.
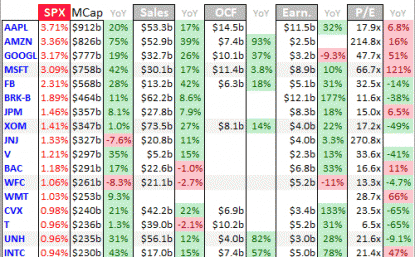
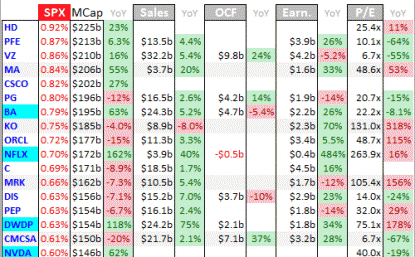
So the 10-K filing season just wrapped up last Friday, revealing how the biggest and best U.S. companies were doing in Q4 2018. They are the stocks of the flagship S&P 500 stock index (SPX). At the end of Q4 they commanded a gigantic collective market capitalization of $22.2t! The vast majority of investors own the big U.S. stocks of the SPX, as some combination of them are usually the top holdings of nearly every fund.
The major ETFs that track the S&P 500 dominate the increasingly-popular passive-investment strategies as well. The SPY SPDR S&P 500 ETF, IVV iShares Core S&P 500 ETF, and VOO Vanguard S&P 500 ETF are among the largest in the world. This past week they reported colossal net assets running $262.4b, $160.5b, and $103.2b respectively! Overall stock-market fortunes are totally dependent on big U.S. stocks.
Q4 2018 proved extraordinary. Leading into it, the SPX hit a dazzling all-time record high in late September about a week before Q4 arrived. That extended an extreme monster stock bull to 333.2% gains over 9.5 years, the 2nd-largest and 1st-longest in all of U.S. stock-market history! But as I warned days after that euphoric peaking, the Fed’s unprecedented quantitative-tightening campaign would finally ramp to full speed in Q4.
Stock markets artificially inflated by $3625b of Fed QE over 6.7 years couldn’t react well to Fed QT finally starting to unwind that epic monetary inflation. With QT hitting $50b per month starting in Q4, the stock markets indeed wilted. Over the next 3.1 months into Christmas Eve, the SPX plummeted 19.8%! That was right on the verge of a new bear market at -20%. The SPX suffered its worst December since 1931, -9.2%.
That sure looked like a young bear market, really freaking out traders. But since those deep and ominous lows, the SPX has soared 19.3% at best in a massive rally! That has reversed nearly 4/5ths of the total correction losses largely suffered in Q4. This looked and acted like a classic bear-market rally, rocketing higher to eradicate fear and restore universal complacency. New-bear worries have shriveled to nothing.
Given Q4 2018’s colossal stock-market inflection and subsequent huge rebound, whether the SPX narrowly evaded the overdue-bear bullet or not is supremely important. Bear markets exist for one reason, to maul overvalued stocks back down below historic fair-value levels. So how the major U.S. corporations actually fared last quarter, how large their earnings were compared to their stock prices, offers essential bull-bear clues.
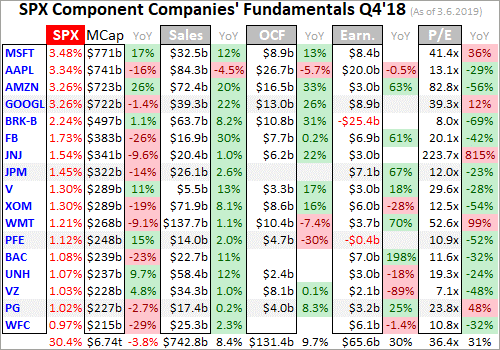
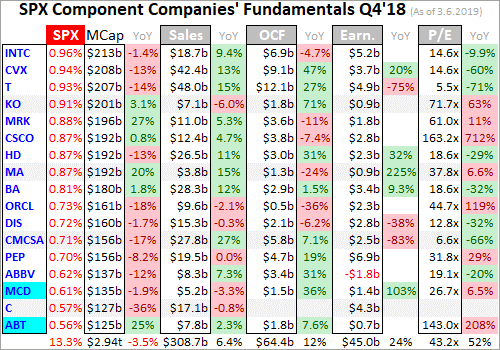
Every quarter I analyze the top 34 SPX/SPY component stocks ranked by market cap. This is just an arbitrary number that fits neatly into the tables below, but is a dominant sample of the SPX. At the end of Q4, these American giants alone commanded fully 43.7% of the SPX’s total weight! Their $9.7t collective market cap exceeded that of the bottom 437 SPX companies. Big U.S. stocks’ importance cannot be overstated.
I wade through the 10-K or 10-Q SEC filings of these top SPX companies for a ton of fundamental data I dump into a spreadsheet for analysis. The highlights make it into these tables below. They start with each company’s symbol, weighting in the SPX and SPY, and market cap as of the final trading day of Q4 2018. That’s followed by the year-over-year change in each company’s market capitalization, a key metric.
Major U.S. corporations have been engaged in a wildly-unprecedented stock-buyback binge ever since the Fed forced interest rates to deep artificial lows during 2008’s stock panic. Thus the appreciation in their share prices also reflects shrinking shares outstanding. Looking at market-cap changes instead of just underlying share-price changes effectively normalizes out stock buybacks, offering purer views of value.
That’s followed by quarterly sales along with their y/y changes. Top-line revenues are one of the best indicators of businesses’ health. While profits can be easily manipulated quarter to quarter by playing with all kinds of accounting estimates, sales are tougher to artificially inflate. Ultimately sales growth is necessary for companies to expand, as bottom-line profits growth driven by cost-cutting is inherently limited.
Operating cash flows are also important, showing how much capital companies’ businesses are actually generating. Using cash to make more cash is a core tenet of capitalism. Unfortunately many companies are now obscuring quarterly OCFs by reporting them in year-to-date terms, lumping in multiple quarters together. So the Q4 2018 OCFs shown are mostly calculated by subtracting Q3’18 YTD OCFs from full-year ones.
Next are the actual hard quarterly earnings that must be reported to the SEC under Generally Accepted Accounting Principles. Lamentably companies now tend to use fake pro-forma earnings to downplay real GAAP results. These are derided as EBS profits, Everything but the Bad Stuff! Certain expenses are simply ignored on a pro-forma basis to artificially inflate reported corporate profits, often misleading traders.
While we’re also collecting the earnings-per-share data Wall Street loves, it’s more important to consider total profits. Stock buybacks are executed to manipulate EPS higher, because the shares-outstanding denominator of its calculation shrinks as shares are repurchased. Raw profits are a cleaner measure, again effectively neutralizing the impacts of stock buybacks. They better reflect underlying business performance.
Finally the trailing-twelve-month price-to-earnings ratios as of the end of Q4 2018 are noted. TTM P/Es look at the last four reported quarters of actual GAAP profits compared to prevailing stock prices. They are the gold-standard metric for valuations. Wall Street often intentionally conceals these hard P/Es by using the fictional forward P/Es instead, which are literally mere guesses about future profits that often prove far too optimistic.
These are mostly calendar-Q4 results, but some big U.S. stocks use fiscal quarters offset from normal ones. Walmart, Home Depot, and Cisco have quarters ending one month after calendar ones, so their results here are current to the end of January instead of December. Oracle uses quarters that end one month before calendar ones, so its results are as of the end of November. Offset reporting ought to be banned.
Reporting on offset quarters renders companies’ results way less comparable with the vast majority that report on calendar quarters. We traders all naturally think in calendar-quarter terms too. Decades ago there were valid business reasons to run on offset fiscal quarters. But today’s sophisticated accounting systems that are largely automated running in real-time eliminate all excuses for not reporting normally.
Stocks with symbols highlighted in blue have newly climbed into the ranks of the SPX’s top 34 companies over the past year, as investors bid up their stock prices and thus market caps relative to their peers. Overall the big U.S. stocks’ Q4 2018 results looked impressive, with good sales and profits growth. But that masks a sharp slowdown from prior quarters that will be exacerbated as the corporate-tax-cut transition year ends.
2018 was a banner year for corporate earnings because of Republicans’ massive corporate tax cuts. The Tax Cuts and Jobs Act was signed into law on December 22nd, 2017 to go into effect on January 1st, 2018. Its centerpiece was slashing the U.S. corporate tax rate from 35% to 21%, which naturally boosted reported profits. But 2018’s four quarters were the only ones that would experience anomalous TCJA growth.
Q4 2018 was the last quarter comparing year-over-year growth between a pre-TCJA quarter and post-TCJA quarter. That major discontinuity distorted corporate-earnings growth. Profits soared last year not just because companies were doing better, but because they were paying taxes at much-lower rates. But starting in Q1 2019, that TCJA-transition boost is gone forever. Normal same-tax-regime y/y comparisons will return.
But before we get to all-important corporate earnings and resulting valuations, let’s work our way through these tables. Thanks to the SPX’s brutal 14.0% plunge in Q4, this leading broad-market stock index lost 6.2% last year. The biggest and best US companies fared a little better, with the collective market cap of the top 34 sliding 5.2% y/y. These elite corporations had average market-cap losses running 3.6% y/y.
That certainly isn’t calamitous, but the deceleration is neck-snapping! In the prior four quarters starting in Q4 2017, the SPX’s top 34 components saw enormous average YoY market-cap gains of 29.2%, 14.6%, 23.5%, and 24.2%. Make no mistake, Q4’18 saw a massive and ominous stock-market inflection. The severe near-bear correction’s selling pressure was even heavier in smaller SPX stocks below the top 34.
That pushed the top 34’s share of the SPX’s total weighting to 43.7%, a big increase from Q4 2017’s 41.8%. The more capital concentrated in fewer stocks, the riskier the entire stock markets become. Big down days driven by company-specific news in highly-weighted individual stocks can drag down the entire stock markets. A great example occurred in mighty Apple just after Q4 ended, when it warned on weak Q4 sales.
For years Apple had been the largest U.S. stock by market cap, commanding the highest ranking in the SPX and SPY. Just after 2019’s first trading day closed, Apple cut its Q4 revenue guidance by 7.7% from its own midpoint given 2 months earlier. The next day AAPL stock collapsed by 10.0%, which pummeled the entire SPX 2.5% lower in its worst loss so far this year. When a top U.S. stock sneezes, markets catch a cold.
Falling stock markets exert a strong negative wealth effect. Both consumers and corporations get scared as stocks suffer big and fast drops, so they pull in their horns on spending. That left all kinds of economic data covering parts of Q4 weaker than expected, sometimes shockingly so. Lower spending weighs on corporate revenues, as fewer people buy less goods and services. Would the top 34’s Q4 2018 sales reflect this?
On the surface these biggest-and-best U.S. companies looked immune. Their total Q4 sales of $1051.6b still climbed an impressive 4.2% YoY in the stock markets’ worst quarter since Q3 2011. These companies averaged big sales growth of 7.4% y/y, which was surprisingly robust given the stock-market carnage. Yet even that good top-line growth still reflects a major slowdown for the top 34 from the past year’s pace.
In the preceding four quarters, the SPX’s top 34 component stocks averaged y/y revenues growth way up at 10.8%, 14.0%, 14.0%, and 11.5%. So Q4’s was a serious deceleration, which may be an ominous portent for 2019. Q4’s revenues growth may be overstated too. Nearly 2/3rds of the SPX’s spending-sapping Q4 plunge came in December alone, after much of the surge in holiday shopping was already over.
If big U.S. companies’ sales growth continues slowing or even starts shrinking in 2019, corporate-profits growth will collapse. While Q1 2019’s earnings season doesn’t start for another 5 weeks or so, plenty of companies have warned that they see revenues slowing much more than Wall Street expected. If Q4 2018 was indeed a major stock-market trend change from bull to bear, corporate results will continue deteriorating.
The mega-cap companies dominating the SPX and American investors’ portfolios also enjoyed strong operating-cash-flow-generation growth in Q4. Their collective OCFs surged 11.5% y/y to $195.8b. Individual companies enjoyed average OCF gains of 10.8% y/y. That looks great on the surface, but just like sales it represents a sharp slowdown from huge y/y OCF growth seen in the prior four quarters.
Starting in Q4 2017 the SPX top 34’s operating cash flows averaged growth of 17.0%, 52.5%, 30.3%, and 20.6% YoY. So Q4’18’s still-strong OCF growth actually decelerated by almost 2/3rds from the precedent of the prior year. That was the prevailing theme of Q4’18 results, good numbers but already slowing fast from the rest of 2018’s even though last quarter had easy annual comparisons across those corporate tax cuts.
Actual corporate profits among these elite U.S. companies are critical to prevailing valuations. The price-to-earnings ratio is the classic measure of how expensive stock prices are. It simply divides companies’ current stock prices by their total earnings per share over the last four reported quarters. So profits are really the only corporate results that matter for valuations, making their growth trends the most important of all.
Interestingly the top 34 SPX components’ total GAAP profits actually shrunk 1.4% y/y to $110.6b in Q4! That doesn’t make sense given their total revenues growth of 4.2%, which earnings should’ve amplified. But a couple big factors played into that surprising decline. After the Tax Cuts and Jobs Act was passed near the end of 2017, companies had to make huge adjustments to overpaid or underpaid taxes on their books.
These are called deferred tax assets and liabilities, which would suddenly be valued very differently under the new corporate-tax rules. So as I analyzed last year, the top 34 SPX companies ran a staggering $209.2b of TCJA adjustments through their earnings in Q4’17! Thus that earlier comparable quarter to Q4 2018 was a mess in GAAP-earnings terms. Q4 2017 was probably the most-distorted quarter in SPX history.
But with about half those one-time TCJA adjustments resulting in profits gains and half in losses, the net impact to overall SPX-top-34 earnings in Q4 2017 was essentially a wash at +$2.7b. That merely boosted overall Q4 2017 profits by 2.5%. A far-more-important factor in Q4’18’s YoY earnings decline came from a single company, Warren Buffett’s Berkshire Hathaway. It was the 5th-largest SPX component as 2018 ended.
BRK suffered a catastrophic $25.4b GAAP loss last quarter! That was almost entirely due to the sharp stock-market decline, which hammered Berkshire’s gigantic investment portfolio lower. It suffered $27.6b of non-cash losses that now have to be run through quarterly earnings. A new accounting rule now requires that unrealized capital gains and losses must be flushed through the bottom line, really irritating Buffett.
In BRK’s 2018 annual report he wrote “As I emphasized in the 2017 annual report, neither Berkshire’s Vice Chairman, Charlie Munger, nor I believe that rule to be sensible. Rather, both of us have consistently thought that at Berkshire this mark-to-market change would produce what I described as “wild and capricious swings in our bottom line.” … Wide swings in our quarterly GAAP earnings will inevitably continue.”
“That’s because our huge equity portfolio – valued at nearly $173 billion at the end of 2018 – will often experience one-day price fluctuations of $2 billion or more, all of which the new rule says must be dropped immediately to our bottom line. … Our advice? Focus on operating earnings, paying little attention to gains or losses of any variety.” Berkshire’s operating earnings were $5.7b in Q4’18, soaring 71.4% y/y!
If BRK’s epic unrealized capital loss is ignored, total SPX-top-34 earnings would’ve surged 23.2% y/y in Q4 2018. On average these top 34 SPX companies reporting profits in both Q4 2017 and Q4 2018 averaged similar 27.8% y/y gains. But the same sharp-deceleration story seen in revenues and OCFs also applies here. The previous four quarters saw far-stronger average growth of 137.0%, 45.9%, 44.5%, and 53.8% y/y!
The massive swings in Berkshire’s enormous investment portfolio are going to distort overall corporate profits in all future quarters with significant SPX gains or losses. We’ll have to watch that going forward, and adjust for it if necessary. But overall corporate profits will be much cleaner in coming years with the TCJA transition year of 2018 behind us. Apples-to-apples comparisons will once again become the norm.
The major slowdown in big U.S. companies’ revenues, operating cash flows, and earnings growth in Q4 2018 is certainly ominous. Especially since the majority of the SPX’s plunge last quarter came relatively late in December. But the most-important thing for attempting to divine whether that monster bull remains alive and well having merely suffered a severe correction, or a young bear is underway, is how valuations look.
These top 34 SPX companies that earned GAAP profits over the past four quarters averaged trailing-twelve-month price-to-earnings ratios way up at 39.7x as Q4 ended! That’s 29.4% above Q4 2017’s average a year earlier, and well into dangerous bubble territory. Over the past century-and-a-quarter or so, U.S. stock markets have averaged 14x earnings which is fair value. Twice that at 28x is where bubble territory begins.
Despite remaining scary-high, big U.S. companies’ average valuations did moderate considerably in Q4. The prior four quarters saw the SPX top 34’s average TTM P/Es run 30.6x, 46.0x, 53.4x, and 49.0x. So the severe near-bear correction definitely did some real work in mauling valuations down. And the P/Es in these tables are as of the end of Q4, which of course didn’t yet reflect the solid y/y growth in Q4 earnings.
By the end of February the top 34 SPX companies’ average TTM P/Es had further dropped to 26.4x, still very expensive but no longer bubble levels. That includes these Q4 results and is even despite the SPX’s powerful rebound rally out of late December’s near-bear lows. So the situation today is nowhere near as dire as at the end of Q4’18 on the valuation front. But that doesn’t mean stock markets are out of the woods.
Bear markets exist because stocks get too expensive leading into the ends of preceding bulls. At 14x fair value it takes 14 years for a company to earn back the price investors are paying for it. The reciprocal of that is a 7.1% return, which is mutually beneficial for both investors with surplus capital and companies that need it. Once extreme bubble valuations birth bear markets, they don’t hibernate until stocks are cheap.
Throughout all of 2018 the U.S. stock markets were trading at extreme bubble valuations. Then in Q4 that severe 19.8% correction hammered the SPX to the verge of formal bear territory. The rebound since has all the hallmarks of a massive bear-market rally. Wall Street’s oft-cited belief that Q4’s plunge was more than enough to restore balance to these stock markets isn’t credible. Bears don’t stop with stocks still expensive!
Historical bear markets after major bulls nearly always maul prevailing US-stock-market valuations back down to cheap levels at 7x to 10x earnings in TTM P/E terms. With the top U.S. stocks averaging 39.7x as Q4 waned and 26.4x at the end of February, the valuation-mean-reversion work still has a long way to go. It is certainly not safe to assume no bear is coming until the SPX trades under 14x, which is far lower.
The SPX soared 11.1% YTD by the end of February, hitting 2784.5. Merely to get to fair value at 14x earnings, not even overshoot to the downside, the SPX has to fall to 1476.6! That’s another 46.7% under this week’s levels! And if corporate earnings actually start retreating this year, the SPX downside targets will fall proportionally. Big bears are normal and inevitable after big bulls, as I explained in depth in late December.
Nearly a decade of Fed-QE-goosed bull market has left traders forgetting how dangerous bears are. The SPX’s last two bears were a 49.1% decline over 2.6 years ending in October 2002, and a 56.8% plunge in 1.4 years climaxing in a stock panic to a March 2009 low! With the big U.S. stocks sporting extreme bubble valuations all of last year, and still near bubble valuations now, it’s hard to believe we aren’t in a young bear.
If that proves true, investors need to lighten up on their stock-heavy portfolios, or at least put stop losses in place. Cash is king in bear markets, since its buying power grows. Investors who hold cash during a 50% bear market can double their holdings at the bottom by buying back their stocks at half-price. But cash doesn’t appreciate in value like gold, which actually grows wealth during major stock-market bears.
Gold investment demand surges as stock markets weaken, as we got a taste of in December. While the SPX plunged 9.2%, gold rallied 4.9% as investors flocked back. The gold miners’ stocks which leverage gold’s gains fared even better, with their leading index surging 10.7% higher. The last time a major SPX selloff awakened gold in the first half of 2016, it soared 30% higher fueling a massive 182% gold-stock upleg!
Absolutely essential in bear markets is cultivating excellent contrarian intelligence sources. That’s our specialty at Zeal. After decades studying the markets and trading, we really walk the contrarian walk. We buy low when few others will, so we can later sell high when few others can. While Wall Street will deny this likely young stock-market bear all the way down, we will help you both understand it and prosper during it.
We’ve long published acclaimed weekly and monthly newsletters for speculators and investors. They draw on my vast experience, knowledge, wisdom, and ongoing research to explain what’s going on in the markets, why, and how to trade them with specific stocks. As of Q4, we’ve recommended and realized 1076 newsletter stock trades since 2001. Their average annualized realized gain is +16.1%! That’s nearly double the long-term stock-market average. Subscribe today for just $12 per issue!
The bottom line is big U.S. stocks’ Q4 2018 results looked impressive on the surface. Good annual growth in sales, operating cash flows, and even earnings excluding Berkshire’s huge mark-to-market losses appeared to buck Q4’s major stock-market selloff. But these growth rates all suffered sharp decelerations from those seen in preceding quarters, suggesting a slowdown is underway. That’s a real problem for stock markets.
Valuations remain dangerously high, deep into bubble territory at the end of Q4. And even after the Q4 earnings were included by late February, near-bubble valuations persisted. That means the likely bear has barely started its stock-price-mauling work to mean revert expensive valuations. On top of that, 2018’s anomalous corporate-tax-cut-transition growth rates are history. All this will continue to pressure stock prices.
Adam Hamilton, CPA
March 11, 2019
Copyright 2000 – 2019 Zeal LLC (www.ZealLLC.com)
The major silver miners’ stocks have been largely abandoned this year, spiraling to brutal multi-year lows. Such miserable technicals have exacerbated the extreme bearishness plaguing this tiny contrarian sector. While profitable silver mining is challenging at today’s exceedingly-low silver prices, these miners are chugging along. Their recently-reported Q3’18 results show their earnings are ready to soar as silver recovers.
Four times a year publicly-traded companies release treasure troves of valuable information in the form of quarterly reports. Companies trading in the States are required to file 10-Qs with the US Securities and Exchange Commission by 40 calendar days after quarter-ends. Canadian companies have similar requirements at 45 days. In other countries with half-year reporting, many companies still partially report quarterly.
Unfortunately the universe of major silver miners to analyze and invest in is pretty small. Silver mining is a tough business both geologically and economically. Primary silver deposits, those with enough silver to generate over half their revenues when mined, are quite rare. Most of the world’s silver ore formed alongside base metals or gold. Their value usually well outweighs silver’s, relegating it to byproduct status.
The Silver Institute has long been the authority on world silver supply-and-demand trends. It published its latest annual World Silver Survey covering 2017 in mid-April. Last year only 28% of the silver mined around the globe came from primary silver mines! 36% came from primary lead/zinc mines, 23% copper, and 12% gold. That’s nothing new, the silver miners have long produced less than a third of world mined supply.
It’s very challenging to find and develop the scarce silver-heavy deposits supporting primary silver mines. And it’s even harder forging them into primary-silver-mining businesses. Since silver isn’t very valuable, most silver miners need multiple mines in order to generate sufficient cash flows. Traditional major silver miners are increasingly diversifying into gold production at silver’s expense, chasing its superior economics.
So there aren’t many major silver miners left out there, and their purity is shrinking. The definitive list of these companies to analyze comes from the most-popular silver-stock investment vehicle, the SIL Global X Silver Miners ETF. In mid-November at the end of Q3’s earnings season, SIL’s net assets were running 6.6x greater than its next-largest competitor’s. So SIL continues to dominate this tiny niche contrarian sector.
While SIL has its flaws, it’s the closest thing we have to a silver-stock index. As ETF investing continues to eclipse individual-stock picking, SIL inclusion is very important for silver miners. It grants them better access to the vast pools of stock-market capital. Differential SIL-share buying by investors requires this ETF’s managers to buy more shares in its underlying component companies, bidding their stock prices higher.
In mid-November as the silver miners were finishing reporting their Q3’18 results, SIL included 23 “Silver Miners”. Unfortunately the great majority aren’t primary silver miners, most generate well under half their revenues from silver. That’s not necessarily an indictment against SIL’s stock picking, but a reflection of the state of this industry. There aren’t enough significant primary silver miners left to fully flesh out an ETF.
This disappointing reality makes SIL somewhat problematic. The only reason investors would buy SIL is they want silver-stock exposure. But if SIL’s underlying component companies generate just over a third of their sales from silver mining, they aren’t going to be very responsive to silver price moves. And most of that ETF capital intended to go into primary silver miners is instead diverted into byproduct silver miners.
So silver-mining ETFs sucking in capital investors thought they were allocating to real primary silver miners effectively starves them. Their stock prices aren’t bid high enough to attract in more investors, so they can’t issue sufficient new shares to finance big silver-mining expansions. This is exacerbating the silver-as-a-byproduct trend. Only sustained much-higher silver prices for years to come could reverse this.
Silver miners’ woes are really exacerbated by silver’s worst performance in decades. In mid-November silver sunk to a 2.8-year low of $13.99. That naturally dragged down SIL to a similar 2.7-year low. But relative to gold which usually drives it, silver was faring far worse. The Silver/Gold Ratio sunk to 85.9x in mid-November, meaning it took almost 86 ounces of silver to equal the value of a single ounce of gold.
The SGR hadn’t been lower, or silver hadn’t been more undervalued relative to gold, since all the way back in March 1995! That’s pretty much forever from a markets perspective. With silver languishing at an exceedingly-extreme 23.7-year low relative to gold, it’s hard to imagine it doing much worse. So the silver miners are weathering one of the toughest environments they’ve ever seen, which we have to keep in mind.
Every quarter I dig into the latest results from the major silver miners of SIL to get a better understanding of how they and this industry are faring fundamentally. I feed a bunch of data into a big spreadsheet, some of which made it into the table below. It includes key data for the top 17 SIL component companies, an arbitrary number that fits in this table. That’s a commanding sample at 96.9% of SIL’s total weighting!
While most of these top 17 SIL components had reported on Q3’18 by mid-November, not all had. Some of these major silver miners trade in the UK or Mexico, where financial results are only required in half-year increments. If a field is left blank in this table, it means that data wasn’t available by the end of Q3’s earnings season. Some of SIL’s components also report in gold-centric terms, excluding silver-specific data.
The first couple columns of this table show each SIL component’s symbol and weighting within this ETF as of mid-November. While most of these stocks trade on US exchanges, some symbols are listings from companies’ primary foreign stock exchanges. That’s followed by each miner’s Q3’18 silver production in ounces, along with its absolute year-over-year change. Next comes this same quarter’s gold production.
Nearly all the major silver miners in SIL also produce significant-to-large amounts of gold! That’s truly a double-edged sword. While gold really stabilizes and boosts silver miners’ cash flows, it also retards their stocks’ sensitivity to silver itself. So the next column reveals how pure these elite silver miners are, approximating their percentages of Q3’18 revenues actually derived from silver. This is calculated two ways.
The large majority of these top SIL silver miners reported total Q3 revenues. Quarterly silver production multiplied by silver’s average price in Q3 can be divided by these sales to yield an accurate relative-purity gauge. When Q3 sales weren’t reported, I estimated them by adding silver sales to gold sales based on their production and average quarterly prices. But that’s less optimal, as it ignores any base-metals byproducts.
Next comes the major silver miners’ most-important fundamental data for investors, cash costs and all-in sustaining costs per ounce mined. The latter directly drives profitability which ultimately determines stock prices. These key costs are also followed by YoY changes. Last but not least the annual changes are shown in operating cash flows generated and hard GAAP earnings, with a couple exceptions necessary.
Percentage changes aren’t relevant or meaningful if data shifted from positive to negative or vice versa, or if derived from two negative numbers. So in those cases I included raw underlying data rather than weird or misleading percentage changes. This whole dataset together offers a fantastic high-level read on how the major silver miners are faring fundamentally as an industry. They are hanging in there quite well.
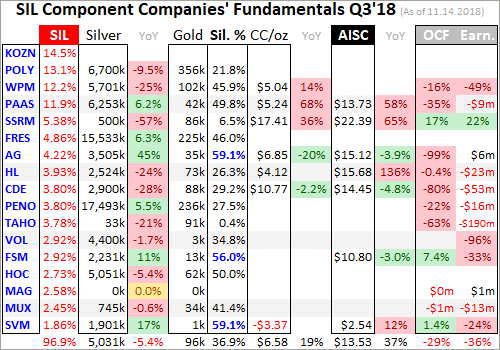
Production is naturally the lifeblood of the silver-mining sector. The more silver and increasingly gold that these elite miners can wrest from the bowels of the earth, the stronger their fundamental positions and outlooks. These top 17 SIL miners’ overall silver production slipped 2.2% YoY to 75.5m ounces in Q3’18. But their shift into more-profitable gold mining continued, with aggregate production up 1.6% YoY to 1.4m ounces.
According to the Silver Institute’s latest WSS, total world silver mine production averaged 213.0m ounces per quarter in 2017. So at 75.5m in Q3, these top 17 SIL components were responsible for 35.4% of that rate. There is one unusual situation that slightly skewed this result. SSR Mining, which used to be known as Silver Standard Resources, saw its silver production plummet 57% YoY as its lone silver mine is depleting.
The winding down of SSRM’s old Pirquitas silver mine is proceeding as forecast and has been going on for some time. This once major silver miner is morphing into a primary gold miner, which accounted for a record 94% of its revenue in Q3. Excluding SSRM, the rest of these top SIL silver miners saw their silver production retreat an immaterial 1.3% YoY. That’s pretty impressive given this year’s collapse in silver prices.
Q3’s average silver price was just $14.96, down a major 11.2% YoY. That was far-worse performance than gold, with its quarterly average merely sliding 5.3% lower between Q3’17 to Q3’18. Considering how miserable this silver-price environment is with the worst relative performance to gold in decades, the major silver miners are doing well on production. They continue to hold out for silver mean reverting higher.
Silver is likely so down in the dumps because it effectively acts like a gold sentiment gauge. Generally big silver uplegs only happen after gold has rallied long enough and high enough to convince traders its gains are sustainable. Then the way-smaller silver market tends to start leveraging and amplifying gold’s moves by 2x to 3x. But gold sentiment was so insipid over this past year that no excitement was sparked for silver.
Unfortunately at these bombed-out silver prices the economics of silver mining are way inferior to gold mining. The traditional major silver miners are painfully aware of this, and have spent years actively diversifying into gold. In Q3’18, the average percentage of revenues that these top 17 SIL miners derived from silver was just 36.9%. That’s right in line with the prior 4 quarters’ 39.3%, 35.3%, 36.8%, and 36.3%.
Silver mining is every bit as capital-intensive as gold mining, requiring similar large expenses for planning, permitting, and constructing mines and mills. It needs similar heavy excavators and haul trucks to dig and move the silver-bearing ore. Similar levels of employees are necessary to run these mines. But silver generates much lower cash flows due to its lower price. Consider hypothetical mid-sized silver and gold mines.
They might produce 10m and 300k ounces annually. At last quarter’s average prices, these silver and gold mines would yield $150m and $363m of yearly sales. Thus regrettably it is far easier to pay the bills mining gold these days. So primary silver miners are increasingly becoming a dying breed, which is sad. The traditional major silver miners are adapting by ramping their gold production often at silver’s expense.
With major silver miners so rare, SIL’s managers are really struggling to find components for their leading ETF. So in Q3’17 they added Korea Zinc, which is now SIL’s largest component at over 1/7th of its total weighting. In my decades of studying and trading this tiny sector, I’d never heard of it. So I looked into Korea Zinc and found it was merely a smelter, not even a miner. It really needs to be kicked out of SIL.
Every quarter since I’ve tried to dig up information on Korea Zinc, but its English-language disclosures are literally the worst I’ve ever seen for any company. Its homepage gives an idea of what to expect, declaring “We are Korea Zinc, the world’s one of the best smelting company”. I’ve looked and looked and the latest production data I can find in English remains 2015’s. I can’t find it from third-party sources either.
That year Korea Zinc “produced” 63.3m ozs of silver, which averages to 15.8m quarterly. That is largely a byproduct from its main businesses of smelting zinc, lead, copper, and gold. Korea Zinc certainly isn’t a major silver miner, and has no place in a “Silver Miners ETF”. No silver-stock investor wants to own a base-metals smelter! Korea Zinc should be removed, its overweighting reallocated to the rest of SIL’s holdings.
SIL investors ought to contact Global X to ask them to stop tainting their ETF’s utility and desirability with Korea Zinc. If they want it to be successful and grow, they need to stick with their mission of owning the major silver miners exclusively. Silver-stock exposure is the only reason investors would buy SIL. There is another situation investors need to be aware of with Tahoe Resources and its held-hostage Escobal mine.
Tahoe was originally spun off by Goldcorp to develop the incredible high-grade Escobal silver mine in Guatemala, which went live in Q4’13. Everything went well for its first few years. By Q1’17, Escobal was a well-oiled machine producing 5700k ounces of silver. That provided 1000+ great high-paying jobs to locals and contributed big taxes to Guatemala’s economy. Escobal was a great economic boon for this country.
But a radical group of anti-mining activists managed to spoil everything, cruelly casting their fellow countrymen out of work. They filed a frivolous and baseless lawsuit against Guatemala’s Ministry of Energy and Mines, Tahoe wasn’t even the target! It alleged this regulator hadn’t sufficiently consulted with the indigenous Xinca people before granting Escobal’s permits. They don’t even live around this mine site.
Only in a third-world country plagued with rampant government corruption would a regulator apparently not holding enough meetings be a company’s problem. Instead of resolving this, a high Guatemalan court inexplicably actually suspended Escobal’s mining license in early Q3’17! Tahoe was forced to temporarily mothball its crown-jewel silver mine, and thus eventually lay off its Guatemalan employees.
That license was technically reinstated a couple months later, but the activists appealed to a higher court. It required the regulator to study the indigenous people in surrounding areas and report back, and then needs to make a decision. The government also needs to clear out an illegal roadblock to the mine site by violent anti-mine militants, who have blockaded Escobal supplies and physically attacked trucks and drivers!
So Escobal has been dead in the water with zero production for 5 quarters now, an unthinkable outcome. This whole thing is a farce, a gross miscarriage of justice. I hope this isn’t a stealth expropriation, that Guatemalan bureaucrats will get their useless paperwork done sooner or later and let Escobal come back online. Within a year, Escobal’s silver production should return to pre-fiasco levels of 5700k ounces a quarter.
At that rate, Escobal would retake the throne of being the world’s largest primary silver mine! It would boost overall SIL-top-17 production by a massive 7.6%. Last year no one expected this unprecedented Escobal debacle to last very long, as the economic damage to Guatemala was too great. But as it drags on and on, TAHO stock has been decimated. It slumped to a brutal all-time record low in mid-November.
Sadly for long-suffering TAHO shareholders, management capitulated. In mid-November they agreed to sell the company to Pan American Silver at rock-bottom prices despite a 55% premium over that all-time low. That’s devastating for TAHO investors but a steal for PAAS, which is SIL’s 4th-largest component at 11.9% of its total weighting. That keeps Escobal’s huge production in SIL if PAAS can finesse its reopening.
Unfortunately SIL’s mid-November composition was such that there wasn’t a lot of Q3 cost data reported by its top component miners. A half-dozen of these top SIL companies trade in South Korea, the UK, Mexico, and Peru, where reporting only comes in half-year increments. There are also primary gold miners that don’t report silver costs, and a silver explorer with no production. So silver cost data remains scarce.
Nevertheless it’s always useful to look at what we have. Industrywide silver-mining costs are one of the most-critical fundamental data points for silver-stock investors. As long as the miners can produce silver for well under prevailing silver prices, they remain fundamentally sound. Cost knowledge helps traders weather this sector’s left-for-dead unpopularity without succumbing to selling low like the rest of the herd.
There are two major ways to measure silver-mining costs, classic cash costs per ounce and the superior all-in sustaining costs. Both are useful metrics. Cash costs are the acid test of silver-miner survivability in lower-silver-price environments, revealing the worst-case silver levels necessary to keep the mines running. All-in sustaining costs show where silver needs to trade to maintain current mining tempos indefinitely.
Cash costs naturally encompass all cash expenses necessary to produce each ounce of silver, including all direct production costs, mine-level administration, smelting, refining, transport, regulatory, royalty, and tax expenses. In Q3’18, these top 17 SIL-component silver miners that reported cash costs averaged $6.58 per ounce. While that surged 35.3% YoY, it still remains far below today’s anomalously-low silver prices.
There are a couple of extreme cash-cost outliers that are skewing this average, but offsetting each other. SSRM’s depleting silver mine is producing less with each passing quarter, forcing fewer ounces to bear the fixed costs of mining. Its crazy-high $17.41 per ounce in Q3 isn’t normal. But on the other side of this is Silvercorp Metals, which produces silver in Chinese mines yielding enormous base-metals byproducts.
Selling those and crediting their value across the silver ounces mined dragged down SVM’s cash costs to an unbelievable negative $3.37 in Q3! Excluding these extreme outliers, the rest of the SIL top 17 saw average cash costs of $6.40. That’s not too far above the past 4 quarters’ $4.86, $4.66, $5.05, and $3.95. As long as silver prices remain over those low levels, the silver miners can keep the lights on at their mines.
Way more important than cash costs are the far-superior all-in sustaining costs. They were introduced by the World Gold Council in June 2013 to give investors a much-better understanding of what it really costs to maintain silver mines as ongoing concerns. AISCs include all direct cash costs, but then add on everything else that is necessary to maintain and replenish operations at current silver-production levels.
These additional expenses include exploration for new silver to mine to replace depleting deposits, mine-development and construction expenses, remediation, and mine reclamation. They also include the corporate-level administration expenses necessary to oversee silver mines. All-in sustaining costs are the most-important silver-mining cost metric by far for investors, revealing silver miners’ true operating profitability.
In Q3’18 these top 17 SIL miners reporting AISCs averaged $13.53 per ounce, which also surged 39.0% YoY. Again that was skewed in both directions by SSRM’s extremely-high $22.39 on Pirquitas’ depletion and SVM’s exceedingly-low $2.54 on those huge base-metals byproducts. Without them, the rest of the top 17 averaged $13.96 AISCs. That was much higher than the past 4 quarters’ $9.73, $10.16, $10.92, and $10.93.
The lower production was definitely a factor, which is inversely proportional to per-ounce costs. Silver-mining costs are largely fixed quarter after quarter, with actual mining requiring roughly the same levels of infrastructure, equipment, and employees. So the lower production, the fewer ounces to spread mining’s big fixed costs across. The major silver miners also reported lower ore grades, exacerbating the decline.
Nevertheless, the top 17 SIL miners’ AISCs both with and without the outliers still remained under silver’s weak average $14.96 price in Q3. So even with silver faring its worst relative to gold in decades thanks to devastated sentiment, the silver mines were profitable. And interestingly the closer AISCs crowd the prevailing silver prices, the more profits leverage the miners have to silver mean reverting much higher.
In mid-November silver and SIL slumped to their lowest levels since back in January and March 2016. That was early in a new silver bull which emerged from conditions like today’s where silver was despised. Over 7.6 months between December 2015 and August 2016, silver soared 50.2% higher as gold surged in its own new bull. And with silver moving again, investors eagerly started returning to the battered silver stocks.
Thanks to that silver-bull upleg, SIL skyrocketed 247.8% higher in just 6.9 months in essentially that first half of 2016! That ought to give embattled silver-stock investors some hope. All it will take to turn silver stocks around is a typical gold-driven silver upleg, and then they will soar again. The reason that silver miners’ stocks blast dramatically higher with silver is their high inherent profits leverage to silver prices.
Assume another 50% silver upleg, which is pathetically small by historical standards, from silver’s recent secular low in mid-November. That would catapult silver back up to $21 per ounce for the first time since July 2014. At Q3’18’s top-17-SIL-stock average AISCs of $13.53, profits were just $0.47 per ounce at $14 silver. But at $21 assuming stable AISCs, they would soar an astounding 1489% higher to $7.47 per ounce!
You better believe silver-stock prices would skyrocket with that kind of earnings growth. The higher their AISCs, the greater their upside profits leverage. Now consider this same 50% silver upleg using the rolling-past-4-quarter top-17-SIL-stock average AISCs of $10.43 per ounce. That implies the $3.57 profit seen at $14 silver would only balloon 196% to $10.57 per ounce at $21 silver. So higher costs aren’t necessarily bad.
As long as AISCs are below prevailing silver prices, the major silver miners can weather anything. The closer their AISCs creep to silver, the greater their earnings growth when silver mean reverts higher. So the major silver miners’ upside from here is truly explosive as silver recovers, just like back in early 2016. And silver will power much higher soon as the record silver-futures shorts of early September continue to be covered.
While all-in sustaining costs are the single-most-important fundamental measure that investors need to keep an eye on, other metrics offer peripheral reads on the major silver miners’ fundamental health. The more important ones include cash flows generated from operations, GAAP accounting profits, revenues, and cash on hand. As you’d expect given the miserably-low silver prices, they were on the weak side in Q3.
Operating cash flows among these SIL top 17 reporting them fell 23.0% YoY to $830m, which is totally reasonable given the 2.2%-lower silver production and 11.2%-lower average silver prices. Sales fell 9.5% YoY to $2717m, with some of the silver-side weakness offset by the 1.6%-higher gold production. And cash on hand fell 9.8% YoY to a still-hefty $2419m, giving these silver miners plenty of capital to weather this storm.
The hard GAAP accounting profits looked pretty ugly though, plunging to a $243m loss from being $88m in the black in Q3’17. But most of those losses didn’t reflect operations. TAHO alone wrote off a massive $170m for the impairment of Escobal, which reflected an estimated restart date of the end of 2019. Coeur Mining reported a smaller $19m writedown for one of its mines. These two non-cash charges alone were $189m.
Without them GAAP profits would’ve sunk from $88m in Q3’17 to a milder $54m loss in Q3’18. That’s still poor, but not unexpected given the lowest silver prices seen in almost several years. Again silver-mining earnings will soar if not skyrocket as silver inevitably mean reverts higher from here. All it takes for silver to surge in major bull-market uplegs is for gold itself to power higher, and huge gold upleg fuel abounds now.
The silver-mining stocks are doing way better fundamentally than they’ve been given credit for. Their higher Q3’18 mining costs still remained below the recent deep silver lows. And the compressed gap between their AISCs and low prevailing silver prices guarantees epic profits upside as silver recovers and mean reverts higher. That will attract back investors fast, catapulting silver stocks up sharply like in early 2016.
While traders can play that in SIL, this ETF has problems. Its largest component is now a base-metals smelter of all things! And the great majority of its stocks are primary gold miners with byproduct silver production. The best gains by far will be won in smaller purer mid-tier and junior silver miners with superior fundamentals. A carefully-handpicked portfolio of these miners will generate much-greater wealth creation.
The key to riding any silver-stock bull to multiplying your fortune is staying informed, both about broader markets and individual stocks. That’s long been our specialty at Zeal. My decades of experience both intensely studying the markets and actively trading them as a contrarian is priceless and impossible to replicate. I share my vast experience, knowledge, wisdom, and ongoing research through our popular newsletters.
Published weekly and monthly, they explain what’s going on in the markets, why, and how to trade them with specific stocks. They are a great way to stay abreast, easy to read and affordable. Walking the contrarian walk is very profitable. As of Q3, we’ve recommended and realized 1045 newsletter stock trades since 2001. Their average annualized realized gains including all losers is +17.7%! That’s double the long-term stock-market average. Subscribe today and take advantage of our 20%-off holidays sale!
The bottom line is the major silver miners’ fundamentals remain solid based on their recently-reported Q3’18 results. They continue to mine silver at all-in sustaining costs below even mid-November’s deep silver lows. Their profits will multiply dramatically as silver rebounds higher driven by gold’s own upleg and record silver-futures short covering. Investment capital will flood back in, catapulting silver stocks up violently.
So traders need to look through the recent forsaken herd sentiment to understand the silver miners’ hard fundamentals. These left-for-dead stocks are seriously undervalued even at today’s low silver prices, let alone where silver heads during the next major gold upleg. Silver can’t languish at extreme anomalous multi-decade lows relative to gold for long. And once it catches a bid, silver stocks will really amplify its upside.
Adam Hamilton, CPA
November 23, 2018
Copyright 2000 – 2018 Zeal LLC (www.ZealLLC.com)
Graceland Updates 4am-7am
https://www.gracelandupdates.com
https://gracelandjuniors.com
https://gudividends.com
|https://guswinger.com
https://gublockchain.com
Email:
stewart@gracelandupdates.com
stewart@gracelandjuniors.com
stewart@gudividends.com
stewart@guswinger.com
admin@gublockchain.com
November 20, 2018
- After breaking upside from a double bottom pattern, gold continues its solid price action. More good times lie directly ahead for precious metals investors, because Chinese New Year buy season begins very soon.
- Please click here now. Double-click to enlarge. Note the solid position of my key 14,7,7 Stochastics indicator on this daily gold chart.
- The U.S. stock market’s “traditional end of the year rally” is turning into a veritable turkey shoot for the bears. Gold seems immune to the action, suggesting that unseen inflationary pressures may be larger than most investors realize.
- Please click here now. Double-click to enlarge. Investors need to understand that as the business cycle matures, volatility in the stock market rises.
- Any decline could be the start of a bear market. A “buy the dip” approach to the market becomes a death trap as corporate earnings peak, rates rise, GDP peaks, and inflation gains attention.
- The bottom line: U.S. stock market bears crack the whip, and late cycle price chasers take a horrific trip!
- Please click here now. Morgan Stanley’s top currency analysts believe the dollar has peaked against most of the currencies it recently rallied against. Hedge fund “superman” Ray Dalio is talking about a 30% dollar devaluation. He proposes monetizing the U.S. government’s huge debt as a “final solution.”
- I’ve suggested a “Plaza Accord 2.0” is going to happen. I believe U.S. President Trump will lead preliminary discussions about it from behind closed doors at the upcoming G20 meeting.
- Please click here now. As empires peak and then die, the peak usually comes with the nation enveloped in a state of “war worship.”
- Massive amounts of money are borrowed by the government to fund the madness, but even that isn’t so enough, so more is extorted via “taxes” from struggling citizens.
- In the case of America, more than 25% of the government’s gargantuan debt is easily attributable to war worship.
- The final nail the U.S. government’s debt coffin likely came when instead of cutting the capital gains tax to zero and beginning a Treasury monthly gold buy program, the government decided to impose tariff taxes to “boost growth and make trade fair.”
- Import tariffs are the best form of taxation, but only when used instead of income and capital gains taxation. In this case, tariffs are layered on top of income and capital gains taxes. The bottom line: Instead of becoming a super-sized version of Switzerland, America risks becoming a stagflationary wasteland.
- Ray Dalio speaks of “other currencies” rising to prominence as the dollar fades. He says he doesn’t want to be specific about it though. Is that because gold is one of those currencies?
- The U.S. stock market has begun collapsing, inflation is on the move, and junior miners should be looking good. Are they?
- For the answer to that question, please click here now. Double-click to enlarge. Most of the world’s smallest resource companies are in the Canadian CDNX index.
- It’s the best indication of the overall health of the global junior mining and junior energy sectors. I highlight key buy and sell action points on my www.gracelandjuniors.com website for many of the CDNX component stocks. This is a look at the signals for the index itself.
- There’s no significant buy signal yet, but in early 2019 as inflation likely moves higher and U.S. GDP declines, a “America, it’s time to usher in the new year with a new and not so exciting era of substantial stagflation!” welcome mat will be rolled out.
- I expect to get a major buy signal for the entire junior mining sector as that happens.
- Please click here now. Double-click to enlarge. I’m impressed with the price action of GDX on this daily chart.
- Note how quickly GDX has surged back above the neckline of that pesky H&S top pattern after breaking down. That’s positive action and now there’s a bull wedge in play too!
- Please click here now. Double-click to enlarge this long term GDX “Trigger Time” chart.
- Investors also need to watch the price of Barrick (ABX-NYSE) closely. If it can close above $14.00 on Friday of this week, that will be a major buy signal, and Barrick is my most important lead indicator for GDX and the entire senior gold stocks sector.
- All gold stock investor eyes need to be laser-focused on the $22.50 zone for GDX, because if GDX can stage two consecutive Friday closes above that price, I will have a massive buy signal in play!
Stewart Thomson is a retired Merrill Lynch broker. Stewart writes the Graceland Updates daily between 4am-7am. They are sent out around 8am-9am. The newsletter is attractively priced and the format is a unique numbered point form. Giving clarity of each point and saving valuable reading time.
Risks, Disclaimers, Legal
Stewart Thomson is no longer an investment advisor. The information provided by Stewart and Graceland Updates is for general information purposes only. Before taking any action on any investment, it is imperative that you consult with multiple properly licensed, experienced and qualified investment advisors and get numerous opinions before taking any action. Your minimum risk on any investment in the world is: 100% loss of all your money. You may be taking or preparing to take leveraged positions in investments and not know it, exposing yourself to unlimited risks. This is highly concerning if you are an investor in any derivatives products. There is an approx $700 trillion OTC Derivatives Iceberg with a tiny portion written off officially. The bottom line: Are You Prepared?
The mega-cap stocks that dominate the US markets are just finishing another monster earnings season. It wasn’t just profits that soared under Republicans’ big corporate tax cuts, but sales surged too. That’s no mean feat for massive mature companies, but sustained growth at this torrid pace is impossible. So peak-earnings fears continue to mount while valuations shoot even higher into dangerous bubble territory.
Four times a year publicly-traded companies release treasure troves of valuable information in the form of quarterly reports. Required by the US Securities and Exchange Commission, these 10-Qs contain the best fundamental data available to investors and speculators. They dispel all the sentimental distortions inevitably surrounding prevailing stock-price levels, revealing the underlying hard fundamental realities.
The deadline for filing 10-Qs for “large accelerated filers” is 40 days after fiscal quarter-ends. The SEC defines this as companies with market capitalizations over $700m. That currently includes every single stock in the flagship S&P 500 stock index, which includes the biggest and best American companies. As Q2’18 ended, the smallest SPX stock had a market cap of $4.1b which was 1/225th the size of leader Apple.
The middle of this week marked 39 days since the end of calendar Q2, so almost all of the big US stocks of the S&P 500 have reported. The exceptions are companies running fiscal quarters out of sync with calendar quarters. Walmart, Home Depot, Cisco, and NVIDIA have fiscal quarters ending a month after calendar ones, so their “Q2” results weren’t out yet as of this Wednesday. They’ll arrive in coming weeks.
The S&P 500 (SPX) is the world’s most-important stock index by far, weighting the best US companies by market capitalization. So not surprisingly the world’s largest and most-important ETF is the SPY SPDR S&P 500 ETF which tracks the SPX. This week it had huge net assets of $271.3b! The IVV iShares Core S&P 500 ETF and VOO Vanguard S&P 500 ETF also track the SPX with $155.9b and $96.6b of net assets.
The vast majority of investors own the big US stocks of the SPX, as they are the top holdings of nearly all investment funds. So if you are in the US markets at all, including with retirement capital, the fortunes of the big US stocks are very important for your overall wealth. Thus once a quarter after earnings season it’s essential to check in to see how they are faring fundamentally. Their results also portend stock-price trends.
Unfortunately my small financial-research company lacks the manpower to analyze all 500 SPX stocks in SPY each quarter. Support our business with enough newsletter subscriptions, and I would gladly hire the people necessary to do it. For now we’re digging into the top 34 SPX/SPY components ranked by market capitalization. That’s an arbitrary number that fits neatly into the tables below, and a dominant sample.
As of the end of Q2’18 on June 29th, these 34 companies accounted for a staggering 42.6% of the total weighting in SPY and the SPX itself! These are the mightiest of American companies, the widely-held mega-cap stocks everyone knows and loves. For comparison, it took the bottom 431 SPX companies to match its top 34 stocks’ weighting! The entire stock markets greatly depend on how the big US stocks are doing.
Every quarter I wade through the 10-Q SEC filings of these top SPX companies for a ton of fundamental data I dump into a spreadsheet for analysis. The highlights make it into these tables below. They start with each company’s symbol, weighting in the SPX and SPY, and market cap as of the final trading day of Q2’18. That’s followed by the year-over-year change in each company’s market capitalization, a critical metric.
Major US corporations have been engaged in a wildly-unprecedented stock-buyback binge ever since the Fed forced interest rates to deep artificial lows during 2008’s stock panic. Thus the appreciation in their share prices also reflects shrinking shares outstanding. Looking at market-cap changes instead of just underlying share-price changes effectively normalizes out stock buybacks, offering purer views of value.
That’s followed by quarterly sales along with their YoY changes. Top-line revenues are one of the best indicators of businesses’ health. While profits can be easily manipulated quarter-to-quarter by playing with all kinds of accounting estimates, sales are tougher to artificially inflate. Ultimately sales growth is necessary for companies to expand, as bottom-line earnings growth driven by cost-cutting is inherently limited.
Operating cash flows are also important, showing how much capital companies’ businesses are actually generating. Using cash to make more cash is a core tenet of capitalism. Unfortunately most companies are now obscuring quarterly OCFs by reporting them in year-to-date terms, which lumps in multiple quarters together. So these tables only include Q2 operating cash flows if specifically broken out by companies.
Next are the actual hard quarterly earnings that must be reported to the SEC under Generally Accepted Accounting Principles. Late in bull markets, companies tend to use fake pro-forma earnings to downplay real GAAP results. These are derided as EBS earnings, Everything but the Bad Stuff! Companies often arbitrarily ignore certain expenses on a pro-forma basis to artificially boost their profits, which is very misleading.
While we’re also collecting the earnings-per-share data Wall Street loves, it’s more important to consider total profits. Stock buybacks are executed to manipulate EPS higher, because the shares-outstanding denominator of its calculation shrinks as shares are repurchased. Raw profits are a cleaner measure, again effectively neutralizing the impacts of stock buybacks. They better reflect underlying business performance.
Finally the trailing-twelve-month price-to-earnings ratio as of the end of Q2’18 is noted. TTM P/Es look at the last four reported quarters of actual GAAP profits compared to prevailing stock prices. They are the gold-standard metric for valuations. Wall Street often intentionally obscures these hard P/Es by using the fictional forward P/Es instead, which are literally mere guesses about future profits that often prove far too optimistic.
Not surprisingly in the second quarter under this new slashed-corporate-taxes regime, many of the mega-cap US stocks reported spectacular Q2’18 results. For the most part sales, OCFs, and earnings surged dramatically. The big problem is such blistering tax-cut-driven growth rates are impossible to sustain for long at the vast scales these huge companies operate at. Downside risks are serious with bubble valuations.
The elite market-darling mega tech stocks continue to dominate the US stock markets. Most famous are the FANG names, Facebook, Amazon, Netflix, and Alphabet which used to be called Google. Apple and Microsoft should be added to those rarified beloved ranks. Together these half-dozen companies alone accounted for nearly 1/6th of the SPX’s entire market cap! That’s an incredible concentration of capital.
This highlights the extreme narrowing breadth behind this very-late-stage bull market. At the month-end just before Trump’s election victory in early November 2016, these same tech giants weighed in at 12.3% of the SPX weighting compared to 16.4% today. And if you go all the way back to this bull’s birth month of March 2009, MSFT, GOOGL, AAPL, and AMZN weighed in at 5.4%. FB and NFLX weren’t yet in the SPX.
Ever more capital is crowding into fewer and fewer stocks as fund managers chase the biggest winners and increasingly pile into them. And these 6 elite mega techs’ Q2’18 results show why they are widely adored. Their revenues rocketed 30.3% YoY on average, more than doubling the 14.0% growth in this entire top-34 list! Excluding these techs, the rest of the top 34 only grew their sales by 10.0% or a third as much.
That vast outperformance is reflected in their market-cap gains too, which again normalize out all the big stock buybacks. Overall these top SPY companies’ values surged 23.5% higher YoY, nearly doubling the 12.2% SPX gain from the ends of Q2’17 to Q2’18. But these top 6 tech stocks’ stellar average gains of 57.5% YoY dwarfed the rest of the top 34’s 16.2% annual appreciation! These stocks are loved for good reason.
The same is true on the profits front, with AAPL, AMZN, GOOGL, MSFT, FB, and NFLX trouncing the rest of these biggest US stocks. These 6 tech giants saw staggering average earnings growth of 289.1% YoY, compared to 30.9% for the rest of the top 34. That former number is heavily skewed by Amazon’s results though, as its profits skyrocketed an astounding 1186% from $197m in Q2’17 to $2534m in Q2’18.
Netflix had a similar enormous 484% YoY gain in earnings from a super-low level. Interestingly the rest of these big 6 tech stocks saw average growth of just 16.0% YoY, only about half that of the rest of the top 34. That proves the enormous surge in mega-cap-tech stock prices over this past year wasn’t driven by earnings as bulls often claim. Stock-price appreciation has far outstretched profits growth, an ominous sign.
In conservative hard trailing-twelve-month price-to-earnings-ratio terms, the big-6 tech giants sported an incredible average P/E of 107.3x earnings exiting Q2! That is deep into formal stock-bubble territory over 28x, which is itself double the century-and-a-quarter average fair value of 14x in the US stock markets. Again AMZN and NFLX are skewing this way higher though, with their insane 214.8x and 263.9x P/E ratios.
P/Es are the annual ratio of prevailing stock-price levels to underlying profits. So they can be viewed as the number of years it would take a company to earn back the price new investors today are paying for it. A stock bought at 200x earnings would take 200 years to merely recoup its purchase price through profits, assuming no growth of course. Buying at these heights is crazy given humans’ relatively-short investing lifespan.
Assuming people start investing young at 25 years old and retire at 65, that gives them about 40 years of prime investing time. So buying any stock above 40x implies a time horizon well beyond what anyone actually has. And provocatively even excluding the crazy P/Es of Amazon and Netflix, the rest of these big 6 tech stocks still average extremely-high 41.2x P/Es. And ominously that is right in line with market averages.
Without those elite tech leaders, the rest of these top 34 SPY stocks had average TTM P/Es of 41.0x when they exited Q2. History has proven countless times that buying stocks near such extreme bubble valuations has soon led to massive losses in the subsequent bear markets that always follow bulls. So these stock markets are extraordinarily risky at these valuations, truly an accident waiting to happen.
When stocks are exceedingly overvalued, the downside risks are radically greater than upside potential. After everyone is effectively all-in one of these universally-held mega tech stocks, there aren’t enough new buyers left to drive them higher no matter how good news happens to be. And these investors who bought in high and late can quickly become herd sellers when some bad news inevitably comes to pass.
Q2’18’s earnings season has already proven this in spades despite the extreme euphoria surrounding the stock markets and elite tech stocks in particular. Fully 3 of the 4 beloved FANG stocks showed just how overbought stocks react to news. The recent price action in Amazon, Netflix, and Facebook following their Q2 results is a serious cautionary tale for investors convinced mega tech stocks can rally indefinitely.
Everyone loves Amazon, but it is priced far beyond perfection. Its stock skyrocketed 75% YoY to leave Q2 with that ludicrous P/E of 214.8x. When any stock gets so radically overbought and overvalued, it has a tough time moving materially higher no matter what happens. Normally stocks shoot higher on blowout quarterly results as new investors flood into the strong company. But Amazon couldn’t find many buyers.
After the close on July 26th Amazon reported a monster blowout Q2. Its earnings per share of $5.07 was more than double analysts’ estimate of $2.50! Revenues, operating cash flows, and profits rocketed up an astounding 39.3%, 93.5%, and 1186.3% YoY. AMZN’s revenue guidance for Q3 at a midpoint running $55.8b also hit the low end of Wall Street expectations. Any normal stock would soar the next day on all that.
But while Amazon stock mustered a decent 4.0% gain at best the next day, that faded to a mere +0.5% close. AMZN was priced for perfection, so not even one of its best quarters ever was enough to bring in more buyers. Everyone already owns it, so who is left to deploy new capital? AMZN slumped 1.7% over the next several trading days, though it has since recovered to new record highs with the strong stock markets.
Netflix was the best-performing large US stock over the past year, skyrocketing 162% higher between the ends of Q2’17 to Q2’18! It had an absurd TTM P/E of 263.9x leaving Q2, more extreme than Amazon’s. But man, investors love Netflix with a quasi-religious fervor and believe it can do no wrong at any price. So Wall Street was eagerly anticipating NFLX’s Q2 results that came out after the close back on July 16th.
And they were really darned good. EPS of $0.85 beat the expectations of $0.79. On an absolute basis, sales and profits soared 40.3% and 484.3% YoY! Netflix did report negative operating cash flows, but it has been burning cash forever so that was no surprise. Yet despite these strong results this priced-for-perfection market-darling stock plunged 13%ish in after-hours trading! Good news wasn’t good enough.
Investors weren’t happy because subscriber growth was slowing. NFLX reported 5.2m net new streaming subscriptions in Q2, below the 6.3m expected and 7.4m in Q1. Netflix itself had provided earlier guidance of 1.2m US adds, but the actual was way short at 0.7m. So NFLX stock plummeted as much as 14.1% the next trading day before rebounding to a still-ugly -5.2% close. It couldn’t rally on great Q2 financial results.
And universally-held big stocks not responding favorably to quarterly results can quickly damage traders’ euphoric enthusiasm for them. The selling in Netflix’s stock gradually cascaded following that big hit on Q2 results. Over the next couple weeks, NFLX dropped 16.4% from its close just before that Q2 earnings release! The mega tech stocks aren’t invincible, and are very risky trading so high with everyone all-in.
With the possible exception of mighty Apple, Facebook was widely considered the least risky of the elite tech stocks as Q2 ended. Its 32.5x P/E was almost low by mega-tech standards, only bested by the 17.9x of Apple which is in a league of its own. FB reported after the close on July 25th, and shared great results led by a modest EPS beat of $1.74 compared to $1.72 expected. But the absolute gains were really big.
Facebook’s sales, operating cash flows, and profits soared 41.9%, 17.5%, and 31.1% YoY! That top-line revenue growth in particular was huge, nearly the best out of all these top 34 SPY stocks. And FB’s profits were growing so fast that it was the only elite mega-tech stock to see its TTM P/E actually decline YoY, retreating 14.2%. So FB looked much safer fundamentally than the other FANG stocks dominating the SPX.
But Facebook’s stock effectively crashed in after-hours trading immediately after those Q2 results, falling as much as 24%! The reason? It guided to slowing sales growth in Q3 and Q4 in the high single digits. FB was obviously priced for perfection and universally owned too, leaving nothing but herd sellers when anything finally disappointed. The next day FB stock plummeted a catastrophic 19.0%, stunning investors.
That wiped out an inconceivable $119.4b in market capitalization! That was the worst ever seen in one day by any single company in US stock-market history. More than ever investors and speculators need to realize that their beloved FANG stocks along with MSFT and AAPL aren’t magically exempt from serious selloffs. When any stocks are way overbought and wildly overvalued, it’s only a matter of time until selling hits.
Without these mega tech stocks, the US stock markets never would’ve gotten anywhere close to their current near-record heights. The flood of investment capital into Netflix over this past year was so huge it catapulted that company well into the ranks of the top 34. Its symbol is highlighted in light blue, along with a few other stocks, because it is new in the SPX’s top 34 in Q2. Outsized tech gains can’t happen forever.
Interestingly I found something else in their quarterly reports I haven’t yet seen discussed elsewhere. The total debt of these top 6 mega tech stocks soared an average of 36.5% higher YoY! That is way beyond the rest of the top 34 excluding the giant banks which have very-different balance sheets. Those other 18 top-34 SPY companies saw total debt only climb 6.0% YoY. Mega-tech debt is rocketing at 6.1x that rate!
While the elite tech stocks do have huge cash hoards, their spiraling debt is ominous. With the Fed deep into its latest rate-hike cycle, the carrying costs of debt are rising fast. With each passing month and each bond companies roll over, their interest expenses increase. At best those will cut into their profits, which will push their nosebleed P/Es even higher. They will have to slow debt growth and eventually pay back much.
We are talking huge amounts, $588.2b of total debt across Apple, Amazon, Google, Microsoft, Facebook, and Netflix alone! The main reason most of these companies are ramping their debt so fast is to finance massive stock buybacks propelling their share prices higher. They will have to really slow or even stop their huge buyback campaigns if their total debt or the carrying costs on it grow too large, a serious threat now.
These top 34 SPX stocks collectively had an extreme average trailing-twelve-month price-to-earnings ratio of 53.4x leaving Q2! That is nearly double historical bubble levels, exceedingly dangerous. There are far-higher odds the next major move in these hyper-expensive stock markets will be down rather than up. The next couple quarters face very different psychology and monetary winds than this rallying past year.
In both Q3 and Q4 last year, traders were ecstatic over the Republicans’ record corporate tax cuts that were excitingly nearing. In Q1 and Q2 this year, traders were dazzled by the incredible profits growth largely driven by sharply-lower taxes. While that will continue to some extent in Q3 and Q4 this year, the initial exuberance has mostly run its course. Big US stocks are facing tougher comparables going forward.
But the real threat to these bubblicious extreme stock markets is the Fed’s young quantitative-tightening campaign. It started imperceptibly in Q4’17 to begin unwinding the staggering $3625b of quantitative-easing money printing the Fed unleashed over 6.7 years starting in late 2008. Total QT in Q4’17 was just $30b. But it grew to another $60b in Q1’18 and then another $90b in Q2’18. And it is still getting bigger.
In this current Q3’18, another $120b of QE is going to be wiped out by QT. And finally in Q4’18, this new Fed QT will hit its terminal speed of $150b per quarter. That’s expected to last for some time. If the Fed merely wants to reverse just half of its extreme QE, it will have to run QT at that full-speed $50b-per-month pace for fully 2.5 years. That extreme monetary-destruction headwind is unprecedented in world history.
Today’s enormous stock bull grew so extreme because the Fed’s epic QE levitated stock markets, driving their valuations to nosebleed heights. What Fed QE giveth, Fed QT taketh away. At the same time the European Central Bank is tapering its own colossal QE campaign to nothing too. Between the Fed and ECB alone, 2018 will see $900b less central-bank liquidity than 2017! That’s certainly going to leave a mark.
The odds are very high that a major new bear market is awakening. Stock markets inexorably levitated by long years of extreme central-bank easing now face record tightening as that easing finally starts to be unwound. Thanks to that extreme QE as well as the Fed’s radically-unprecedented 7-year-long zero-interest-rate policy, this SPX bull extended to a monster 324.6% gain over 8.9 years as of its late-January peak!
That is nearly the second-largest and easily the second-longest stock bull in all of US history. Stock bulls always eventually peak in extreme euphoria, and then give way to subsequent proportional bears. With today’s valuations so deep into dangerous bubble territory, not even blowout earnings will be enough to keep stocks from sliding. Normal bear markets after normal bulls often maul stock markets down 50% off highs!
And after this epic QE-fueled largely-artificial monster stock bull, the inevitable bear to come is very likely to prove much bigger and meaner than normal. If the Fed’s QT doesn’t spawn it, peak earnings will. The past year’s extreme growth rates in sales and profits at the largest US companies from already-high base levels aren’t sustainable mathematically. Traders will freak out when they see growth slow or even reverse.
Investors really need to lighten up on their stock-heavy portfolios, or put stop losses in place, to protect themselves from the coming central-bank-tightening-triggered valuation mean reversion in the form of a major new stock bear. Cash is king in bear markets, as its buying power grows. Investors who hold cash during a 50% bear market can double their stock holdings at the bottom by buying back their stocks at half-price!
SPY put options can also be used to hedge downside risks. They are still relatively cheap now with complacency rampant, but their prices will surge quickly when stocks start selling off materially again. Even better than cash and SPY puts is gold, the anti-stock trade. Gold is a rare asset that tends to move counter to stock markets, leading to soaring investment demand for portfolio diversification when stocks fall.
Gold surged nearly 30% higher in the first half of 2016 in a new bull run that was initially sparked by the last major correction in stock markets early that year. If the stock markets indeed roll over into a new bear soon, gold’s coming gains should be much greater. And they will be dwarfed by those of the best gold miners’ stocks, whose profits leverage gold’s gains. Gold stocks skyrocketed 182% higher in 2016’s first half!
Absolutely essential in bear markets is cultivating excellent contrarian intelligence sources. That’s our specialty at Zeal. After decades studying the markets and trading, we really walk the contrarian walk. We buy low when few others will, so we can later sell high when few others can. While Wall Street will deny the coming stock-market bear all the way down, we will help you both understand it and prosper during it.
We’ve long published acclaimed weekly and monthly newsletters for speculators and investors. They draw on my vast experience, knowledge, wisdom, and ongoing research to explain what’s going on in the markets, why, and how to trade them with specific stocks. As of the end of Q2, all 1012 stock trades recommended in real-time to our newsletter subscribers since 2001 averaged stellar annualized realized gains of +19.3%! Subscribe today and take advantage of our 20%-off summer-doldrums sale before it ends.
The bottom line is the big US stocks’ latest quarterly results again proved amazingly good. Sales and profits soared year-over-year on those record corporate tax cuts and the widespread optimism they fueled. But earnings are still way too low to justify today’s super-high stock prices, spawning dangerous bubble valuations. That portends far-weaker markets ahead, led by serious selling in market-darling mega techs.
These near-record-high stock markets are reaching buying exhaustion, when stocks can’t rally much on good news and plummet on bad news. Earnings are likely peaking with the corporate-tax-cut euphoria as well, with deteriorating profits growth ahead. As if that’s not worrisome enough for hyper-overvalued stocks, these priced-for-perfection markets face accelerating Fed QT in coming quarters. Talk about bearish!

Early summer is the weakest time of the year seasonally for gold, silver, and their miners’ stocks. With traders’ attention diverted to vacations and summer fun, their precious-metals interest and investment demand wane considerably. Thus this entire sector, and often the markets in general, suffer a seasonal lull this time of year. But these summer doldrums offer the best seasonal buying opportunities of the year.
This doldrums term is very apt for gold’s summer predicament. It describes a zone in the world’s oceans surrounding the equator. There hot air is constantly rising, creating long-lived low-pressure areas. They are often calm, with little or no prevailing winds. History is full of accounts of sailing ships getting trapped in this zone for days or even weeks, unable to make any headway. The doldrums were murder on ships’ morale.
Crews had no idea when the winds would pick up again, while they continued burning through their precious stores of food and drink. Without moving air, the stifling heat and humidity were suffocating on these ships long before air conditioning. Misery and boredom were extreme, leading to fights breaking out and occasional mutinies. Being trapped in the doldrums was viewed with dread, it was a very trying experience.
Gold investors can somewhat relate. Like clockwork nearly every summer, gold starts drifting listlessly sideways. It often can’t make significant progress no matter what the trends looked like heading into June, July, and August. As the days and weeks slowly pass, sentiment deteriorates markedly. Patience is gradually exhausted, supplanted with deep frustration. Plenty of traders capitulate, abandoning ship.
Thus after decades of trading gold, silver, and their miners’ stocks, I’ve come to call this time of year the summer doldrums. Junes and Julies in particular are usually desolate sentiment wastelands for precious metals, totally devoid of recurring seasonal demand surges. Unlike the rest of the year, these summer months simply lack any major income-cycle or cultural drivers of outsized gold investment demand.
The vast majority of the world’s investors and speculators live in the northern hemisphere, so markets take a back seat to the great joys of summer. Traders take advantage of the long sunny days and kids being out of school to go on extended vacations, hang out with friends, and enjoy life. And when they aren’t paying much attention to the markets, naturally they aren’t allocating much new capital to gold.
Given gold’s dull summer action historically, it’s never wise to expect too much from it this time of year. Summer rallies can happen, but they aren’t common. So expectations need to be tempered, especially in June and July. That early-1990s Gin Blossoms song “Hey Jealousy” comes to mind, declaring “If you don’t expect too much from me, you might not be let down.” The markets are ultimately an expectations game.
Quantifying gold’s summer seasonal tendencies during bull markets requires all relevant years’ price action to be recast in perfectly-comparable percentage terms. That’s accomplished by individually indexing each calendar year’s gold price to its last close before market summers, which is May’s final trading day. That’s set at 100 and then all gold-price action that summer is calculated off that common indexed baseline.
So gold trading at an indexed level of 105 simply means it has rallied 5% from May’s final close, while 95 shows it’s down 5%. This methodology renders all bull-market-year gold summers in like terms. That’s critical since gold’s price range has been so vast, from $257 in April 2001 to $1894 in August 2011. That span encompassed gold’s last secular bull, which enjoyed a colossal 638.2% gain over those 10.4 years!
So 2001 to 2011 were certainly bull years. 2012 was technically one too, despite gold suffering a major correction following that powerful bull run. At worst that year, gold fell 18.8% from its 2011 peak. That was not quite enough to enter formal bear territory at a 20% drop. But 2013 to 2015 were definitely brutal bear years, which need to be excluded since gold behaves very differently in bull and bear markets.
In early 2013 the Fed’s wildly-unprecedented open-ended QE3 campaign ramped to full speed, radically distorting the markets. Stock markets levitated on the Fed’s implied backstopping, slaughtering demand for alternative investments led by gold. In Q2’13 alone, gold plummeted by 22.8% which proved its worst quarter in an astounding 93 years! Gold’s bear continued until the Fed’s initial rate hike of this cycle in 2015.
The day after that first rate hike in 9.5 years in mid-December 2015, gold plunged to a major 6.1-year secular low. Then it surged out of that irrational rate-hike scare, formally crossing the +20% new-bull threshold in early March 2016. Ever since, gold has remained in this young bull. At worst in December 2016 after gold was crushed on the post-election Trumphoria stock-market surge, it had only corrected 17.3%.
So the bull-market years for gold in modern history ran from 2001 to 2012, skipped the intervening bear-market years of 2013 to 2015, and resumed in 2016 to 2018. Thus these are the years most relevant to understanding gold’s typical summer-doldrums performance, which is necessary for managing your own expectations this time of year. This spilled-spaghetti mess of a chart is actually simple and easy to understand.
The yellow lines show gold’s individual-year summer price action indexed from each May’s final close for all years from 2001 to 2012 and 2016 to 2017. Together they establish gold’s summer trading range. All those bull-market years’ individual indexes are then averaged together in the red line, revealing gold’s central summer tendency. Finally the indexed current-year gold action for 2018 is superimposed in blue.t
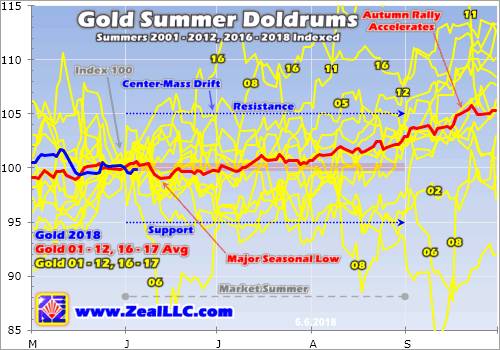
While there are outlier years, gold generally drifts listlessly in the summer doldrums much like a sailing ship trapped near the equator. The center-mass drift trend is crystal-clear in this chart. The vast majority of the time in June, July, and August, gold simply meanders between +/-5% from May’s final close. This year that equates to a probable summer range between $1233 and $1363. Gold tends to stay well within trend.
Understanding gold’s typical behavior this time of year is very important for traders. Sentiment isn’t only determined by outcome, but by the interplay between outcome and expectations. If gold rallies 5% but you expected 10% gains, you will be disappointed and grow discouraged and bearish. But if gold rallies that same 5% and you expected no gains, you’ll be excited and get optimistic and bullish. Expectations are key.
History has proven it’s wise not to expect too much from gold in these lazy market summers, particularly June and July. Occasionally gold still manages to stage a big summer rally, which is a bonus. But most of the time gold doesn’t veer materially from its usual summer-drift trading range, where it’s often adrift like a classic tall ship. With range breakouts either way rare, there’s usually little to get excited about.
In this chart I labeled some of the outlying years where gold burst out of its usual summer-drift trend, both to the upside and downside. But these exciting summers are unusual, and can’t be expected very often. Most of the time gold grinds sideways on balance not far from its May close. Traders not armed with this critical knowledge often wax bearish during gold’s summer doldrums and exit in frustration, a grave mistake.
Gold’s summer-doldrums lull marks the best time of the year seasonally to deploy capital, to buy low at a time when few others are willing. Gold enjoys powerful seasonal rallies that start in Augusts and run until the following Mays! These are fueled by outsized investment demand driven by a series of major income-cycle and cultural factors from around the world. Summer is when investors should be bullish, not bearish.
The red average indexed line above encompassing 2001 to 2012 and 2016 to 2017 reveals gold’s true underlying summer trend in bull-market years. Technically gold’s major seasonal low arrives relatively early in summers, mid-June. On average through all these modern bull-market years, gold slumped 1.0% between May’s close and that summer nadir. But that’s probably still too early to deploy capital.
Check out the yellow indexed lines in this chart. They tend to cluster closer to flat-lined in mid-June than through all of July. The only reason gold’s seasonal low appears in mid-June mathematically is a single extreme-outlier year, 2006. Gold’s spring seasonal rally was epic that year, gold rocketed 33.4% higher to a dazzling new bull high of $720 in just 2.0 months between mid-March and mid-May! That was incredible.
Extreme euphoria had catapulted gold an astounding 38.9% above its 200-day moving average, radically overbought by any standard. That was way too far too fast to be sustainable, so after that gold had to pay the piper in a sharp mean-reversion overshoot. So over the next month or so into mid-June, gold’s overheated price plummeted 21.9%! That crazy outlier is the only reason gold’s major summer low isn’t in July.
There were 14 bull-market years from 2001 to 2012 and 2016 to 2017. That’s a big-enough sample to smooth out the trend, but not large enough to prevent extreme deviations from skewing it a bit. Gold’s true major summer seasonal low is really closer to early-to-mid July. After that month’s opening holiday week in the States to celebrate Independence Day, investment capital inflows usually start ramping back up.
On average in these modern bull-market years, gold slipped 0.2% in Junes before rallying 0.9% in Julies. After that first lazy summer week in July, gold tends to gradually start clawing its way higher again. But this is so subtle that Julies often still feel summer-doldrumsy. By the final trading day in Julies, gold is still only 0.7% higher than its May close kicking off summers. That’s too small to restore damaged sentiment.
Since gold exited May 2018 at $1298, an average 0.7% rally by July’s end would put it at $1307. That’s hardly enough to generate excitement after two psychologically-grating months of drifting. But the best times to deploy any investment capital is when no one else wants to so prices are low. Gold’s summer doldrums come to swift ends in Augusts, which saw hefty average gains of 2.2% in these bull-market years!
And that’s just the start of gold’s major autumn seasonal rally, which has averaged strong 6.6% gains between mid-Junes and late Septembers. That’s driven by Asian gold demand coming back online, first post-harvest-surplus buying and later Indian-wedding-season buying. June is the worst of gold’s summer doldrums, and the first half of July is when to buy back in. It’s important to be fully deployed before August.
These gold summer doldrums driven by investors pulling back from the markets to enjoy their vacation season don’t exist in a vacuum. Gold’s fortunes drive the entire precious-metals complex, including both silver and the stocks of the gold and silver miners. These are effectively leveraged plays on gold, so the summer doldrums in them mirror and exaggerate gold’s own. Check out this same chart type applied to silver.
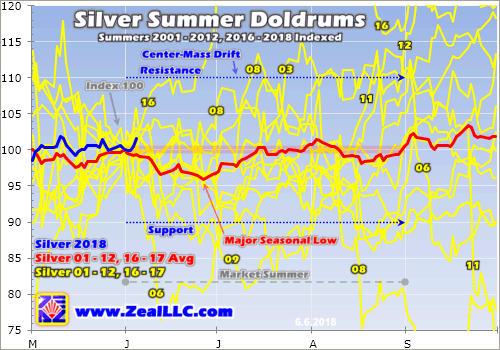
Since silver is much more volatile than gold, naturally its summer-doldrums-drift trading range is wider. The great majority of the time, silver meanders between +/-10% from its final May close. That came in at $16.39 this year, implying a summer-2018 silver trading range between $14.75 and $18.03. While silver suffered that extreme June-2006 selling anomaly too, its major seasonal low arrives a couple weeks after gold’s.
On average in these same modern bull-market years of 2001 to 2012 and 2016 to 2017, silver dropped 4.2% between May’s close and late June. That’s much deeper than gold’s 1.0% seasonal slump, which isn’t surprising given silver’s leverage to gold. Silver’s summer performances are also much lumpier than gold’s. Junes see average silver losses of 3.3%, but those are more than made back in strong rebounds in Julies.
Silver’s big 4.1% average rally in Julies amplifies gold’s gains by an impressive 4.6x. But unfortunately silver hasn’t been able to maintain that seasonal momentum, with Augusts averaging a slight decline of 0.3%. Overall from the end of May to the end of August, silver’s summer-doldrums performance tends to be flat. Silver just averaged a 0.4% full-summer gain, way behind gold’s 2.9% through June, July, and August.
That means silver sentiment this time of year is often worse than gold’s, which is already plenty bearish. The summer doldrums are more challenging for silver than gold. Being in the newsletter business for a couple decades now, I’ve heard from countless discouraged investors over the summers. While I haven’t tracked this, it sure feels like silver investors have been disproportionately represented in this feedback.
Since gold is silver’s primary driver, this white metal is stuck in the same dull drifting boat as gold in the market summers. Silver usually amplifies whatever is happening in gold, both good and bad. But again the brunt of silver’s summer weakness is borne in Junes. Fully expecting this seasonal weakness and rolling with the punches helps prevent being disheartened, which in turn can lead to irrationally selling low.
The gold miners’ stocks are also hostage to gold’s summer doldrums. This last chart applies this same analysis to the flagship HUI gold-stock index, which is closely mirrored by that leading GDX VanEck Vectors Gold Miners ETF. The major gold stocks tend to leverage gold’s gains and losses by 2x to 3x, so it’s not surprising that the HUI’s summer-doldrums-drift trading range is also twice as wide as gold’s own.
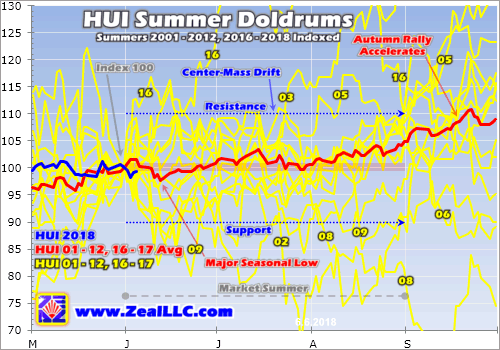
The gold miners’ stocks share silver’s center-mass summer drift running +/-10% from May’s close. This year the HUI entered the summer doldrums at 180.1, implying a June, July, and August trading range of 162.1 to 198.1. While gold stocks’ GDX ETF is too new to do long-term seasonal analysis, in GDX terms this summer range translates to $20.11 to $24.57 this year. That’s based off a May 31st close of $22.34.
Like gold, the gold stocks’ major summer seasonal low arrives in mid-June. On average in these modern bull-market years of 2001 to 2012 and 2016 to 2017, by then the HUI had slid 2.3% from its May close. Then gold stocks tended to more than fully rebound by the end of June, making for an average 0.8% gain that month. But there’s no follow-through in July, where the gold stocks averaged a modest 0.2% loss.
Overall between the end of May and the end of July, which encompasses the dark heart of the summer doldrums, the HUI averaged a trivial 0.6% gain. Again two solid months of grinding sideways on balance is hard for traders to stomach, especially if they’re not aware of the summer-doldrums drift. The key to surviving it with minimum psychological angst is to fully expect it. Managing expectations in markets is essential!
But also like gold, the big payoff for weathering the gold-stock summer starts in August. With gold’s major autumn rally getting underway, the gold stocks as measured by the HUI amplify it with strong average gains of 4.2% in Augusts! And that’s only the start of gold stocks’ parallel autumn rally with gold’s, which has averaged 10.5% gains from late Julies to late Septembers. Gold-stock upside resumes in late summers.
Like everything in life, withstanding the precious-metals summer doldrums is much less challenging if you know they’re coming. While outlying years happen, they aren’t common. So the only safe bet to make is expecting gold, silver, and the stocks of their miners to languish in Junes and Julies. Then when these drifts again come to pass, you won’t be surprised and won’t get too bearish. That will protect you from selling low.
This summer actually has a pretty interesting setup for gold that’s more bullish than usual. Gold’s short-term price moves are dominated by speculators’ gold-futures trading. These guys have been selling like crazy since late April in response to a major short-squeeze rally in the US dollar. That’s left their gold-futures long positions exceptionally low entering this summer, which is very unusual and quite bullish.
With total spec longs near the bottom of their past-year trading range, that sizable gold-futures selling that can hit in summers is likely already exhausted. The usual summer-doldrums gold-futures dump was effectively pulled forward, short-circuiting gold’s spring rally. That means gold is much more likely than usual to see mean-reversion futures buying in the coming weeks, especially after next week’s big FOMC meeting.
The Fed is universally expected to hike rates for the 7th time in this cycle on June 13th. That is one of the every-other FOMC meetings also accompanied by the newest dot-plot federal-funds-rate forecast by top Fed officials. And afterwards the Fed’s new chairman Jerome Powell will hold a press conference. If any of this is less hawkish on more rate hikes than traders expect, speculators could aggressively buy gold futures.
Another counter-seasonal bullish factor for gold is today’s radical gold underinvestment coupled with these hyper-complacent bubble-valued stock markets. Whenever the inevitable next major stock selloff arrives, which could be this summer, gold investment demand will surge. Stock selloffs are great for gold since it tends to rally when stocks weaken. That makes gold the ultimate portfolio diversifier during such times.
And with the Fed both relentlessly ratcheting up interest rates and accelerating its young quantitative-tightening campaign to start to unwind QE, the stock markets are facing mounting headwinds. The extreme central-bank liquidity that drove them so high is being reversed, a dangerous omen. Gold investment demand will start returning to favor in a big way whenever they decisively roll over, even if it happens this summer.
Smart contrarians who want to buy low realize gold’s summer doldrums are a gift. They offer the best seasonal buying opportunities of the year in gold, silver, and their miners’ stocks. This is not the time to disengage, but to do your research and get deployed in great gold and silver stocks at bargain-basement prices. They are wildly undervalued and basing today, ready to scream higher when gold sentiment turns.
We’ve been hard at work at Zeal in recent weeks preparing for these great summer buying opportunities. I’ve been researching the latest fundamentals of the world’s best gold and silver miners to make a shopping list for the summer-doldrums lows. These coming trades will easily have the potential to double before next summer as the precious-metals sector mean reverts higher. Buying low is the key to big gains later.
Now is the time to get ready, so we share our research and trades via acclaimed weekly and monthly newsletters. They draw on my vast experience, knowledge, wisdom, and ongoing research to explain what’s going on in the markets, why, and how to trade them with specific stocks. As of the end of Q1, all 998 newsletter stock trades recommended since 2001 have averaged stellar annualized realized gains of +19.4%! For just $12 an issue, you too can learn to think, trade, and thrive like contrarians. Subscribe today!
The bottom line is gold, silver, and their miners’ stocks usually drift listlessly during market summers. As investors shift their focus from markets to vacations, capital inflows wane. Junes and Julies in particular are simply devoid of the big recurring gold-investment-demand surges seen during much of the rest of the year, leaving them weak. Investors need to expect lackluster sideways action on balance this time of year.
Gold’s summer doldrums shouldn’t be a psychological burden, as they are a great opportunity to buy low before major autumn rallies. Those tend to be stealthily born in early-to-mid Julies before accelerating in Augusts. So investors must do their research homework in early summers, in order to be ready to deploy capital in mid summers before sizable late-summer rallies. Summer doldrums should be embraced, not dreaded.
Adam Hamilton, CPA
June 8, 2018
Copyright 2000 – 2018 Zeal LLC (www.ZealLLC.com)
The gold miners’ stocks remain deeply out of favor, trading at prices seen when gold was half or even a quarter of current levels. So many traders assume this small contrarian sector must be really struggling fundamentally. But nothing could be farther from the truth! The major gold miners’ recently-released Q4’17 results prove they are thriving. Their languishing stock prices are the result of irrational herd sentiment.
Four times a year publicly-traded companies release treasure troves of valuable information in the form of quarterly reports. Required by securities regulators, these quarterly results are exceedingly important for investors and speculators. They dispel all the sentimental distortions surrounding prevailing stock-price levels, revealing the underlying hard fundamental realities. They serve to re-anchor perceptions.
Normally quarterlies are due 45 calendar days after quarter-ends, in the form of 10-Qs required by the SEC for American companies. But after the final quarter of fiscal years, which are calendar years for most gold miners, that deadline extends out up to 90 days depending on company size. The 10-K annual reports required once a year are bigger, more complex, and need fully-audited numbers unlike 10-Qs.
So it takes companies more time to prepare full-year financials and then get them audited by CPAs right in the heart of their busy season. The additional delay in releasing Q4 results is certainly frustrating, as that data is getting stale approaching the end of Q1. Compounding the irritation, some gold miners don’t actually break out Q4 separately. Instead they only report full-year results, lumping in and obscuring Q4.
I always wonder what gold miners that don’t report full Q4 results are trying to hide. Some Q4 numbers can be inferred by comparing full-year results to the prior three quarterlies, but others aren’t knowable if not specifically disclosed. While most gold miners report their Q4 and/or full-year results by 7 to 9 weeks after year-ends, some drag their feet and push that 13-week limit. That’s very disrespectful to investors.
All this unfortunately makes Q4 results the hardest to analyze out of all quarterlies. But delving into them is still well worth the challenge. There’s no better fundamental data available to gold-stock investors and speculators than quarterly results, so they can’t be ignored. They offer a very valuable true snapshot of what’s really going on, shattering all the misconceptions bred by the ever-shifting winds of sentiment.
The definitive list of major gold-mining stocks to analyze comes from the world’s most-popular gold-stock investment vehicle, the GDX VanEck Vectors Gold Miners ETF. Its composition and performance are similar to the benchmark HUI gold-stock index. GDX utterly dominates this sector, with no meaningful competition. This week GDX’s net assets are 24.4x larger than the next-biggest 1x-long major-gold-miners ETF!
Being included in GDX is the gold standard for gold miners, requiring deep analysis and vetting by elite analysts. And due to ETF investing eclipsing individual-stock investing, major-ETF inclusion is one of the most-important considerations for picking great gold stocks. As the vast pools of fund capital flow into leading ETFs, these ETFs in turn buy shares in their underlying companies bidding their stock prices higher.
This week GDX included a whopping 51 component “Gold Miners”. That term is used somewhat loosely, as this ETF also contains major silver miners, a silver streamer, and gold royalty companies. Still, all the world’s major gold miners are GDX components. Due to time constraints I limited my deep individual-company research to this ETF’s top 34 stocks, an arbitrary number that fits neatly into the tables below.
Collectively GDX’s 34 largest components now account for 90.5% of its total weighting, a commanding sample. GDX’s stocks include major foreign gold miners trading in Australia, Canada, and the UK. Some countries’ regulations require financial reporting in half-year increments instead of quarterly, which limits local gold miners’ Q4 data. But some foreign companies still choose to publish limited quarterly results.
The importance of these top-GDX-component gold miners can’t be overstated. In Q4’17 they collectively produced over 10.3m ounces of gold, or 321.5 metric tons. The World Gold Council’s recently-released Q4 Gold Demand Trends report, the definitive source on worldwide supply-and-demand fundamentals, pegged total global mine production at 833.1t in Q4. GDX’s top 34 miners alone accounted for nearly 4/10ths!
Every quarter I wade through a ton of data from these elite gold miners’ 10-Qs or 10-Ks, and dump it into a big spreadsheet for analysis. The highlights made it into these tables. Blank fields mean a company did not report that data for Q4’17 as of this Wednesday. Naturally companies always try to present their quarterly results in the best-possible light, which leads to wide variations in reporting styles and data offered.
In these tables the first couple columns show each GDX component’s symbol and weighting within this ETF as of this week. While most of these gold stocks trade in the States, not all of them do. So if you can’t find one of these symbols, it’s a listing from a company’s primary foreign stock exchange. That’s followed by each company’s Q4’17 gold production in ounces, which is mostly reported in pure-gold terms.
Many gold miners also produce byproduct metals like silver and copper. These are valuable, as they are sold to offset some of the considerable costs of gold mining. Some companies report their quarterly gold production including silver, a construct called gold-equivalent ounces. I only included GEOs if no pure-gold numbers were reported. That’s followed by production’s absolute year-over-year change from Q4’16.
Next comes the most-important fundamental data for gold miners, cash costs and all-in sustaining costs per ounce mined. The latter determines their profitability and hence ultimately stock prices. Those are also followed by YoY changes. Finally the YoY changes in cash flows generated from operations, GAAP profits, revenues, and cash on balance sheets are listed. There are a couple exceptions to these YoY changes.
Percentage changes aren’t relevant or meaningful if data shifted from positive to negative or vice versa, or if derived from two negative numbers. So in those cases I included raw underlying numbers instead of weird or misleading percentage changes. This whole dataset offers a fantastic high-level read on how the major gold miners are faring today as an industry. And contrary to their low stock prices, they are thriving!
After spending days digesting these elite gold miners’ latest quarterly reports, it’s fully apparent their vexing consolidation over the past year or so isn’t fundamentally-righteous at all! Traders have mostly abandoned this sector because the allure of the levitating general stock markets has eclipsed gold. That has left gold stocks exceedingly undervalued, truly the best fundamental bargains out there in all the stock markets!
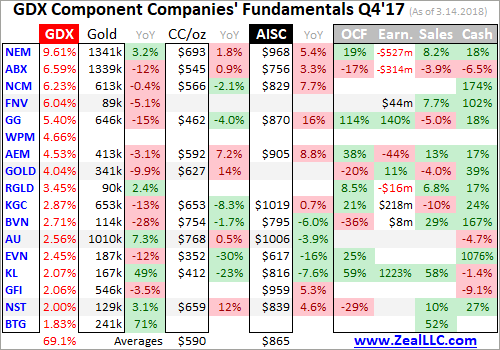
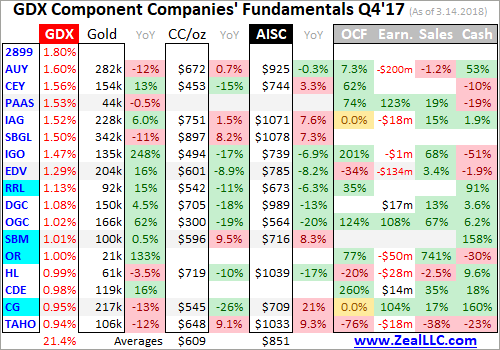
Since gold miners are in the business of wresting gold from the bowels of the Earth, production is the best place to start. The 10,337k ounces of gold collectively produced last quarter by these elite major gold miners actually fell a sizable 1.7% YoY! Interestingly that’s right in line with industry trends per the World Gold Council, as overall world gold mine production also retreated that same 1.7% YoY in Q4’17.
These biggest and best gold miners on the planet certainly had every incentive to grow their gold production. The quarterly average gold price surged 4.8% YoY in Q4’17, really boosting profitability. Of course the more gold any miner can produce, the more opportunities it has to expand thanks to higher cash flows. Investors often punish flagging production too, so the major gold miners really hate reporting it.
Most investors won’t bother studying long and detailed 10-Qs, 10-Ks, or the accompanying management discussions and analyses. So gold miners often issue short press releases summarizing some of their quarterly results. These sometimes intentionally mask production declines by excluding year-ago production, looking at quarter-on-quarter performance instead of year-over-year, or only comparing results to guidance.
As a professional speculator, investor, and newsletter writer for nearly two decades now, I spend a huge amount of time analyzing quarterly results. And I remain a CPA after my previous late-1990s gig auditing mining companies for a Big Six firm. Yet even with this exceptional experience and knowledge, I’m still surprised how deeply I have to dig for some key results miners bury and hide in hundred-plus-page-long SEC filings.
So believe me, major gold miners don’t shout out shrinking gold production from the rooftops. Yet of the 32 of these top-34 GDX gold miners reporting Q4 production as of the middle of this week, fully half saw declines. That was even with four different gold miners climbing into GDX’s top 34 components over the past year, which are highlighted in blue above. The average production decline was a serious 9.5% YoY!
Gold deposits economically viable to mine are very rare in the natural world, and the low-hanging fruit has largely been harvested. It is growing ever more expensive to explore for gold, in far-less-hospitable places. Then even after new deposits are discovered, it takes up to a decade to jump through all the Draconian regulatory hoops necessary to secure permitting. And only then can mine construction finally start.
That takes additional years and hundreds of millions if not billions of dollars per gold mine. But because gold-mining stocks have been deeply out of favor most of the time since 2013, capital has been heavily constrained. When banks are bearish on gold prices, they aren’t willing to lend to gold miners except with onerous terms. And when investors aren’t buying gold stocks, issuing new shares low is heavily dilutive.
The large gold miners used to rely heavily on the smaller junior gold miners to explore and replenish the gold-production pipeline. But juniors have been devastated since 2013, starved of capital. Not only are investors completely uninterested with general stock markets levitating, but the rise of ETFs has funneled most investment inflows into a handful of larger-market-cap juniors while the rest see little meaningful buying.
So even the world’s biggest and best gold miners are struggling to grow production. While that isn’t great for those individual miners, it’s super-bullish for gold. The less gold mined, the more gold supply will fail to keep pace with demand. That will result in higher gold prices, making gold mining more profitable in the future. Some analysts even think peak gold has been reached, that mine production will decline indefinitely.
There are strong fundamental arguments in favor of peak-gold theories. But regardless of where overall global gold production heads in coming years, the major gold miners able to grow their own production will fare the best. They’ll attract in relatively-more investor capital, bidding their stocks to premium prices compared to peers who can’t grow production. Stock picking is more important than ever in this ETF world!
But despite slowing gold production, these top-34 GDX-component gold miners remained quite strong fundamentally in Q4! Their viability and profitability are measured by the differences between prevailing gold prices and what it costs to produce that gold. Despite traders’ erroneous perception gold stocks are doomed, rising gold prices and falling mining costs are making the major gold miners much more profitable.
There are two major ways to measure gold-mining costs, classic cash costs per ounce and the superior all-in sustaining costs per ounce. Both are useful metrics. Cash costs are the acid test of gold-miner survivability in lower-gold-price environments, revealing the worst-case gold levels necessary to keep the mines running. All-in sustaining costs show where gold needs to trade to maintain current mining tempos indefinitely.
Cash costs naturally encompass all cash expenses necessary to produce each ounce of gold, including all direct production costs, mine-level administration, smelting, refining, transport, regulatory, royalty, and tax expenses. In Q4’17, these top-34 GDX-component gold miners that reported cash costs averaged just $600 per ounce. That dropped a sizable 4.4% YoY, showing serious gold-miner discipline controlling costs.
Today the gold miners’ stocks are trading at crazy-low prices implying their survivability is in jeopardy. This week the flagship HUI gold-stock index was languishing near 174, despite $1325 gold. The first time the HUI hit 175 in August 2003, gold was only in the $350s! Gold stocks are radically undervalued today by every metric. And they collectively face zero threat of bankruptcies unless gold plummets under $600.
Way more important than cash costs are the far-superior all-in sustaining costs. They were introduced by the World Gold Council in June 2013 to give investors a much-better understanding of what it really costs to maintain gold mines as ongoing concerns. AISC include all direct cash costs, but then add on everything else that is necessary to maintain and replenish operations at current gold-production levels.
These additional expenses include exploration for new gold to mine to replace depleting deposits, mine-development and construction expenses, remediation, and mine reclamation. They also include the corporate-level administration expenses necessary to oversee gold mines. All-in sustaining costs are the most-important gold-mining cost metric by far for investors, revealing gold miners’ true operating profitability.
In Q4’17, these top-34 GDX-component gold miners reporting AISC averaged just $858 per ounce. That was down a significant 2.0% YoY, extending a welcome declining trend. In 2017’s four quarters, these major gold miners’ average AISCs ran $878, $867, $868, and $858. The elite gold miners are getting more efficient at producing their metal, which is definitely impressive considering their collective lower production.
Gold-mining costs are largely fixed during mine-planning stages, when engineers and geologists decide which ore to mine, how to dig to it, and how to process it. The actual mining generally requires the same levels of infrastructure, equipment, and employees quarter after quarter. So the more gold mined, the more ounces to spread those big fixed costs across. Thus production and AISCs are usually negatively correlated.
The major gold miners have to manage costs exceptionally well to drive AISCs lower while production is also slowing. This argues against the popular complaint that gold miners’ managements are doing poor jobs. Because gold-stock prices are so darned low, traders again assume the miners must be plagued with serious fundamental problems. But it’s relentlessly-bearish herd sentiment suppressing gold-stock prices.
These top-34 GDX gold miners are actually earning strong operating profits today. Q4’17’s average gold price ran near $1276, again up 4.8% YoY. That remains far above last quarter’s low average all-in sustaining costs among these major gold miners of $858 per ounce. Thus industry profit margins are way up at $418 per ounce. Most other industries would sell their souls to earn fat profit margins at this 33% level!
A year earlier in Q4’16, the top-34 GDX gold miners reported average AISCs of $875 in a quarter where gold averaged under $1218. That made for $343 per ounce in operating profits. So in Q4’17, the major gold miners’ earnings soared 22.1% YoY to $418 on that mere 4.8% gold rally! Gold miners make such compelling investment opportunities because of their inherent profits leverage to gold, multiplying its gains.
But this strong profitability sure isn’t being reflected in gold-stock prices. In Q4’17 the HUI averaged just 189.4, actually 1.5% lower than Q4’16’s 192.3! The vast fundamental disconnect in gold-stock prices today is absurd, and can’t last forever. Sooner or later investors will rush into the left-for-dead gold stocks to bid their prices far higher. This bearish-sentiment-driven anomaly has grown more extreme in 2018.
Since gold-mining costs don’t change much quarter-to-quarter regardless of prevailing gold prices, it’s reasonable to assume the top GDX miners’ AISCs will largely hold steady in the current Q1’18. And it’s been a strong quarter for gold so far, with it averaging over $1329 quarter-to-date. If the major gold miners’ AISCs hold near $858, that implies their operating profits are now running way up near $471 per ounce.
That would make for a massive 12.7% QoQ jump in earnings for the major gold miners in this current quarter! Yet so far in Q1 the HUI is averaging just 187.1, worse than both Q4’17 and Q4’16 when gold prices were considerably lower and mining costs were higher. The gold miners’ stocks can’t trade as if their profits don’t matter forever, so an enormous mean-reversion rally higher is inevitable sometime soon.
And that assumes gold prices merely hold steady, which is unlikely. After years of relentlessly-levitating stock markets thanks to extreme central-bank easing, radical gold underinvestment reigns today. As the wildly-overvalued stock markets inescapably sell off on unprecedented central-bank tightening this year, gold investment will really return to favor. That portends super-bullish-for-miners higher gold prices ahead.
The impact of higher gold prices on major-gold-miner profitability is easy to model. Assuming flat all-in sustaining costs at Q4’17’s $858 per ounce, 10%, 20%, and 30% gold rallies from this week’s levels would lead to collective gold-mining profits surging 43%, 75%, and 107%! And another 30% gold upleg isn’t a stretch at all. In the first half of 2016 alone after the previous stock-market correction, gold soared 29.9%.
GDX skyrocketed 151.2% higher in 6.4 months in essentially that same span! Gold-mining profits and thus gold-stock prices surge dramatically when gold is powering higher. Years of neglect from investors have forced the gold miners to get lean and efficient, which will amplify their fundamental upside during the next major gold upleg. The investors and speculators who buy in early and cheap could earn fortunes.
While all-in sustaining costs are the single-most-important fundamental measure that investors need to keep an eye on, other metrics offer peripheral reads on the major gold miners’ fundamental health. The more important ones include cash flows generated from operations, actual accounting profits, revenues, and cash on hand. They generally corroborated AISCs in Q4’17, proving the gold miners are faring really well.
These top-34 GDX-component gold miners collectively reported strong operating cash flows of $4529m in Q4, surging a huge 21.6% YoY! Running gold mines is very profitable for the major miners, they have this down to a science. Of the 26 of these major gold miners reporting Q4 OCFs, every single one was positive. Most also proved relatively large compared to individual company sizes, looking really strong.
As long as OCFs remain massively positive, the gold mines are generating much more cash than they cost to run. That gives the gold miners the capital necessary to expand existing operations and buy new deposits and mines. Given how ridiculously low gold-stock prices are today, you’d think the gold miners are hemorrhaging cash like crazy. But the opposite is true, showing how silly this bearish herd sentiment is.
The top GDX gold miners’ actual GAAP accounting profits didn’t look as good, coming in at a $266m loss in Q4’17. While a big improvement over Q4’16’s $588m loss, that still seems incongruent with those great all-in sustaining costs and operating cash flows. Of the 23 of these top-34 GDX components reporting earnings in Q4, 10 had losses. Half of those were big, over $50m. I looked into the reasons behind each one.
These handful of big gold-mining losses that dragged down overall top-GDX-component earnings were mostly the result of asset-impairment charges. Some of the world’s largest gold miners led by Newmont and Barrick with $527m and $314m Q4 losses continued to write down the carrying value of some gold mines. As mines are dug deeper and gold prices change, the economics of producing the metal change too.
That leaves some of the major gold miners’ individual mines worth less going forward than the amount of capital invested to develop them. So they are written off, resulting in big charges flushed through income statements that mask operating profits. But these writedowns are something of an accounting fiction, non-cash expenses not reflective of current operations. They are mostly isolated one-time events as well.
In addition to writedowns totally irrelevant to current and future cash flows, there were also big losses recognized in Q4’17 due to the new US corporate-tax law. With tax rates slashed, deferred tax assets that were created by overpaying taxes in past years were suddenly worth a lot less. These too were non-cash charges, another accounting fiction. Finally some companies realized losses on selling gold mines.
The major gold miners all run portfolios of multiple individual gold mines, each with different AISC levels. They’ve been gradually pruning out their higher-cost operations by selling those mines to smaller gold miners, usually at losses. While this hits income statements in mine-sale quarters, it is one reason the major gold miners have been able to drive down their costs. That will lead to greater future profitability.
In price-to-earnings-ratio terms, the major gold stocks are definitely getting cheaper. Of the 23 of these top-GDX-component stocks with profits to create P/E ratios, 7 had P/Es in the single or low-double digits! There are some really-cheap gold miners out there today, even adjusted for any dilution from past share issuances. Of course P/E ratios automatically do that since stock prices are divided by earnings per share.
On the sales front these top-34 GDX gold miners’ revenues soared 13.9% YoY to $12,236m in Q4. That looks suspect given that 1.7% YoY drop in production and the 4.8% YoY rally in the average gold price. 26 of these gold miners reported Q4 sales, compared to 27 a year earlier in Q4’16. The apparent growth came from some large gold miners that didn’t disclose Q4’16 sales deciding to make that data available in Q4’17.
Cash on balance sheets is also an interesting metric to watch, because it is primarily fed by operating profitability. Nearly all the gold miners report their quarter-ending cash balances as well, whether they report quarterly like in the US and Canada or in half-year increments like in Australia and the UK. The total cash on hand reported by these top GDX gold miners surged 7.0% YoY to a hefty $13,974m in Q4’17!
That’s a big number for this small contrarian sector, and it’s conservative. I just included the bank cash reported, excluding short-term investments and gold bullion. The more cash gold miners have on hand, the more flexibility they have in growing operations and the more resilience they have to weather any unforeseen challenges. Material drops in cash at individual miners were usually spent to grow their production.
So overall the major gold miners’ fundamentals looked quite strong in Q4’17, a stark contrast to the miserable sentiment plaguing this sector. Gold stocks’ vexing consolidation over the past year or so isn’t the result of operational struggles, but purely bearish psychology. That will soon shift as stock markets inevitably roll over and gold surges, making the beaten-down gold stocks a coiled spring overdue to soar dramatically.
While investors and speculators alike can certainly play gold stocks’ coming powerful uplegs with the major ETFs like GDX, the best gains by far will be won in individual gold stocks with superior fundamentals. Their upside will far exceed the ETFs, which are burdened by over-diversification and underperforming stocks. A carefully-handpicked portfolio of elite gold and silver miners will generate much-greater wealth creation.
At Zeal we’ve literally spent tens of thousands of hours researching individual gold stocks and markets, so we can better decide what to trade and when. As of the end of Q4, this has resulted in 983 stock trades recommended in real-time to our newsletter subscribers since 2001. Fighting the crowd to buy low and sell high is very profitable, as all these trades averaged stellar annualized realized gains of +20.2%!
The key to this success is staying informed and being contrarian. That means buying low before others figure it out, before undervalued gold stocks soar much higher. An easy way to keep abreast is through our acclaimed weekly and monthly newsletters. They draw on my vast experience, knowledge, wisdom, and ongoing research to explain what’s going on in the markets, why, and how to trade them with specific stocks. For only $12 per issue, you can learn to think, trade, and thrive like contrarians. Subscribe today, and get deployed in the great gold and silver stocks in our full trading books!
The bottom line is the major gold miners’ fundamentals are quite strong based on their recently-reported Q4’17 results. While production declined, mining costs were still driven lower. That coupled with higher gold prices generated fat operating profits and strong cash flows. The resulting full coffers will help the gold miners expand operations this year, which will lead to even stronger earnings growth in the future.
Yet gold stocks are now priced as if gold was half or less of current levels, which is truly fundamentally absurd! They are the last dirt-cheap sector in these euphoric, overvalued stock markets. Once gold resumes rallying on gold investment demand returning, capital will flood back into forgotten gold stocks. That will catapult them higher, continuing their overdue mean reversion back up to fundamentally-righteous levels.
Adam Hamilton, CPA
March 16, 2018
Copyright 2000 – 2018 Zeal LLC (www.ZealLLC.com)
The junior gold miners’ stocks have spent months grinding sideways near lows, sapping confidence and breeding widespread bearishness. The entire precious-metals sector has been left for dead, eclipsed by the dazzling Trumphoria stock-market rally. But traders need to keep their eyes on the fundamental ball so herd sentiment doesn’t mislead them. The juniors recently reported Q3 earnings, and enjoyed strong results.
Four times a year publicly-traded companies release treasure troves of valuable information in the form of quarterly reports. Companies trading in the States are required to file 10-Qs with the US Securities and Exchange Commission by 45 calendar days after quarter-ends. Canadian companies have similar requirements. In other countries with half-year reporting, many companies still partially report quarterly.
The definitive list of elite junior gold stocks to analyze used to come from the world’s most-popular junior-gold-stock investment vehicle. This week the GDXJ VanEck Vectors Junior Gold Miners ETF reported $4.4b in net assets. Among all gold-stock ETFs, that was only second to GDX’s $8.1b. That is GDXJ’s big-brother ETF that includes larger major gold miners. GDXJ’s popularity testifies to the great allure of juniors.
Unfortunately this fame has recently created major problems severely hobbling the usefulness of GDXJ. This sector ETF has shifted from being beneficial for junior gold miners to outright harming them. GDXJ is literally advertised as a “Junior Gold Miners ETF”. Investors only buy GDXJ shares because they think this ETF gives them direct exposure to junior gold miners’ stocks. But unfortunately that’s no longer true!
GDXJ is quite literally the victim of its own success. This ETF grew so large in the first half of 2016 as gold stocks soared in a massive upleg that it risked running afoul of Canadian securities law. Most of the world’s junior gold miners and explorers trade in Canada. In that country once any investor including an ETF goes over 20% ownership in any stock, it is deemed a takeover offer that must be extended to all shareholders!
Understanding what happened in GDXJ is exceedingly important for junior-gold-stock investors, and I explained it in depth in my past essay on juniors’ Q1’17 results. GDXJ’s managers were forced to reduce their stakes in leading Canadian juniors. So capital that GDXJ investors intended to deploy in junior gold miners was instead diverted into much-larger gold miners. GDXJ’s effective mission stealthily changed.
Not many are more deeply immersed in the gold-stock sector than me, as I’ve spent decades studying, trading, and writing about this contrarian realm. These huge GDXJ changes weren’t advertised, and it took even me months to put the pieces together to understand what was happening. GDXJ’s managers may have had little choice, but their major direction change has been devastating to true junior gold miners.
Investors naturally pour capital into GDXJ, the “Junior Gold Miners ETF”, expecting to own junior gold miners. But instead of buying junior gold miners’ shares and bidding up their prices, GDXJ is instead shunting those critical inflows to the much-larger mid-tier and even major gold miners. That left the junior gold miners starved of capital, as their share prices they rely heavily upon for financing languished in neglect.
GDXJ’s managers should’ve lobbied Canadian regulators and lawmakers to exempt ETFs from that 20% takeover rule. Hundreds of thousands of investors buying an ETF obviously have no intention of taking over gold-mining companies! And higher junior-gold-stock prices boost the Canadian economy, helping these miners create valuable high-paying jobs. But GDXJ’s managers instead skated perilously close to fraud.
This year they rejiggered their own index underlying GDXJ, greatly demoting most of the junior gold miners! Investors buying GDXJ today are getting very-low junior-gold-miner exposure, which makes the name of this ETF a deliberate deception. I’ve championed GDXJ for years, it is a great idea. But in its current sorry state, I wouldn’t touch it with a ten-foot pole. It is no longer anything close to a junior-gold-miners ETF.
There’s no formal definition of a junior gold miner, which gives cover to GDXJ’s managers pushing the limits. Major gold miners are generally those that produce over 1m ounces of gold annually. For years juniors were considered to be sub-200k-ounce producers. So 300k ounces per year is a very-generous threshold. Anything between 300k to 1m ounces annually is in the mid-tier realm, where GDXJ now traffics.
That high 300k-ounce-per-year junior cutoff translates into 75k ounces per quarter. Following the end of the gold miners’ Q3 earnings season in mid-November, I dug into the top 34 GDXJ components. That’s just an arbitrary number that fits neatly into the tables below. While GDXJ included a staggering 73 component stocks in mid-November, the top 34 accounted for a commanding 81.1% of its total weighting.
Out of these top 34 GDXJ companies, only 5 primary gold miners met that sub-75k-ounces-per-quarter qualification to be a junior gold miner! Their quarterly production is highlighted in blue below, and they collectively accounted for just 7.1% of GDXJ’s total weighting. But even that isn’t righteous, as these include a 126-year-old silver miner and a mid-tier gold miner suffering temporary production declines.
GDXJ is inarguably now a pure mid-tier gold-miner ETF. That’s great if GDXJ is advertised as such, but terrible if capital investors explicitly intend for junior gold miners is instead being diverted into mid-tiers without their knowledge or consent. The vast majority of GDXJ shareholders have no idea how radically this ETF has changed since early 2016. It is all but unrecognizable, straying greatly from its original mission.
I’ve been doing these deep quarterly dives into GDXJ’s top components for years now. In Q3’17, fully 32 of the top 34 GDXJ components were also GDX components! These ETFs are separate, a “Gold Miners ETF” and a “Junior Gold Miners ETF”. So why on earth should they own many of the same companies? In the tables below I highlighted the rare GDXJ components not also in GDX in yellow in the weightings column.
These 32 GDX components accounted for 78.7% of GDXJ’s total weighting, not just its top 34. They also represented 31.4% of GDX’s total weighting. So almost 4/5ths of the junior gold miners’ ETF is made up of nearly a third of the major gold miners’ ETF! I’ve talked with many GDXJ investors over the years, and have never heard one wish their capital allocated specifically to junior golds would instead go to much-larger miners.
Fully 10 of GDXJ’s top 17 components weren’t even in this ETF a year ago in Q3’16. They alone now account for 34.5% of its total weighting. 16 of the top 34 are new, or 44.4% of the total. In the tables below, I highlighted the symbols of companies that weren’t in GDXJ a year ago in light blue. Today’s GDXJ is a radical departure from last year. Analyzing Q3’17 results largely devoid of real juniors is frustrating.
Nevertheless, GDXJ remains the leading “junior-gold” benchmark. So every quarter I wade through tons of data from its top components’ 10-Qs, and dump it into a big spreadsheet for analysis. The highlights made it into these tables. A blank field means a company didn’t report that data for Q3’17 as of that mid-November 10-Q deadline. Companies have wide variations in reporting styles, data presented, and report timing.
In these tables the first couple columns show each GDXJ component’s symbol and weighting within this ETF as of mid-November. While most of these gold stocks trade in the States, not all of them do. So if you can’t find one of these symbols, it’s a listing from a company’s primary foreign stock exchange. That’s followed by each company’s Q3’17 gold production in ounces, which is mostly reported in pure-gold terms.
Many gold miners also produce byproduct metals like silver and copper. These are valuable, as they are sold to offset some of the considerable costs of gold mining. Some companies report their quarterly gold production including silver, a construct called gold-equivalent ounces. I only included GEOs if no pure-gold numbers were reported. That’s followed by production’s absolute year-over-year change from Q3’16.
Next comes the most-important fundamental data for gold miners, cash costs and all-in sustaining costs per ounce mined. The latter determines their profitability and hence ultimately stock prices. Those are also followed by YoY changes. Finally the YoY changes in cash flows generated from operations, GAAP profits, revenues, and cash on balance sheets are listed. There’s one key exception to these YoY changes.
Percentage changes aren’t relevant or meaningful if data shifted from negative to positive or vice versa. Plenty of GDXJ gold miners that earned profits in Q3’16 suffered net losses in Q3’17. So in cases where data crossed that zero line, I included the raw numbers instead. This whole dataset offers a fantastic high-level fundamental read on how the mid-tier gold miners are faring today, and they’re actually doing quite well.
After spending days digesting these GDXJ gold miners’ latest quarterly reports, it’s fully apparent their vexing consolidation this year isn’t fundamentally righteous at all! Traders have abandoned this sector since the election because the allure of the levitating general stock markets has eclipsed gold. That has left gold stocks exceedingly undervalued, truly the best fundamental bargains out there in all the stock markets!
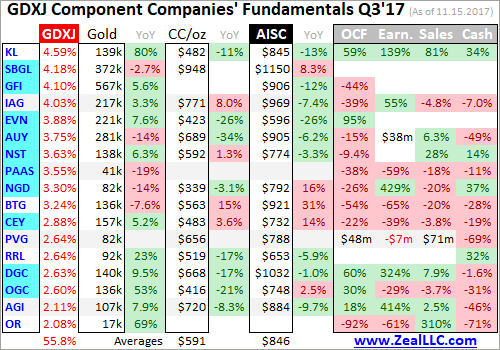
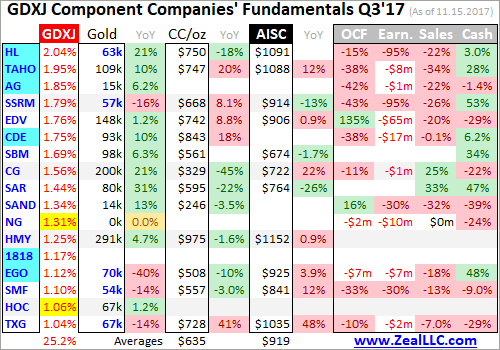
Once again the light-blue-highlighted symbols are new GDXJ components that weren’t included a year ago in Q3’16. And the meager yellow-highlighted weightings are the only stocks that were not also GDX components in mid-November! GDXJ is increasingly a GDX clone that offers little if any real exposure to true gold juniors’ epic upside potential during gold bulls. GDXJ has become a shadow of its former self.
VanEck owns and manages GDX, GDXJ, and the MVIS indexing company that decides exactly which gold stocks are included in each. With one company in total control, GDX and GDXJ should have zero overlap in underlying companies! GDX or GDXJ inclusion should be mutually-exclusive based on the size of individual miners. That would make both GDX and GDXJ much more targeted and useful for investors.
Two of GDXJ’s heaviest-weighted component choices are mystifying. Sibanye Gold and Gold Fields are major South African gold miners, way bigger than mid-tier status and about as far from junior-dom as you can get. In Q3’17 they both mined way in excess of that 250k-ounce quarterly threshold that is definitely major status. They are among the world’s largest gold miners, so it’s ludicrous to have them in a juniors ETF.
Since gold miners are in the business of wresting gold from the bowels of the Earth, production is the best place to start. These top 34 GDXJ gold miners collectively produced 4352k ounces in Q3’17. That rocketed 121% higher YoY, but that comparison is meaningless given the radical changes in this ETF’s composition since Q3’16. On the bright side, GDXJ’s miners do still remain significantly smaller than GDX’s.
GDX’s top 34 components, fully 20 of which are also top-34 GDXJ components, collectively produced 9947k ounces of gold in Q3. So GDXJ components’ average quarterly gold production of 136k ounces excluding explorers was 55% lower than GDX components’ 301k average. In spite of GDXJ’s very-misleading “Junior” name, it definitely has smaller gold miners even if they’re well above that 75k junior threshold.
Despite GDXJ’s top 34 components looking way different from a year ago, these current gold miners are faring well on the crucial production front. Fully 22 of these mid-tier gold miners enjoyed big average YoY production growth of 18%! Overall average growth excluding explorers was 8.2% YoY, which is far better than world mine production which slumped 1.3% lower YoY in Q3’17 according to the World Gold Council.
These elite GDXJ mid-tier gold miners are really thriving, with production growth way outpacing their industry. That will richly reward investors as sentiment normalizes. Smaller mid-tier gold miners able to grow production are the sweet spot for stock-price upside potential. With market capitalizations much lower than major gold miners, investment capital inflows are relatively larger which bids up stock prices faster.
With today’s set of top-34 GDXJ gold miners achieving such impressive production growth, their costs per ounce should’ve declined proportionally. Higher production yields more gold to spread mining’s big fixed costs across. And lower per-ounce costs naturally lead to higher profits. So production growth is highly sought after by gold-stock investors, with companies able to achieve it commanding premium prices.
There are two major ways to measure gold-mining costs, classic cash costs per ounce and the superior all-in sustaining costs per ounce. Both are useful metrics. Cash costs are the acid test of gold-miner survivability in lower-gold-price environments, revealing the worst-case gold levels necessary to keep the mines running. All-in sustaining costs show where gold needs to trade to maintain current mining tempos indefinitely.
Cash costs naturally encompass all cash expenses necessary to produce each ounce of gold, including all direct production costs, mine-level administration, smelting, refining, transport, regulatory, royalty, and tax expenses. In Q3’17, these top-34 GDXJ-component gold miners that reported cash costs averaged just $612 per ounce. That indeed plunged a major 6.9% YoY from Q3’16, and even 2.5% QoQ from Q2’17.
This was really quite impressive, as the mid-tier gold miners’ cash costs were only a little higher than the GDX majors’ $591. That’s despite the mid-tiers each operating fewer gold mines and thus having fewer opportunities to realize cost efficiencies. Traders must recognize these mid-sized gold miners are in zero fundamental peril as long as prevailing gold prices remain well above cash costs. And $612 gold ain’t happening!
Way more important than cash costs are the far-superior all-in sustaining costs. They were introduced by the World Gold Council in June 2013 to give investors a much-better understanding of what it really costs to maintain a gold mine as an ongoing concern. AISC include all direct cash costs, but then add on everything else that is necessary to maintain and replenish operations at current gold-production levels.
These additional expenses include exploration for new gold to mine to replace depleting deposits, mine-development and construction expenses, remediation, and mine reclamation. They also include the corporate-level administration expenses necessary to oversee gold mines. All-in sustaining costs are the most-important gold-mining cost metric by far for investors, revealing gold miners’ true operating profitability.
In Q3’17, these top 34 GDXJ components reporting AISC averaged just $877 per ounce. That’s down a sharp 3.7% YoY and 0.2% QoQ. That also compares very favorably with the GDX majors, which saw nearly-identical average AISC at $868 in Q3. The mid-tier gold miners’ low costs prove they are faring far better fundamentally today than traders think based on this year’s vexing sideways-grinding stock-price action.
All-in sustaining costs are effectively this industry’s breakeven level. As long as gold stays above $877 per ounce, it remains profitable to mine. At Q3’s average gold price of $1279, these top GDXJ gold miners were earning big average profits of $402 per ounce last quarter! That equates to hefty profit margins of 31%, levels most industries would kill for. The mid-tier gold miners aren’t getting credit for that today.
Unfortunately given its largely-junior-less composition, GDXJ remains the leading benchmark for junior gold miners. In Q3’17, GDXJ averaged $33.81 per share. That was down a serious 28.6% from Q3’16’s average of $47.38. Investors have largely abandoned gold miners because they are captivated by the extreme Trumphoria stock-market rally since the election. Yet gold-mining profits certainly didn’t justify this.
A year ago in Q3’16, the top 34 GDXJ components at that time reported average all-in sustaining costs of $911 per ounce. With gold averaging $1334 then which was 4.4% higher, that implies the mid-tier gold miners were running operating profits of $423 per ounce. Thus Q3’17’s $402 merely slumped 5.0% YoY, which definitely isn’t worthy of hammering mid-tier gold miners’ stock prices over a quarter lower over the past year.
Gold miners offer such compelling investment opportunities because of their inherent profits leverage to gold. Gold-mining costs are largely fixed during mine-planning stages, when engineers and geologists decide which ore to mine, how to dig to it, and how to process it. The actual mining generally requires the same levels of infrastructure, equipment, and employees quarter after quarter regardless of gold prices.
With gold-mining costs essentially fixed, higher or lower gold prices flow directly through to the bottom line in amplified fashion. That wasn’t really apparent in GDXJ over this past year since its composition changed so radically. Normally a 4.2% drop in average gold prices would lead to much more than a 5.0% YoY operating-profit decline. Gold-stock profits generally leverage gold price moves by several times.
Gold itself is overdue for a major new upleg driven by investment demand returning. As I discussed several weeks ago, investment demand has stalled thanks to the extreme stock-market euphoria. These bubble-valued stock markets are due to roll over imminently as the Fed and European Central Bank both start aggressively choking off liquidity. That will strangle this stock bull, reigniting big gold investment demand.
The impact of higher gold prices on mid-tier-gold-miner profitability is easy to model. Assuming flat all-in sustaining costs at Q3’17’s $877 per ounce, 10%, 20%, and 30% gold rallies from this week’s levels will lead to collective gold-mining profits surging 36%, 68%, and 100%! And another 30% gold upleg isn’t a stretch at all. In essentially the first half of 2016 alone after the last stock-market correction, gold surged 29.9%.
The major gold stocks as measured by the HUI, which closely mirrors GDX, skyrocketed 182.2% higher in roughly that same span! Gold-mining profits and thus gold-stock prices soar when gold is powering higher. So if you believe gold is heading higher in coming quarters as these crazy stock markets falter, the gold stocks are screaming buys today fundamentally. That’s especially true of the best mid-tier gold miners.
Since today’s bastardized GDXJ mostly devoid of juniors changed so radically since last year, the normal year-over-year comparisons in key financial results aren’t comparable. But here they are for reference. These top 34 GDXJ companies’ cashflows generated from operations soared 65% YoY to $1515m. That was driven by sales up 96% YoY to $4130m. That left miners’ collective cash balances $28% higher YoY at $5672m.
Yet top-34-GDXJ-component profits crumbled 38% YoY to $212m. Again don’t read too much into this since it’s an apples-to-oranges comparison. Interestingly a single company that was in GDXJ in both quarters is responsible for over 2/3rds of that drop. Endeavour Mining’s earnings plunged from +$24m a year ago to -$65m in Q3’17, largely due to a $54m impairment charge in its Nzema mine which is being sold.
GDXJ’s component list was much more consistent between Q2’17 and Q3’17. QoQ these top 34 GDXJ gold miners saw operating cash flows rise 3.9%, sales surge 7.5%, cash on hand fall 7.6%, and profits plummet 72%. Again an anomaly in a single company is responsible for nearly 9/10ths of this sequential decline. In Q2 IAMGOLD reported a gigantic $524m non-cash gain on the reversal of an impairment charge!
The massive non-cash gains and losses flushed through net income are one reason why all-in sustaining costs offer a better read on gold-miner health. If GDXJ’s component list and weightings finally stabilize after this past year’s extreme tumult, we’ll have clean comps again next year. For now these mid-tier gold miners are generally doing far better operationally than their neglected super-low stock prices imply.
So overall the mid-tier gold miners’ fundamentals looked quite impressive in Q3’17, a stark contrast to the miserable sentiment plaguing this sector. Gold stocks’ vexing consolidation this year wasn’t the result of operational struggles, but purely bearish psychology. That will soon shift as the stock markets roll over and gold surges, making the beaten-down gold stocks a coiled spring today. They are overdue to soar again!
Though this contrarian sector is widely despised now, it was the best-performing in all the stock markets last year despite that sharp post-election selloff in Q4. The HUI blasted 64.0% higher in 2016, trouncing the S&P 500’s mere 9.5% gain! Similar huge 50%+ gold-stock gains are likely again in 2018, as gold mean reverts higher on the coming stock-market selloff. The gold miners’ strong Q3 fundamentals prove this.
Given GDXJ’s serious problems, leading to diverting most of its capital inflows into larger gold miners that definitely aren’t juniors, you won’t find sufficient junior-gold exposure in this troubled ETF. Instead traders should prudently deploy capital in the better individual mid-tier and junior gold miners’ stocks with superior fundamentals. Their upside is vast, and would trounce GDXJ’s even if it was still working as advertised.
At Zeal we’ve literally spent tens of thousands of hours researching individual gold stocks and markets, so we can better decide what to trade and when. As of the end of Q3, this has resulted in 967 stock trades recommended in real-time to our newsletter subscribers since 2001. Fighting the crowd to buy low and sell high is very profitable, as all these trades averaged stellar annualized realized gains of +19.9%!
The key to this success is staying informed and being contrarian. That means buying low when others are scared, like late in this year’s vexing consolidation. An easy way to keep abreast is through our acclaimed weekly and monthly newsletters. They draw on my vast experience, knowledge, wisdom, and ongoing research to explain what’s going on in the markets, why, and how to trade them with specific stocks. Easy to read and affordable, they’ll help you learn to think, trade, and thrive like contrarians. Subscribe today, and get deployed in the great gold stocks on our trading books before they surge far higher!
The bottom line is the mid-tier gold miners now dominating GDXJ enjoyed strong fundamentals in their recently-reported Q3 results. While GDXJ’s radical composition changes since last year muddy annual comparisons, today’s components mined lots more gold at lower costs. These gold miners continued to earn hefty operating profits while generating strong cash flows. Sooner or later stock prices must reflect fundamentals.
As gold itself continues mean reverting higher, these mid-tier gold miners will see their profits soar due to their big inherent leverage to gold. GDXJ now offers excellent exposure to mid-tier gold miners, which will see gains well outpacing the majors. All it will take to ignite gold stocks’ overdue mean-reversion rally is gold investment demand returning. The resulting higher gold prices will attract investors back to gold miners.
Adam Hamilton, CPA
December 1, 2017
Copyright 2000 – 2017 Zeal LLC (www.ZealLLC.com)
The silver miners’ stocks have largely languished this year, grinding sideways near lows for months on end. This vexing consolidation has fueled near-universal bearishness, leaving silver stocks deeply out of favor. But once a quarter when earnings season arrives, hard fundamentals pierce the obscuring veil of popular sentiment. The silver miners’ recently-reported Q2’17 results reveal today’s silver prices remain profitable.
Four times a year publicly-traded companies release treasure troves of valuable information in the form of quarterly reports. These are generally due by 45 days after quarter-ends in the US and Canada. They offer true and clear snapshots of what’s really going on operationally, shattering the misconceptions bred by the ever-shifting winds of sentiment. There’s no silver-miner data that is more highly anticipated than quarterlies.
Silver mining is a tough business both geologically and economically. Primary silver deposits, those with enough silver to generate over half their revenues when mined, are quite rare. Most of the world’s silver ore formed alongside base metals or gold, and their value usually well outweighs silver’s. So typically in any given year, less than a third of the global mined silver supply actually comes from primary silver mines!
The world authority on silver supply-and-demand fundamentals is the Silver Institute. Back in mid-May it released its latest annual World Silver Survey, which covered 2016. Last year only 30% of silver mined came from primary silver mines, a slight increase. The remaining 70% of silver produced was simply a byproduct. 35% of the total mined supply came from lead/zinc mines, 23% from copper, and 12% from gold.
As scarce as silver-heavy deposits supporting primary silver mines are, primary silver miners are even rarer. Since silver is so much less valuable than gold, most silver miners need multiple mines in order to generate sufficient cash flows. These often include non-primary-silver ones, usually gold. More and more traditional elite silver miners are aggressively bolstering their gold production, often at silver’s expense.
So the universe of major silver miners is pretty small, and their purity is shrinking. The definitive list of these companies to analyze comes from the most-popular silver-stock investment vehicle, the SIL Global X Silver Miners ETF. This week its net assets are running 6.0x greater than its next-largest competitor’s, so SIL really dominates this space. With ETF investing now the norm, SIL is a boon for its component miners.
While there aren’t many silver miners to pick from, major-ETF inclusion shows silver stocks have been vetted by elite analysts. Due to fund flows into top sector ETFs, being included in SIL is one of the important considerations for picking great silver stocks. When the vast pools of fund capital seek silver-stock exposure, their SIL inflows force it to buy shares in its underlying companies bidding their prices higher.
Back in mid-August as the major silver miners finished reporting their Q2’17 results, SIL included 29 “silver miners”. This term is used loosely, as SIL includes plenty of companies which can’t be described as primary silver miners. Most generate well under half their revenues from silver, which greatly limits their stock prices’ leverage to silver rallies. Nevertheless, SIL is today’s leading silver-stock ETF and benchmark.
The higher the percentage of sales any miner derives from silver, naturally the greater its exposure to silver-price moves. If a company only earns 20%, 30%, or even 40% of its revenues from silver, it’s not a primary silver miner and its stock price won’t be very responsive to silver itself. But as silver miners are increasingly actively diversifying into gold, there aren’t enough big primary silver miners left to build an ETF alone.
Every quarter I dig into the latest results from the major silver miners of SIL to get a better understanding of how they and this industry are faring fundamentally. I feed a bunch of data into a big spreadsheet, some of which made it into the table below. It includes key data for the top 17 SIL component companies, an arbitrary number that fits in this table. That’s a commanding sample at 93.2% of SIL’s total weighting.
While most of these top 17 SIL components had reported on Q2’17 by mid-August, not all had. Some of these major silver miners trade in the UK or Mexico, where financial results are only required in half-year increments. If a field is left blank in this table, it means that data wasn’t available by the end of Q2’s earnings season. Some of SIL’s components also report in gold-centric terms, excluding silver-specific data.
In this table the first couple columns show each SIL component’s symbol and weighting within this ETF as of mid-August. While most of these silver stocks trade in the States, not all of them do. So if you can’t find one of these symbols, it’s a listing from a company’s primary foreign stock exchange. That’s followed by each company’s Q2’17 silver production in ounces, along with its absolute year-over-year change.
After that comes this same quarter’s gold production. Pretty much every major silver miner in SIL also produces significant-if-not-large amounts of gold. While gold stabilizes and augments the silver miners’ cash flows, it also retards their stocks’ sensitivity to silver itself. Naturally investors and speculators buy silver stocks and their ETFs because they want leveraged upside exposure to silver’s price, not gold’s.
So the next column reveals how pure the elite SIL silver miners are. This is mostly calculated by taking a company’s Q2 silver production, multiplying it by Q2’s average silver price, and then dividing that by the company’s total quarterly sales. If miners didn’t report Q2 revenues, I approximated them by adding the silver sales to gold sales based on their quarterly production and these metals’ average second-quarter prices.
Then comes the most-important fundamental data for silver miners, cash costs and all-in sustaining costs per ounce mined. The latter determines their profitability and hence ultimately stock prices. Those are also followed by YoY changes. Finally comes the YoY changes in cash flows generated from operations and GAAP profits. But an exception is necessary for companies with numbers that crossed zero since Q2’16.
Percentage changes aren’t relevant or meaningful if data shifted from negative to positive or vice versa. Plenty of major silver miners suffered net losses in Q2’17 after earning profits in Q2’16. So in cases where data crossed that zero line, I included the raw numbers instead. This whole dataset offers a fantastic high-level fundamental read on how the major silver miners are faring today, and it’s reasonably well.
That’s reassuring given silver’s serious under-performance relative to gold this year. As a far-smaller market, silver usually amplifies gold’s advances by at least 2x. But as of the end of Q2, silver was only up 4.5% YTD compared to 7.9% for gold. That’s dismal 0.6x leverage. And by mid-August as Q2’s earnings season wrapped up, silver’s YTD gain of 4.6% fell even further behind gold’s 10.6%. That’s horrible 0.4x leverage!
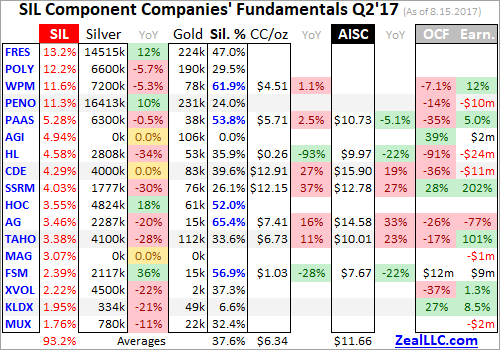
Production is the lifeblood of mining companies, and thus the best place to start fundamental analysis. In Q2’17, these top 17 SIL components collectively produced an impressive 78.6m ozs of silver. If 2016’s world-silver-mining run rate is applied to this year’s second quarter, that implies 221.5m ozs of silver mined. Thus these top SIL silver miners would account for over 35% of that total, they truly are major silver players.
But these elites still weren’t able to significantly grow their collective silver production, it was up just 0.9% YoY. Instead they invested heavily in expanding their gold production, which surged 6.4% YoY to 1354k ounces. Interestingly 10 of these top 17 SIL components, a majority representing 45.3% of SIL’s total weighting, are also included in the leading GDX gold miners’ ETF. SIL is mostly made up of primary gold miners!
Many of these elite major silver miners don’t just mine gold as a silver byproduct, but actually operate at least one primary gold mine. The silver miners have collectively decided to diversify into gold due to its superior economics. Consider hypothetical mid-sized silver and gold miners, which might produce 10m and 300k ounces annually. What would those cash flows look like at last quarter’s average metals’ prices?
In Q2’17, silver and gold averaged $17.18 and $1258. Silver was up 2.3% YoY, while gold slipped by a slight 0.1% YoY. At 10m ounces, that silver miner would generate $172m in sales. But the similar-sized gold miner’s sales of $377m more than doubles that. At recent years’ prevailing prices, the cash flows from gold mining are much more robust than those from silver mining. That makes it easier to pay bills and expand.
Silver mining is often as capital-intensive as gold mining, requiring similar large expenses for planning, permitting, and constructing mines and mills to process ore. Similar heavy excavators and haul trucks are necessary to dig and haul the ore, along with similar staffing levels to run mines. So silver’s lower cash flows to support all this activity make silver mining harder than gold mining, which isn’t lost on silver miners.
Silver-mining profits do skyrocket when silver soars occasionally in one of its massive bull markets. But during silver’s long intervening drifts at relatively-low price levels, the silver miners often can’t generate sufficient cash flows to finance expansions. So the top silver miners are increasingly looking to gold, a trend that isn’t likely to reverse given the relative economics of silver and gold. Primary silver miners are getting rarer.
Technically a company isn’t a primary silver miner unless it derives over half its revenues from silver. In Q2’17, the average sales percentage from silver of these top SIL components was just 37.6%! That is right on trend over this past year, with Q2’16, Q3’16, Q4’16, and Q1’17 weighing in at 46.3%, 38.5%, 40.5%, and 37.9%. In Q2’17, only 5 of the top SIL component companies qualified as primary silver miners!
While I understand this, as a long-time silver-stock investor it saddens me primary silver miners have apparently become a dying breed. When silver starts powering higher in one of its gigantic uplegs and way outperforms gold again, this industry’s silver percentage will rise. But unless silver not only shoots far ahead but stays there while gold lags, it’s hard to see major-silver-mining purity significantly reversing.
Unfortunately SIL’s mid-August composition was such that there wasn’t a lot of Q2 cost data reported by its top component miners. 3 of its top 4 companies trade in the UK and Mexico, where reporting only comes in half-year increments. Lower down the list there are more half-year reporters, an explorer with no production, and primary gold miners that don’t report silver costs. So silver cost data was fairly scarce.
Nevertheless, it’s always useful to look at the data we have. Industry wide silver-mining costs are one of the most-critical fundamental data points for silver-stock investors. As long as the miners can produce silver for well under prevailing silver prices, they remain fundamentally sound. Cost knowledge helps traders weather this sector’s fear-driven plunges without succumbing to selling low like the rest of the herd.
There are two major ways to measure silver-mining costs, classic cash costs per ounce and the superior all-in sustaining costs. Both are useful metrics. Cash costs are the acid test of silver-miner survivability in lower-silver-price environments, revealing the worst-case silver levels necessary to keep the mines running. All-in sustaining costs show where silver needs to trade to maintain current mining tempos indefinitely.
Cash costs naturally encompass all cash expenses necessary to produce each ounce of silver, including all direct production costs, mine-level administration, smelting, refining, transport, regulatory, royalty, and tax expenses. In Q2’17, these top 17 SIL-component silver miners that reported cash costs averaged $6.34 per ounce. That surged a major 19.1% YoY from Q2’16’s $5.32, which seems like a troubling omen.
But it’s not. Flighty silver-stock investors are always on the verge of panicking, fleeing this volatile and psychologically-challenging sector. But the only event worthy of such extreme bearishness would be prevailing silver prices falling near cash costs. And even at $6.34-per-ounce cash costs and today’s low silver, a vast buffer exists. There’s no way silver is going to plummet down under $7 in any conceivable scenario!
These high cash costs are actually an anomaly mainly driven by two companies. First, SSR Mining (TSX: SRR) is now winding down its rapidly-depleting silver mine as planned. It produced 10.4 million ounces of silver in 2016, but only 5.5m is forecast this year! As silver throughput drops each quarter, the per-ounce costs are rising. Without SSRM’s outlying super-high cash costs, the rest of these top SIL miners averaged just $5.51.
Another company Silvercorp Metals (TSX: SVM) had slid out of SIL’s top 17 components as of mid-August. It was the 18th one, removing it from this particular calculation. Due to SVM’s enormous lead and zinc byproducts, its costs are the lowest in the industry. In Q2’16 it reported cash costs of $0.08 per ounce, which really dragged down that comp-quarter average. So the major silver miners’ collective cash costs were just fine in Q2.
Way more important than cash costs are the far-superior all-in sustaining costs. They were introduced by the World Gold Council in June 2013 to give investors a much-better understanding of what it really costs to maintain a silver mine as an ongoing concern. AISC include all direct cash costs, but then add on everything else that is necessary to maintain and replenish operations at current silver-production levels.
These additional expenses include exploration for new silver to mine to replace depleting deposits, mine-development and construction expenses, remediation, and mine reclamation. They also include the corporate-level administration expenses necessary to oversee silver mines. All-in sustaining costs are the most-important silver-mining cost metric by far for investors, revealing silver miners’ true operating profitability.
In Q2’17, these top 17 SIL components reporting AISC averaged $11.66 per ounce. That was up 16.0% YoY from Q2’16s $10.05. Coeur Mining was a big factor, with AISC surging 19% to a lofty $15.90 per ounce! That was due to lower-grade ore on the way to better zones. Ex-CDE, this average ran $10.96 which was closer to year-ago levels. SVM was also a factor, with low $7.06 AISC feeding into Q2’16 comps.
Two other elite silver miners suffered major production problems in Q2’17, resulting in big production drops. With fewer ounces to spread mining’s heavy fixed costs across, all-in sustaining costs soared. First Majestic Silver (TSX: FR), the purest major silver miner at 65.4% of Q2 revenues, saw production fall 20% YoY which forced AISC 33% higher. Unprecedented labor unrest in Mexico temporarily halted 3 of its 6 silver mines.
Those issues have since been resolved, so AG’s production should bounce back in Q3 which will push its AISC back down. Meanwhile Tahoe Resources (TSX: THO) saw its Q2 production plunge 28% YoY forcing its own AISC 23% higher. It got sucked into a legal battle between anti-mining activists and the government of Guatemala where its silver mine is. That mining license was temporarily suspended for an unmerited lawsuit.
The activists allege the government shouldn’t have granted Tahoe its Escobal mining license in the first place because it didn’t consult with a particular indigenous tribe first. But those people don’t even live anywhere near the mine site, it’s ridiculous! Tahoe doesn’t know when Escobal operations will be allowed to resume, but estimates a range between a couple months from now out to 18 months for a full resolution.
Tahoe’s large gold production from its two other gold mines in Peru, 110k ounces in Q2’17, ensures it won’t have any serious problems weathering this Guatemalan nightmare. But the point for our purposes today is that anomalous special situations fed the steep jump in the major silver miners’ all-in sustaining costs in Q2. But even at these elevated levels, this industry is still enjoying hefty silver-mining margins.
At $11.66 AISC, the major silver miners still earned big profits in the second quarter. Once again silver averaged $17.18, implying fat profit margins of $5.52 per ounce or 32%! Most industries would kill for such margins, yet silver-stock investors are always worried silver prices are too low for miners to thrive. That’s why it’s so important to study fundamentals, because technical price action fuels misleading sentiment!
Today’s silver price remains really low relative to prevailing gold levels, which portends huge upside as it mean reverts higher. The long-term average Silver/Gold Ratio runs around 56, which means it takes 56 ounces of silver to equal the value of one ounce of gold. Silver is really underperforming gold so far in 2017, with the SGR averaging just 72.6 YTD as of mid-August. So silver is overdue to catch up with gold.
At a 56 SGR and $1300 gold, silver is easily heading near $23.25. That’s 35% above its Q2 average. Assuming the major silver miners’ all-in sustaining costs hold, that implies profits per ounce soaring 110% higher! Plug in a higher gold price or the typical mean-reversion overshoot after an SGR extreme, and the silver-mining profits upside is far greater. Silver miners’ inherent profits leverage to rising silver is incredible.
Still Q2’17’s relatively-weak silver price weighed on miners’ cash flows generated from operations and GAAP accounting profits. Despite their big gold production, operating cash flows plunged 28.4% YoY to $1038m for these top SIL components. That’s not quite a righteous comparison though, because only 13 of this year’s top 17 had reported Q2 financial results by mid-August. Last year that number totaled 15.
And one of the silver miners not reporting OCF by the usual Q2 deadline this year was the Mexican silver giant Fresnillo (NASDAQ: FNLPF). Its OCF last year was fully 1/6th of these top SIL components’ total! So their operating-cash-flows situation in Q2’17 is nowhere near as bad as the drop implies. The same is true on the GAAP-earnings front. Last year Fresnillo contributed nearly 22% of the profits of these top 17 SIL components.
Another huge Mexican silver miner, the conglomerate Industrias Penoles (NASDAQ: IPOAF), saw its profits plunge about $140m YoY. These two Mexican silver giants alone account for the entire drop in these top SIL miners’ profits in Q2’17, which plummeted 57.5% YoY or $221m. Without them, silver-mining profits were flat. That’s pretty darned good considering all the super-anomalous company-specific problems that plagued Q2 results.
Silver miners’ earnings power and thus stock-price upside potential will only grow as silver mean reverts higher. In mining, costs are largely fixed during the mine-planning stages. That’s when engineers decide which ore bodies to mine, how to dig to them, and how to process that ore. Quarter after quarter, the same numbers of employees, haul trucks, excavators, and mills are generally used regardless of silver prices.
So as silver powers higher in coming quarters, silver-mining profits will really leverage its advance. And that will fundamentally support far-higher silver-stock prices. The investors who will make out like bandits on this are the early contrarians willing to buy in low, before everyone else realizes what is coming. By the time silver surges higher with gold so silver stocks regain favor again, the big gains will have already been won.
While investors and speculators alike can certainly play the silver miners’ ongoing mean-reversion bull with this leading SIL ETF, individual silver stocks with superior fundamentals will enjoy the best gains by far. Their upside will trounce the ETFs’, which are burdened by companies that don’t generate much of their sales from silver. A handpicked portfolio of purer elite silver miners will yield much-greater wealth creation.
At Zeal we’ve literally spent tens of thousands of hours researching individual silver stocks and markets, so we can better decide what to trade and when. As of the end of Q2, this has resulted in 951 stock trades recommended in real-time to our newsletter subscribers since 2001. Fighting the crowd to buy low and sell high is very profitable, as all these trades averaged stellar annualized realized gains of +21.2%!
The key to this success is staying informed and being contrarian. That means diligently studying and buying great silver stocks before they grow popular again, when they’re still cheap. An easy way to keep abreast is through our acclaimed weekly and monthly newsletters. They draw on our vast experience, knowledge, wisdom, and ongoing research to explain what’s going on in the markets, why, and how to trade them with specific stocks. For just $10 per issue, you can learn to think, trade, and thrive like contrarians. Subscribe today and get deployed in great silver stocks before they surge far higher!
The bottom line is the major silver miners fared fine in Q2 despite some real challenges. A combination of silver continuing to seriously lag gold, along with anomalous company-specific problems, weighed on miners’ collective results. Yet they continued to produce silver at all-in sustaining costs way below Q2’s low prevailing silver prices. And their accelerating gold-production growth leaves them financially stronger.
With silver-stock sentiment remaining excessively bearish, this sector is primed to soar as silver itself continues mean reverting higher to catch up with gold’s current upleg. The silver miners’ profits leverage to rising silver prices remains outstanding. After fleeing silver stocks so aggressively this year, investors and speculators alike will have to do big buying to reestablish silver-mining positions. That will fuel major upside.
Adam Hamilton, CPA
September 1, 2017
Copyright 2000 – 2017 Zeal LLC (www.ZealLLC.com)
If you would like to receive our free newsletter via email, simply enter your email address below & click subscribe.
 Follow us on Twitter
 Become our facebook fan
CONNECT WITH US
Tweets
Tweet with hash tag #miningfeeds or @miningfeeds and your tweets will be displayed across this site.
MOST ACTIVE MINING STOCKS
Daily Gainers
 CMC Metals Ltd. CMC Metals Ltd. |
CMB.V | +900.00% |
 Eden Energy Ltd Eden Energy Ltd |
EDE.AX | +200.00% |
| GoviEx Uranium Inc. |
GXU.V | +42.86% |
| Eagle Nickel Ltd. |
ENL.AX | +41.67% |
| Citigold Corp. Limited |
CTO.AX | +33.33% |
| Mount Burgess Mining NL |
MTB.AX | +33.33% |
| Exalt Resources Limited |
ERD.AX | +31.94% |
| Casa Minerals Inc. |
CASA.V | +30.00% |
| Cariboo Rose Resources Ltd |
CRB.V | +28.57% |
| Belmont Resources Inc. |
BEA.V | +28.57% |