
GoGold Resources (GGD.TO, C$0.71) is a company with assets in Mexico, both a producing and an exploration-stage project. Led by a management team that has over 27 years of experience in the country. The team developed 4 projects/companies that eventually got sold with at a good to hefty premium. Examples are: Gammon Gold ($1.5B merge with Alamos), Mexgold (sold for $375M), Nayarit ($80M, bought for $40M) and recently, the Santa Gertrudis project they sold to AEM for $96M (bought for $11M).
CEO Brad Langille is the second largest shareholder and holds 9.5% of outstanding shares. Biggest shareholder is Fred George, who was founding member of Gammon Gold. He led the development of the Ocampo project from exploration stage to one of the biggest silver and gold projects in Mexico, currently operated by Minera Frisco. Fred George owns about 14% of outstanding shares. Management combined owns over 30%.
Financial position is strong as they had C$9M in liquidity (cash + Metalla shares) at the end of the second quarter. After finishing the sale of the Santa Gertrudis project, they decided to pay off their remaining debt which leaves them debt-free.
Parral
After the sale of Santa Gertrudis, GoGold has two projects left. One of them is the young producing heap leaching mine of Parral, which is right next to the Mexican city of Chihuahua. This mine started its fifth year and is currently on a record streak: For the second consecutive quarter a beat in production and well on its way to reach 1.8Moz of silver equivalent. AISC is declining and currently sits at US$13.61/oz. Their realized silver price for the quarter was US$14.55, which gave them a 6.9% margin in Q2. As silver is a lot higher now than in Q2, we can assume a conservative realized price of US$17/oz for Q3. If AISC remains the same, their margin would rise to 24.9% or an increase of 261% quarter over quarter.
In June of this year, the company announced the build of a SART installation at their Parral mine. This will help lower costs of heap leaching and provide a saleable copper concentrate. This plant will see its first full operational quarter in Q1 of 2020. This should give a substantial decrease in AISC and add some revenue through the copper concentrate.
Their Parral mine will allow them to internally finance their exploration. Shareholders are protected from dilution through capital raises. In coming quarters, production will continue to rise towards 550-600Koz AgEq. Q2 saw 440Koz so we can expect further “records” in coming headlines. During my contact with management I received the following words:
“The cashflow we produce form Parral will fund our operations, G&A, and our exploration at Los Ricos and this is why we say we are a self-funding junior and do not need to raise money for the foreseeable future.”
Parral has a remaining mine life of 8 years and the proportion silver/gold in dollar value is about 55% silver and 45% gold. So despite of what you might read in their name, GoGold is mostly a silver producer.
Los Ricos
The Los Ricos project is my main reason to hold GoGold in my portfolio. The project has seen commercial production between 1908-1929. Production has been terminated at the start of the Great Depression. At the time of production, they kept track of the production data. Through this data we learn that the project was mined to a depth of 500m on different levels. Average values of 800g/t silver and 4g/t gold.
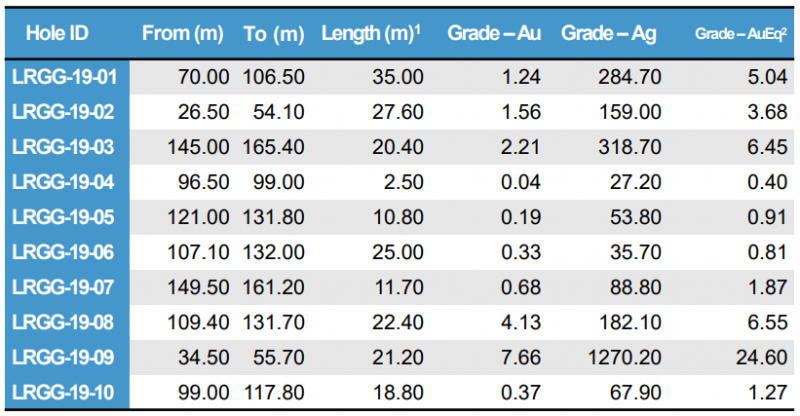
The project has about 65 historic drill results, which GoGold is trying to confirm with their own drill program. Up until today, they are succeeding well in this. Best hit: 21m of 7.66g/t gold and 1,270g/t silver (or 21m of 24.6g/t AuEq). Below I added the results of the first 10 drill holes by GoGold. Note that these are all 10 of them and not one has been left out mysteriously. By now the project has expanded to 37 drill results. I looked at all of these: Not one miss and on average thick mineralization with high values of gold and silver.
I recently felt an urgency to buy this company and this had nothing to do with silver taking off. In May, the company announced trenching results from a 3.2km strike. In this news release, GoGold told investors they would move a drill to the Cerro Colorado zone. This area has the ‘high priority drill area’ tag attached in the image below. Cerro Colorado is at the end of this strike and 1,500m away from the edge of the main zone.
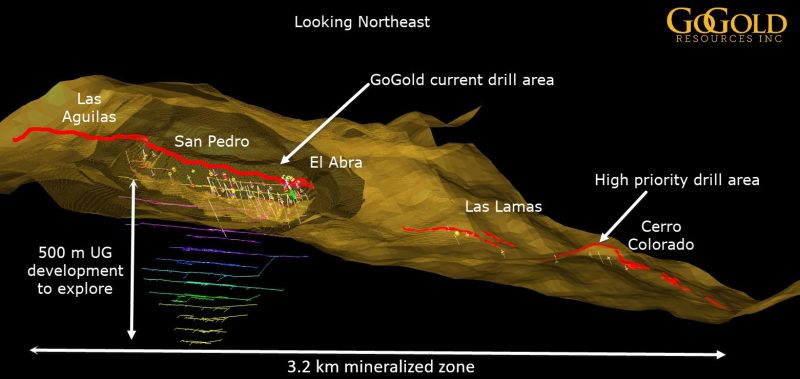
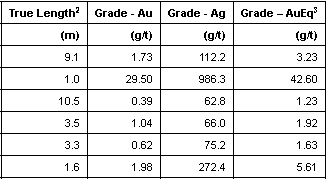
These first results of the Cerro Colorado zone seem to point to a big system. All 7 of these drill results show more high grade and thick gold and silver mineralization. As you can see in the image (above), there’s the ‘Las Lamas’ zone in between that 1,500m stepout. Below you find the results of the trenching GoGold did there. Management confirmed they would drill that target as well.
Since GoGold purchased the Los Ricos project, their share price has tripled. The silver price is largely a cause of this, but nonetheless an outperformance in the silver space. The Los Ricos project is a mere 6 months in their posession and the market is starting to notice. Should be, considering these drill results and potential. CEO Brad Langille recently noted that he’s been following this project for over 8 years and feels this is the most exciting project of his carreer. Talk is cheap of course, but seeing he upped his stake by 500,000 shares this year, is reason to take note.
The company is working on a maiden resource for Los Ricos, which they plan on delivering in the first quarter of 2020. Recently, they uploaded a VRIFY model on their website (link: https://gogoldresources.com/properties/los-ricos). CEO Langille wants to roll out this project on the Precious Metals Summit and Denver Gold Forum. Personally I believe this company will get some interest over the course of the next weeks. These presentations should be the start of this.
CEO Langille sees the Los Ricos project as an open pit mine with multi million ounces of high grade gold and silver. According to him this will be of similar, if not bigger size than the Ocampo mine which he helped build and eventually was valued at US$750M. Again, quotes like these are only to be given weight if supported by elevated insider ownership and preferably insider open market purchases. I see both here.
There’s only 1 analyst following this. HC Wainwright that has a current price target of C$0.80/share. Note that this is based on a realized silver price of US$15/oz, gold price of U$1,300 and doesn’t ascribe any value to the Los Ricos project.
Conclusion
- I upped my stake in this company after their Cerro Colorado drill results. I’m comfortable here because of the following reasons:
- Management with proven track record and a lot of their own money in the company
- A producing asset which is seeing rising production and margins
- No need for financing so no dilution
- Big players have to buy in the market, which was confirmed by management
- Los Ricos could be a world class deposit
- Lots of catalysts nearby:
exploration results - promotion of Los Ricos
- rising earnings at ParrJonas De Roose
September 18, 2019
- Is the gold price reaction over?
- Well, since the rally began in the $1170 area, corrections have not lasted very long.
- After rallying to the $1566 area, gold has pulled back to about $1500. Please click here now: https://gracelandupdates.com/wordpress/wp-content/uploads/2019/09/2019sep10gold1.png Double-click to enlarge. Strong trend line support is already in play.
- Investors need to keep an open mind; it’s possible that the $1500 area is now support rather than resistance, and gold is set to rally towards the $1600-$1700 area.
- Please click here now: https://gracelandupdates.com/wordpress/wp-content/uploads/2019/09/2019sep10gold2.png Double-click to enlarge. Note the lows in the $1526 area in the 2011-2012 timeframe.
- Those lows may now be functioning as support as gold reacts from the $1566 area highs. Also, $1500 is a key round number that may now be functioning as support rather than resistance for institutional money managers.
- Indian festival buying may be picking up as well. Indians have been waiting for a decent pullback for months, and now it is here.
- Please click here now: https://gracelandupdates.com/wordpress/wp-content/uploads/2019/09/2019sep10trustydusty.png Double-click to enlarge this GDX swing trade chart.
- I recommend that most gold investors should consider allocating some capital to a swing trade program.
- My guswinger.com system has been in DUST-NYSE as GDX been “spanked”, and it’s now time to book solid profit on at least a portion of the position.
- Note the key low on the GDX chart at $27.61. If it’s violated, GDX could decline to the $26.04 area. Having said that, proper tactics can reduce investor risk dramatically.
- My suggestion to core position enthusiasts is to buy some gold stock now, and more if there is a deeper reaction. A stop order can be placed just under the $27.61 low.
- Investors who don’t like stops can also buy the $27.61 area…with very small size.
- Please click here now: https://gracelandupdates.com/wordpress/wp-content/uploads/2019/09/2019sep10gdx1.png Double-click to enlarge. If the inverse H&S bottom on this weekly GDX chart is legitimate, the current reaction is likely to be very shallow and may already be ending.
- The target of the pattern is about $50. The biggest risk investors face now is not drawdowns, but rather missing out on a major run higher in most of the world’s quality miners!
- Please click here now: https://gracelandupdates.com/wordpress/wp-content/uploads/2019/09/2019sep10trade1.png The global economy continues to weaken, and politicians do nothing but spend, borrow, and beg for more QE and negative rates.
- That’s pouring gas on the fire. Negative rates and QE incentivize governments to go even deeper into debt.
- Please click here now: “In the next credit cycle downturn, then, the generally lower credit quality of today’s speculative-grade population means that the default count could exceed the Great Recession peak of 14% of all rated issuers….” – Christina Padgett, Moody’s VP, Sep 9, 2019.
- This is spectacular news for gold!
- Please click here now: https://gracelandupdates.com/wordpress/wp-content/uploads/2019/09/2019sep10gdxj1.png Double-click to enlarge this GDXJ chart.
- As expected, GDXJ looks a bit more vulnerable than GDX in the short-term. Having said that, it’s important for investors to be as open to a surge above $43 as to a pullback to $33-$35.
- An upside breakout would open the door to a massive run higher, and whether investors pay a “ticket price” of $33 or $43 for their GDXJ ride really doesn’t matter.
- The rise of China and India is not going away. The decline of the West is not going away. These forces are destabilizing the dollar and ushering in a bull era for gold, silver, and associated miners.
- It’s no longer as important to avoid price reactions as it is to stay invested and buy breakouts. As stagflation grows, this gold market will become very similar to the 1970s market… on a much bigger scale!
Special Offer For Website Readers: Please send me an Email to freereports4@gracelandupdates.com and I’ll send you my free “Super Seniors On The Move” report. I highlight key senior miners that are trading under $20 that are showcasing fabulous relative strength versus the gold ETFs. I include important wealth building tactics for investors!
Stewart Thomson
September 11, 2019
Email:
Stewart Thomson is a retired Merrill Lynch broker. Stewart writes the Graceland Updates daily between 4am-7am. They are sent out around 8am-9am. The newsletter is attractively priced and the format is a unique numbered point form. Giving clarity of each point and saving valuable reading time.
Risks, Disclaimers, Legal
Stewart Thomson is no longer an investment advisor. The information provided by Stewart and Graceland Updates is for general information purposes only. Before taking any action on any investment, it is imperative that you consult with multiple properly licensed, experienced and qualified investment advisors and get numerous opinions before taking any action. Your minimum risk on any investment in the world is: 100% loss of all your money. You may be taking or preparing to take leveraged positions in investments and not know it, exposing yourself to unlimited risks. This is highly concerning if you are an investor in any derivatives products. There is an approx $700 trillion OTC Derivatives Iceberg with a tiny portion written off officially. The bottom line:
Are You Prepared?
A few weeks ago we wrote that precious metals were at risk of a correction.
First, they powered higher. But last week they ran into technical resistance levels that date back well beyond only a few years.
This is true for Gold, Silver as well as the miner ETFs: GDX and GDXJ.
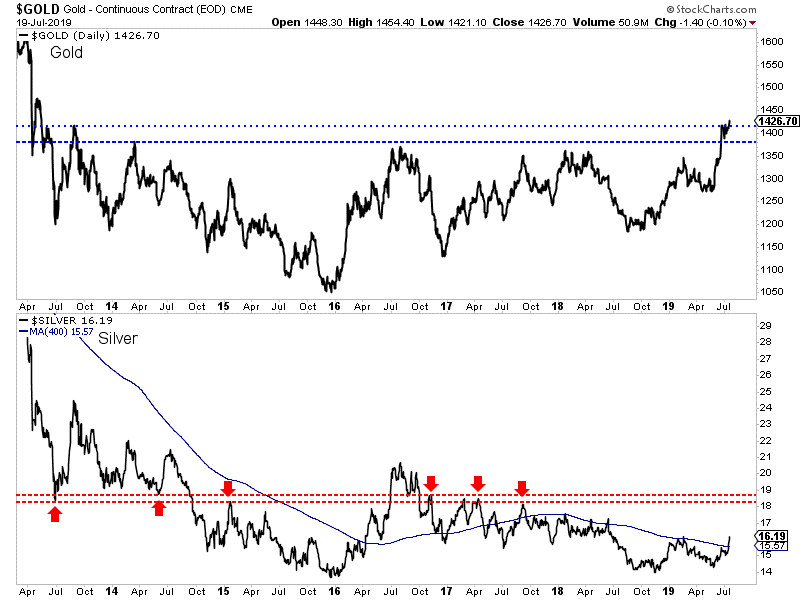
Starting with Gold, we can see that it has struggled to get through $1550/oz. That’s not a surprise as we pointed out this level as resistance since Gold surpassed $1370/oz.
The combination of multi-year resistance at $1550/oz and the current high net speculative position could force Gold down to a retest of $1400/oz.
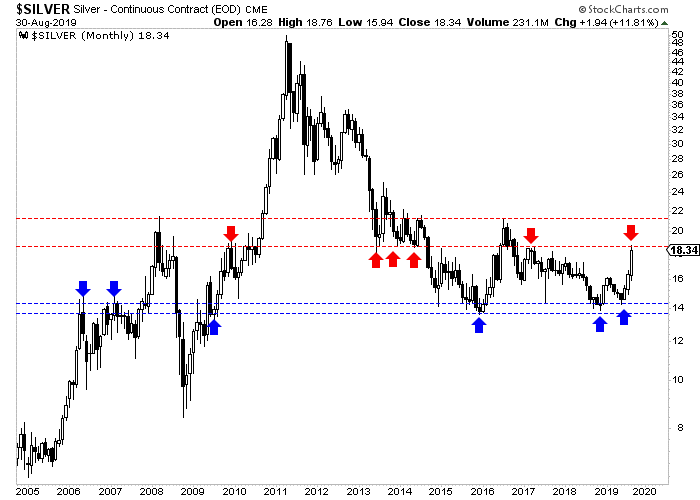
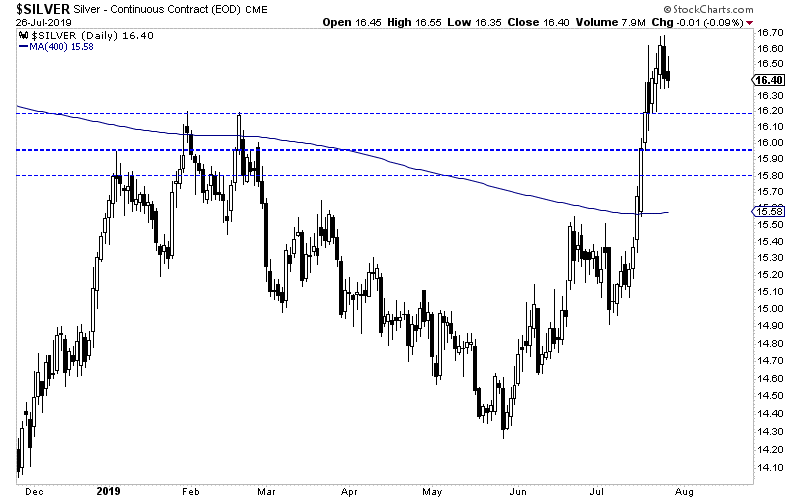
Meanwhile, Silver has been the strongest component of the sector in the short-term.
It closed the month of August right at major resistance in the mid $18s, which as you can see, has been a key level for the last 11 years. A monthly close above $18.50 would be significant but it may not happen until October or November.
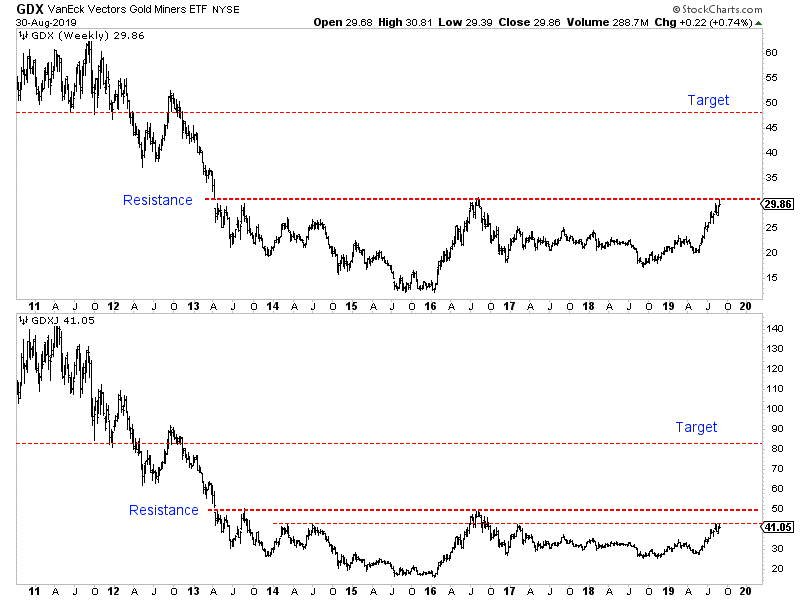
Turning to the stocks, we see that GDX has reached its 2016 high and 6-year resistance. A correction or consolidation for weeks or even a few months would be perfectly normal.
GDXJ has lagged much like Silver as it has yet to reach its 2016 high near $50. However, it is dealing with important resistance at $42 which dates back to 2014.
As summer winds down, the excitement in precious metals is building.
The retail crowd is looking to jump back in for the first time in years and the same can be said for many institutions.
In the big picture, this is the time to jump back in. You do want to get in before the sector makes its next break higher and before GDX and GDXJ surpass multi-year resistance.
However, the immediate risk appears to be to the downside.
Gold, Silver and gold stock ETFs all are at multi-year resistance levels. A correction and consolidation is perfectly normal and should be expected here.
If you missed the recent run then don’t panic. It’s best to exercise patience and wait for weakness. Better value and new opportunities will emerge. To learn the stocks we own and intend to buy that have 3x to 5x potential, consider learning more about our premium service.
By Jordan Roy-Byrne CMT, MFTA
September 5, 2019
Back during the bear market years (it’s nice to be able to write that now), I regularly would compare the declines in Gold, Silver and gold stocks to their past history. It gave us a visual representation of just how bad the forever bear market was and helped us decipher when it might end.
Thankfully that is all behind us.
Now it’s time to compare recent bullish moves to past iterations.
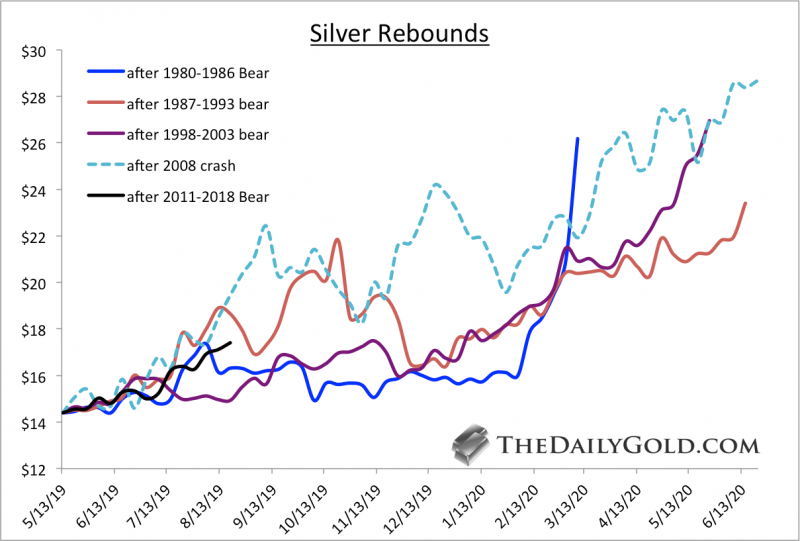
First is Silver.
The recent low in Silver has several good comparisons, which include the lows in 1986, 1993 and 2003. We also included the 2008 low.
If Silver’s rebound were simply an average of the four rebounds shown then it would reach nearly $24 by the end of March 2020.
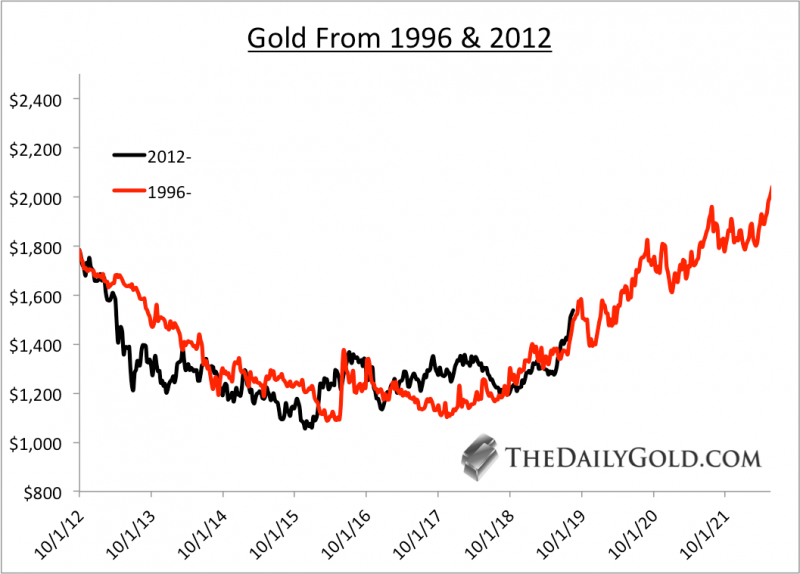
Gold is tricky because there is not an obvious bull comparison. Its major lows were essentially in 1970, 1985 and 1999 to 2001.
However, when we consider the preceding bear market, the best comparison to the recent bear and current bull is the late 1990s and early 2000s.
Mind you, we aren’t forecasting or predicting that 2003 to 2006 will be duplicated over the next three years. It’s possible, but we are simply arguing that the 2012 to 2019 period most resembles 1996 to 2003.
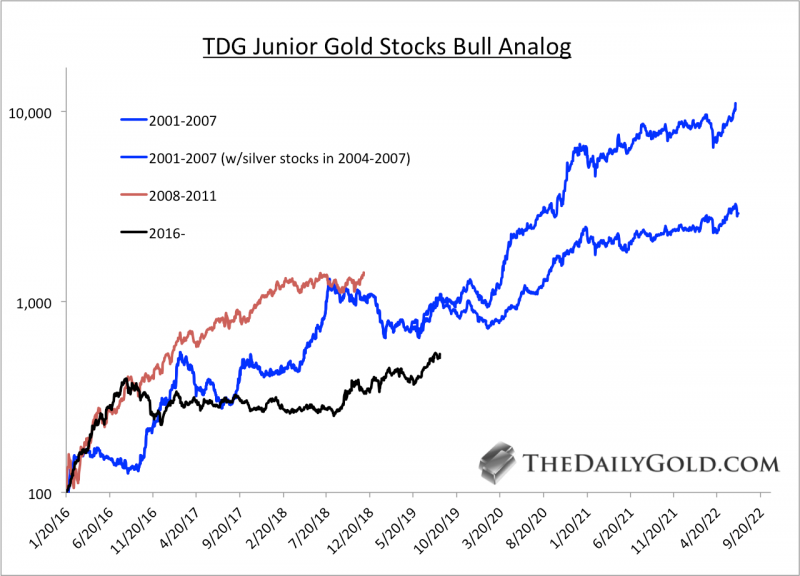
Turning to the gold stocks and specifically the junior gold stocks, here is how the 2016 bottom compares to the bottoms in 2001 and 2008.
Note that the basket of 20 stocks we used is quite strong compared to GDXJ. In other words, we erred on the side of positive performance.
In our new book (available at TheDailyGold.com), we argue that the 2016 low in gold stocks was very similar to the 1957 low.
There are numerous similarities between today and the early to mid 1960s. That includes the gold stocks and their incredible long-term value at the start of a major inflationary cycle.
Below we compare the 1957 and 2016 lows with data from the Barron’s Gold Mining Index, which appreciated over 40-fold from its 1957 low to the peak in 1980.
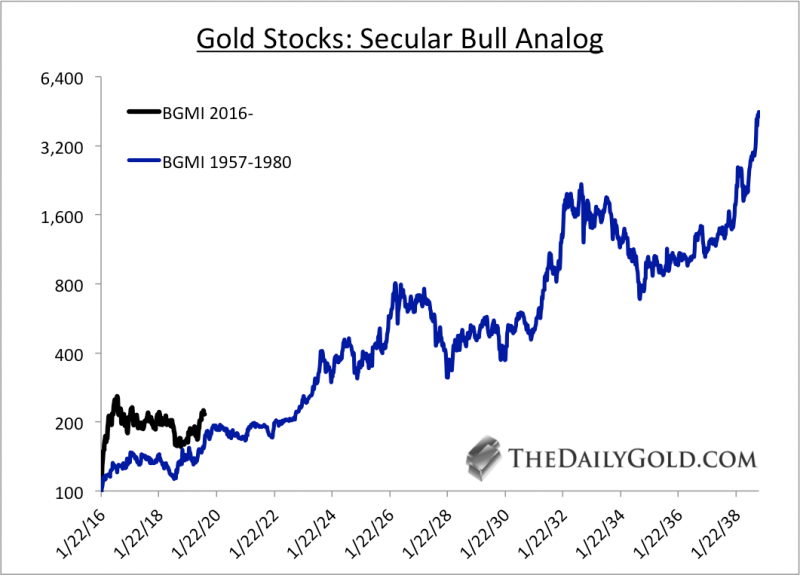
As you can see, if Gold remains in a real bull market then significant upside potential remains in place across the precious metals complex.
Fundamentally, Gold could remain in a bullish trend until the next economic recovery gains traction. That could be anywhere from a few to four years away.
If gold continues to follow the pattern of the early 2000s then it could reach $3000/oz by the start of 2023.
Jordan Roy-Byrne CMT, MFTA
August 28, 2019
- A year ago, I predicted that any U.S. stock market sell-off would be accompanied by a dramatic surge in the price of GDX an GDXJ.
- That’s exactly what happened; the stock market tanked and key gold stocks soared.
- This year, I’m predicting that any major U.S. stock market crash will again be accompanied by the soaring price of the gold producers…
- But I’m also predicting that most CDNX-listed junior explorers are set to soar too!
- Please click here now. America’s top money printing cheerleader (President Trump) brags that his government essentially has the Chinese government cowering in a corner. He claims they are ready to throw in the white towel in the trade war. Reality check:
- It’s obvious that major money managers are becoming very concerned about these tariff taxes.
- Please click here now. Double-click to enlarge this horrifying U.S. stock market chart.
- On the one hand, private enterprise must be respected. Great companies exist and prosper in the socialist nations of Europe and in China. They will continue to prosper.
- The drive of entrepreneurs must never be underestimated, even in the harshest conditions.
- On the other hand, when governments unveil growth-negative policies like tariff taxes and money printing, stock markets can experience dramatic declines. These declines are usually temporary, but they are very painful.
- Please click here now. Double-click to enlarge this important gold stocks versus gold chart.
- I call it the “Just buy” chart, because there really isn’t much else to do here except buy, buy, and buy!
- That’s especially true for core position enthusiasts. Gold stocks are incredibly cheap compared to gold bullion.
- Also, I believe investors can make the most money in the market buying when their analysis has gone awry. On that note, please click here now. Double-click to enlarge my “Golden Beeline” chart.
- Many gold analysts have tried to “top call” gold since the rally from about $1167 began. This has been a mistake and I believe it will continue to be a mistake in the months ahead.
- A gargantuan bull continuation pattern is forming on the weekly gold chart. It’s an inverse H&S pattern with a potential neckline in the $2000 area.
- This is not a time to sell gold or top call it. It’s a time to buy, sit back, and watch those positions fly! Here’s why:
- Institutional money managers are adding gold to their portfolios. These are not highly leveraged hedge funds gambling on the COMEX.
- They are unleveraged institutions. They are serious players who understand the destructive nature of the Trump tariff taxes. These taxes are being implemented as the business cycle peaks and with relentless ramp-up of U.S. government spending and debt.
- This horrifying scenario has superstar managers like Ray Dalio predicting serious inflation and potential rioting in the streets.
- Please click here now: Top money managers are concerned that stagflation is emerging as the Fed is forced to print money and cut rates to offset the taxes. They are not buying gold, silver, and the miners for a “quick flip”. This is long-term allocation.
- Please click here now. Double-click to enlarge this fabulous GDX chart.
- Profit-lock enthusiasts can buy a breakout over $30 and place a stoploss at $27.50. A move above $30 opens the door for a violent surge to $37-$39.
- From there, core positions can be added on a pullback to about $30. Nervous investors can buy put options to manage their emotions, but everyone else should be in “Buy & Fly!” mode alongside the institutional money managers. Today’s Superman is a man of gold and looking at GDX today, I believe he would say… Up, up, and away!
Special Offer For Website Readers: Please send me an Email to freereports4@gracelandupdates.com and I’ll send you my free “Golden Junior Rockets!” report. I highlight junior miners trading under $2/share that are beginning to soar, with key buy and sell prices for each stock.
Thanks,
Stewart Thomson
Graceland Updates
Email:
Stewart Thomson is a retired Merrill Lynch broker. Stewart writes the Graceland Updates daily between 4am-7am. They are sent out around 8am-9am. The newsletter is attractively priced and the format is a unique numbered point form. Giving clarity of each point and saving valuable reading time.
Risks, Disclaimers, Legal
Stewart Thomson is no longer an investment advisor. The information provided by Stewart and Graceland Updates is for general information purposes only. Before taking any action on any investment, it is imperative that you consult with multiple properly licensed, experienced and qualified investment advisors and get numerous opinions before taking any action. Your minimum risk on any investment in the world is: 100% loss of all your money. You may be taking or preparing to take leveraged positions in investments and not know it, exposing yourself to unlimited risks. This is highly concerning if you are an investor in any derivatives products. There is an approx $700 trillion OTC Derivatives Iceberg with a tiny portion written off officially. The bottom line:
Are You Prepared?
The mid-tier gold miners’ stocks have soared in recent months on gold’s decisive bull-market breakout. They are this sector’s sweet spot for stock-price upside potential, with room for strong production growth which investors love. That’s an attractive contrast to the stagnating major gold miners. The mid-tiers’ recently-reported Q2’19 results reveal whether their fundamentals justify their strong surge this summer.
Four times a year publicly-traded companies release treasure troves of valuable information in the form of quarterly reports. Required by the U.S. Securities and Exchange Commission, these 10-Qs and 10-Ks contain the best fundamental data available to traders. They dispel all the sentiment distortions inevitably surrounding prevailing stock-price levels, revealing corporations’ underlying hard fundamental realities.
The global nature of the gold-mining industry complicates efforts to gather this important data. Many mid-tier gold miners trade in Australia, Canada, South Africa, the United Kingdom, and other countries with quite-different reporting requirements. These include half-year reporting rather than quarterly, long 90-day filing deadlines after year-ends, and very-dissimilar presentations of operating and financial results.
The definitive list of mid-tier gold miners to analyze comes from the GDXJ VanEck Vectors Junior Gold Miners ETF. Despite its misleading name, GDXJ is totally dominated by mid-tier gold miners and not juniors. GDXJ is the world’s second-largest gold-stock ETF, with $4.5b of net assets this week. That is only behind its big-brother GDX VanEck Vectors Gold Miners ETF that includes the major gold miners.
Major gold miners are those that produce over 1m ounces of gold annually. The mid-tier gold miners are smaller, producing between 300k to 1m ounces each year. Below 300k is the junior realm. Translated into quarterly terms, majors mine 250k+ ounces, mid-tiers 75k to 250k, and juniors less than 75k. GDXJ was originally launched as a real junior-gold-stock ETF as its name implies, but it was forced to change its mission.
Gold stocks soared in price and popularity in the first half of 2016, ignited by a new bull market in gold. The metal itself awoke from deep secular lows and surged 29.9% higher in just 6.7 months. GDXJ and GDX skyrocketed 202.5% and 151.2% higher in roughly that same span, greatly leveraging gold’s gains! As capital flooded into GDXJ to own junior miners, this ETF risked running afoul of Canadian securities laws.
Canada is the center of the junior-gold universe, where most juniors trade. Once any investor including an ETF buys up a 20%+ stake in a Canadian stock, it is legally deemed a takeover offer. This may have been relevant to a single corporate buyer amassing 20%+, but GDXJ’s legions of investors certainly weren’t trying to take over small gold miners. GDXJ diversified away from juniors to comply with that archaic rule.
Smaller juniors by market capitalization were abandoned entirely, cutting them off from the sizable flows of ETF capital. Larger juniors were kept, but with their weightings within GDXJ greatly demoted. Most of its ranks were filled with mid-tier gold miners, as well as a handful of smaller majors. That was frustrating, but ultimately beneficial. Mid-tier gold miners are in the sweet spot for stock-price-appreciation potential!
For years major gold miners have struggled with declining production, they can’t find or buy enough new gold to offset their depletion. And the stock-price inertia from their large market capitalizations is hard to overcome. The mid-tiers can and are boosting their gold output, which fuels growth in operating cash flows and profitability. With much-lower market caps, capital inflows drive their stock prices higher much faster.
Every quarter I dive into the latest results from the top 34 GDXJ components. That’s simply an arbitrary number that fits neatly into the tables below, but a commanding sample. These companies represented 83.2% of GDXJ’s total weighting this week, even though it contained a whopping 70 stocks! 3 of the top 34 were majors mining 250k+ ounces, 24 mid-tiers at 75k to 250k, 5 “juniors” under 75k, and 2 explorers with zero.
These majors accounted for 12.8% of GDXJ’s total weighting, and really have no place in a “Junior Gold Miners ETF” when they could instead be exclusively in GDX. These mid-tiers weighed in at 60.9% of GDXJ. The “juniors” among the top 34 represented just 6.6% of GDXJ’s total. But only 1 of them at a mere 0.9% of GDXJ is a true junior, meaning it derives over half its revenues from actually mining gold.
The rest include 2 primary silver miners, a gold-royalty company, and a gold streamer. GDXJ is actually a full-on mid-tier gold miners ETF, with modest major and tiny junior exposure. Traders need to realize it is not a junior-gold investment vehicle as advertised. GDXJ also has major overlap with GDX. Fully 29 of these top 34 GDXJ gold miners are included in GDX too, with 23 of them also among GDX’s top 34 stocks.
The GDXJ top 34 accounting for 83.2% of its total weighting also represent 39.8% of GDX’s own total weighting! The GDXJ top 34 mostly clustered between the 10th- to 40th-highest weightings in GDX. Thus nearly 5/6ths of GDXJ is made up by almost 4/10ths of GDX. But GDXJ is far superior, excluding the large gold majors struggling with production growth. GDXJ gives much-higher weightings to better mid-tier miners.
The average Q2’19 gold production among GDXJ’s top 34 was 157k ounces, a bit over half as big as the GDX top 34’s 299k average. Despite these two ETFs’ extensive common holdings, GDXJ is increasingly outperforming GDX. GDXJ holds many of the world’s best mid-tier gold miners with big upside potential as gold’s own bull continues powering higher. Thus it is important to analyze GDXJ miners’ latest results.
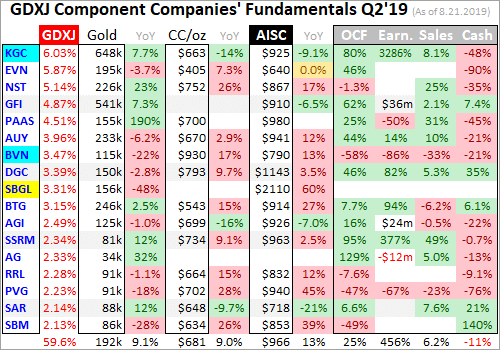
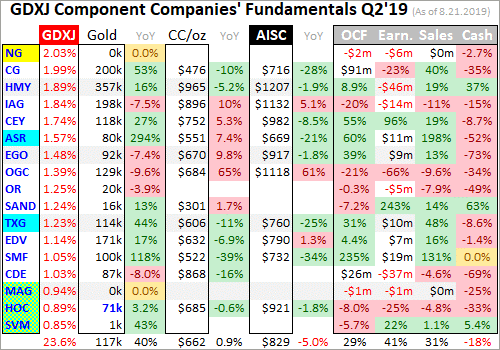
So after each quarterly earnings season I wade through all available operational and financial reports and dump key data into a big spreadsheet for analysis. Some highlights make it into these tables. Any blank fields mean a company hadn’t reported that data as of this Wednesday. The first couple columns show each GDXJ component’s symbol and weighting within this ETF as of this week. Not all are U.S. symbols.
19 of the GDXJ top 34 primarily trade in the U.S., 5 in Australia, 8 in Canada, and 2 in the U.K. So some symbols are listings from companies’ main foreign stock exchanges. That’s followed by each gold miner’s Q2’19 production in ounces, which is mostly in pure-gold terms excluding byproducts often found in gold ore like silver and base metals. Then production’s absolute year-over-year change from Q2’18 is shown.
Next comes gold miners’ most-important fundamental data for investors, cash costs and all-in sustaining costs per ounce mined. The latter directly drive profitability which ultimately determines stock prices. These key costs are also followed by YoY changes. Last but not least the annual changes are shown in operating cash flows generated, hard GAAP earnings, revenues, and cash on hand with a couple exceptions.
Percentage changes aren’t relevant or meaningful if data shifted from positive to negative or vice versa, or if derived from two negative numbers. So in those cases I included raw underlying data rather than weird or misleading percentage changes. In cases where foreign GDXJ components only released half-year data, I used that and split it in half where appropriate. That offers a decent approximation of Q2 results.
Symbols highlighted in light blue newly climbed into the ranks of GDXJ’s top 34 over this past year. And symbols highlighted in yellow show the rare GDXJ-top-34 components that aren’t also in GDX. If both conditions are true, blue-yellow checkerboarding is used. Production bold-faced in blue shows any rare junior gold miners in GDXJ’s higher ranks, under 75k ounces quarterly with over half of sales from gold.
This whole valuable dataset compared with past quarters offers a fantastic high-level read on how mid-tier gold miners are faring fundamentally as an industry. This last quarter was interesting, as gold’s awesome breakout surge to major new secular highs didn’t get underway until just before quarter-end. So the mid-tier gold miners had to contend with flat gold prices, with Q2’19’s average of $1309 merely 0.2% higher YoY.
The shuffling in the ranks of GDXJ’s top 34 components continued over this past year, with major gold miner Kinross Gold added. It, Gold Fields, and Harmony Gold really should be shifted exclusively into GDX since their production is way into major-dom. Gold miners of that scale just defeat the purpose of a “Junior Gold Miners ETF”, retarding its upside potential and eroding traders’ confidence in its managers’ competence.
Most of the other new additions are good though, including mid-tiers Buenaventura, Alacer Gold, and Torex Gold. While Hochschild Mining was technically a junior last quarter, it will likely soon grow into a mid-tier mining 75k+ ounces of gold quarterly. But there’s one GDXJ component that reported such an extreme quarter that it skews most of the year-over-year comparisons. That is South Africa’s Sibanye-Stillwater.
SBGL is actually a primary platinum-group-metals miner, which drove nearly two-thirds of its implied revenue based on average metals prices in Q2! Its shrinking South African gold operations are a total mess, just emerging from a 5-month-long strike organized by a violent Marxist union. That crippled its gold mines, and left at least 9 people dead! Sibanye-Stillwater also has to fight South Africa’s absurdly-corrupt government.
Even though that hellish strike ended in mid-April, very early in Q2, SBGL’s gold production plummeted a catastrophic 47.9% YoY last quarter! That catapulted its all-in sustaining costs to a ridiculous $2110 per ounce, up an extreme 60.5% YoY from already-high levels. This shocking anomaly needs to be excluded in GDXJ comparisons. I wouldn’t invest in this company if it was the last miner on earth, it is a nightmare.
Production has always been the lifeblood of the gold-mining industry. Gold miners have no control over prevailing gold prices, their product sells for whatever the markets offer. Thus growing production is the only manageable way to boost revenues, leading to amplified gains in operating cash flows and profits. Higher production generates more capital to invest in expanding existing mines and building or buying new ones.
Thus gold-stock investors have long prized production growth above everything else, as it is inexorably linked to company growth and thus stock-price-appreciation potential. In Q2’19 these GDXJ-top-34 gold miners collectively produced 5.0m ounces of gold. That was actually down 1.2% YoY, which is worse than the 0.7% shrinkage the top 34 GDX majors reported last quarter after being adjusted for mega-mergers.
But excluding SBGL’s mayhem, the rest of the GDXJ top 34 actually managed to grow their total output by an impressive 1.7% YoY to 4.9m ounces! That not only trounced the majors, but narrowly bested the world’s aggregate production growth in Q2. According to gold’s leading fundamental authority, the World Gold Council, total world output grew 1.6% YoY last quarter to 28.4m ounces. The mid-tiers are thriving.
The GDXJ mid-tiers were able to enjoy strong production growth because this ETF isn’t burdened with many struggling major gold miners that dominate GDX. Again GDXJ’s components start at the 10th-highest weighting in GDX. The 9 above it averaged colossal Q2 production of 585k ounces, which is 3.7x bigger than the GDXJ top 34’s average! Gold mining’s inherent geological limitations make it very difficult to scale.
The more gold miners produce, the harder it is to even keep up with relentless depletion let alone grow their output consistently. Large economically-viable gold deposits are getting increasingly difficult to find and ever-more-expensive to develop, with low-hanging fruit long since exploited. But with much-smaller production bases, mine expansions and new mine builds generate big output growth for mid-tier golds.
The majors don’t only face that large-base growth problem with their production scales, but also with their stocks’ market capitalizations. The GDXJ top 34 companies averaged $2.5b in the middle of this week, compared to $6.9b in the GDX top 34 when I analyzed their Q2 results last week. With the mid-tiers generally around a third as big as the majors, their stock prices have much less inertia restraining them.
With gold returning to favor since late June’s awesome decisive bull-market breakout, the mid-tier-filled GDXJ is already outperforming the major-dominated GDX. Since its year-to-date low in late May, GDXJ surged as much as 52.1% higher by early August! That was considerably better than GDX’s 46.2% rally in the same timeframe. The longer gold-bull uplegs persist, the bigger the mid-tier outperformance grows.
The mid-tier gold miners continue to prove all-important production growth is achievable off smaller bases. With a handful of mines or less to operate, mid-tiers can focus on expanding them or building a new mine to boost their output beyond depletion. But the majors are increasingly failing to do this from the super-high production bases they operate at. As long as majors are struggling, it is prudent to avoid them.
Also interesting on the mid-tier production front was silver. Last quarter the GDXJ-top-34 miners’ silver output blasted 42.8% higher YoY to 28.2m ounces! Some of these companies indeed saw exploding silver production, led by Yamana Gold’s rocketing up 65.8% YoY to 2.2m ounces and SSR Mining’s soaring a similar 55.8% YoY to 1.5m ounces. But new GDXJ-top-34 components drove most of the silver growth.
Buenaventura and Hochschild Mining produced 5.5m and 4.3m ounces of silver last quarter, and they weren’t in GDXJ’s top 34 in Q2’18. Excluding them, the rest of these mid-tier gold miners actually saw their total silver output slump 5.1% YoY. I’ll discuss the serious challenges silver mining faces in next week’s essay, which will wade through the results of the top silver miners of the leading silver miners’ ETF.
In gold mining, production and costs are generally inversely related. Gold-mining costs are largely fixed quarter after quarter, with actual mining requiring about the same levels of infrastructure, equipment, and employees. So the higher production, the more ounces to spread mining’s big fixed costs across. Thus Q2’19’s solid production growth among the GDXJ top 34 ex-SBGL should’ve yielded proportionally-lower costs.
There are two major ways to measure gold-mining costs, classic cash costs per ounce and the superior all-in sustaining costs per ounce. Both are useful metrics. Cash costs are the acid test of gold-miner survivability in lower-gold-price environments, revealing the worst-case gold levels necessary to keep the mines running. All-in sustaining costs show where gold needs to trade to maintain current mining tempos indefinitely.
Cash costs naturally encompass all cash expenses necessary to produce each ounce of gold, including all direct production costs, mine-level administration, smelting, refining, transport, regulatory, royalty, and tax expenses. In Q2’19 these top-34-GDXJ-component gold miners that reported cash costs averaged $672 per ounce. That actually rose a sharp 6.6% YoY, and was worse than the GDX-top-34 majors’ $641 mean.
Sibanye-Stillwater didn’t report Q2 cash costs, so that wasn’t a factor. But a couple of other anomalous situations dragged up this average. Buenaventura has been struggling with weaker production, resulting in extreme $930 cash costs last quarter. And Harmony Gold, a South African miner facing that country’s miserable operating environment, had even-worse $965 cash costs in Q2’19! Those are crazy-high.
Excluding them, the rest of the GDXJ top 34 averaged $650. That’s towards the lower end of the GDXJ-top-34 average range of $612 to $730 in the 13 quarters I’ve been advancing this deep-quarterly-results research thread. As long as cash costs remain far below prevailing gold prices, which was certainly true in Q2, the gold miners face no existential threat. Gold returning to favor is really widening that key survival gap.
Way more important than cash costs are the far-superior all-in sustaining costs. They were introduced by the World Gold Council in June 2013 to give investors a much-better understanding of what it really costs to maintain gold mines as ongoing concerns. AISCs include all direct cash costs, but then add on everything else that is necessary to maintain and replenish operations at current gold-production levels.
These additional expenses include exploration for new gold to mine to replace depleting deposits, mine-development and construction expenses, remediation, and mine reclamation. They also include the corporate-level administration expenses necessary to oversee gold mines. All-in sustaining costs are the most-important gold-mining cost metric by far for investors, revealing companies’ true operating profitability.
The GDXJ-top-34 AISC picture in Q2’19 looked much like the cash-cost one, with average AISCs surging 6.1% YoY to $941 per ounce. That was on the higher side of the past 13 quarters’ range from $855 to $1002, but way below Q2’s average gold price of $1309. That implies GDXJ’s mid-tier gold miners were already earning sizable $368 profits last quarter. But this AISC read was heavily skewed by SBGL’s mess.
Again that cursed gold miner’s AISCs skyrocketed 60.5% YoY to an unbelievable $2110! That was as high as I’ve ever seen, and SBGL tried to bury this deep in its Q2 reporting. The strike was blamed, even though it ended in early Q2. But remove that wild outlier from the pool, and the rest of the GDXJ-top-34 gold miners averaged AISCs of $896 per ounce. That’s actually right in line with the GDX top 34’s $895.
With gold rocketing back over $1500 earlier this month to hit 6.3-year secular highs, it is easy to assume the gold miners must be thriving fundamentally. And they likely are. But realize the lion’s share of the recent huge gold gains didn’t start until late June when gold decisively broke out to new bull-market highs. So these Q2 results don’t yet reflect these new higher gold prices. But Q3’s are on track to look spectacular.
Gold’s lofty $1446 average price so far this quarter is a whopping 10.5% higher quarter-on-quarter than Q2’s! So the current likely profitability of the gold miners post-gold-breakout is far higher than seen last quarter. Assuming the GDXJ top 34’s average all-in sustaining costs hold flat near $941 this quarter, that implies Q3 profits running $505 per ounce. That’s up a massive 37.2% QoQ from what was seen in Q2!
This incredible profits leverage to gold is what makes gold stocks so alluring during major gold uplegs. Their earnings grow so darned fast, 3.5x gold’s advance in this example, that big stock-price gains are usually fundamentally-justified. In Q2’19, GDXJ averaged $30.46 per share. That’s when you should’ve been buying gold stocks, when they were low and out of favor. I explained their bullish outlook in early April.
So far in Q3 which is more than half over, GDX has averaged $38.43 which is 26.2% higher QoQ. That is still lagging big expected profits growth among mid-tier gold miners this quarter given the much-higher prevailing gold prices. So gold stocks’ strong gains in recent months are fundamentally-righteous, supported by underlying earnings growth and sustainable as long as gold holds over $1446 into quarter-end.
The mid-tier gold miners reported good accounting results last quarter even before gold reignited. The GDXJ top 34’s total revenues soared 23.0% YoY to $6.6b! While that is certainly overstated given the new inclusion of major gold miner Kinross Gold, without it the rest of these companies still saw strong 7.3% YoY growth. That’s impressive given Q2’19’s dead-flat average gold price, up a trivial 0.2% YoY.
These strong operations drove exploding operating-cashflow generation, with the GDXJ top 34’s total blasting 44.2% higher YoY to $2.3b! Even without KGC they still rose 23.6% YoY. And these elite mid-tier gold miners were investing some of this new capital in expanding their mines, which investors always like to see. Their collective cash hoards sunk 12.6% YoY to $6.0b, which remains healthy given mid-tiers’ sizes.
The GDXJ top 34’s profits under Generally Accepted Accounting Principles radically improved as well. Together they earned $291m last quarter, which was a colossal improvement from Q2’18’s $410m loss. Even though $384m of that resulted from an impairment charge by a single component miner that quarter, the mid-tiers’ profits picture still greatly improved. And that was even with last quarter’s still-anemic $1309 gold.
Imagine how awesome these numbers will look in this current quarter given all the gold fireworks since the end of Q2! The mid-tier gold miners generally report their results 4 to 6 weeks after quarter-ends, so Q3’19 fundamental performance will be revealed in the first half of November. As long as gold sentiment remains decent, these Q3 results should really impress and attract in legions of new investors to this sector.
That being said, gold and gold stocks have soared really far really fast this quarter. Sentiment quickly grew greedy as really-overbought levels were reached. Couple that with today’s menacing overhang of huge potential gold-futures selling, and a healthy bull-market correction is likely. But now is the time to do your homework before buying lower later, to ferret out the high-potential gold miners with superior fundamentals.
All portfolios need a 10% allocation in gold and its miners’ stocks! This is more important than ever with gold finally waking up from its long slumber while lofty central-bank-goosed stock markets are looking increasingly precarious. The better mid-tier gold miners are the place to be. Unlike the majors, they are actually growing their production and have far-higher upside coming from lower-market-capitalization bases.
To multiply your capital in the markets, you have to trade like a contrarian. That means buying low when few others are willing, so you can later sell high when few others can. In the first half of 2019 well before gold’s breakout, we recommended buying many fundamentally-superior gold and silver miners in our popular weekly and monthly newsletters. We’ve recently realized big gains including 109.7%, 105.8%, and 103.0%!
To profitably trade high-potential gold stocks, you need to stay informed about the broader market cycles that drive gold. Our newsletters are a great way, easy to read and affordable. They draw on my vast experience, knowledge, wisdom, and ongoing research to explain what’s going on in the markets, why, and how to trade them with specific stocks. Subscribe today and take advantage of our 20%-off summer-doldrums sale! The biggest gains are won by traders diligently staying abreast so they can ride entire uplegs.
The bottom line is the mid-tier gold miners are thriving fundamentally. Their Q2 results were good, even before gold’s powerful bull-market breakout. They are growing production while holding the line on costs. That means their earnings will soar as gold powers higher on balance in its resurgent bull market. That will support much-higher gold-stock prices in the future, and attract traders back to this long-neglected sector.
Gold’s bull market will flow and ebb as always, so gold-stock positions should be accumulated relatively low in post-selloff troughs. There’s no need to buy high at crests when everyone is excited. But you have to prepare in advance, monitoring the markets and researching the gold miners to be ready to pounce at opportune times. Capital allocations should be focused on mid-tier gold miners with superior fundamentals.
Adam Hamilton, CPA
August 26, 2019
Copyright 2000 – 2019 Zeal LLC (www.ZealLLC.com)
Corrections are inevitable, but current conditions support a prolonged rally in the gold market, TD Securities says in an equity research report.
“Before we restate our bullish thesis for precious metals, we should acknowledge that positioning in the gold market is at extreme levels, with Comex net longs near all-time highs and trading volumes at near double the averages of last year,” the report says.
This type of market posture, with everyone enthusiastically lined up in one direction, often precedes a reversal and a gold correction now could be exacerbated by the magnitude of the move required to restore normalcy to the market, TD says.
Of course, the macro picture is anything but normal. TD notes that there is now broad consensus around the idea that the deteriorating U.S. and global economic outlook will mean that Fed Chair Powell’s ‘mid-cycle adjustment’ in July will turn into an extended cutting cycle, with the bond market pricing in 25-50 bps of cuts by year-end.
TD Global Rates, which called for cuts ahead of the market, is calling for 50 bps of additional easing in 2019, followed by an additional 75 bps of easing in 2020. In many countries, real rates are already negative, and the discussion is around tiering (allowing more deeply-negative yields), QE, and the potential for competitive currency devaluation, TD says,
Despite Rally, Gold Equities Undervalued vs. Gold
The GDX (large-cap) index has rallied around 35% YTD, while the GDXJ (small-cap) is up only about 31% despite having outperformed its larger brother since the beginning of June. Gold, for reference, is up around 19% YTD.
Despite this, gold equities as measured by the S&P/TSX Gold Index are lagging their historical relationship to gold, both when compared with the most recent peak in 2016 and with the peak of the last bull market in 2011, TD notes.
Rotations Key to Maximizing Returns in Prolonged Rally
In a note published in June, TD called the technical breakouts of both gold and silver from their downtrends (corrections within the bull market that began in early 2016). Both metals rallied strongly from that point, with gold up 15% and silver up 16% since then.
TD had also forecast at that time that silver will lag and then outperform gold on a continuation of the rally. Indeed, we saw the gold/silver ratio climb to multi-decade highs above 93 in mid-July before falling to 86 and since then partially retracing that move.
TD’s preferred name for high beta and liquidity, which was highlighted in the June note, was First Majestic Silver, which has rallied approximately 59% since then, strongly outperforming its peers.
TD will publish more on the gold/silver ratio when the retracement/consolidation pattern is complete as TD analysts ultimately expect much stronger gains in silver before the precious metals bull market is over.
Last week was another strong one for the precious metals sector.
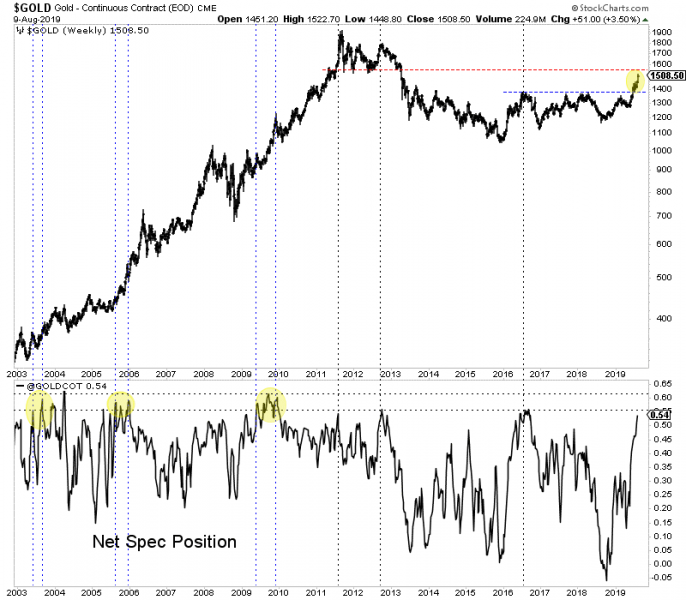
Gold gained a whopping $51/oz or 3.5%. The gold stocks (GDX, GDXJ) advanced by roughly 6%. Silver gained 4%.
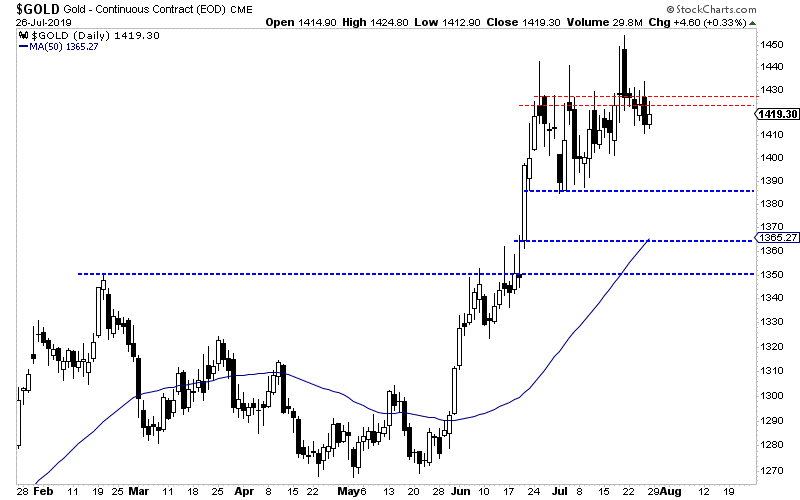
Momentum in the sector began to build once Gold surpassed resistance at $1420-$1425/oz. We had noted the lack of resistance from $1425 to $1525-$1550/oz.
Gold has not reached $1550/oz yet but as it inches higher, some technical and sentiment indicators are urging caution.
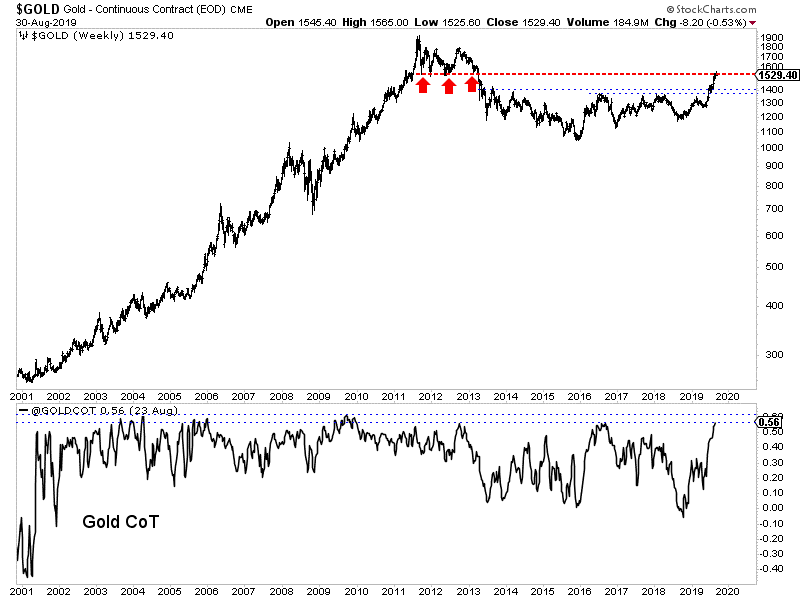
Gold’s net speculative position of 54% is very close to the peaks of 55% to 60% seen since 2000. It’s possible the commercial hedgers will start covering at some point like they did in 2006 and 2010 but for now we have to assume they won’t if $1550/oz holds as resistance.
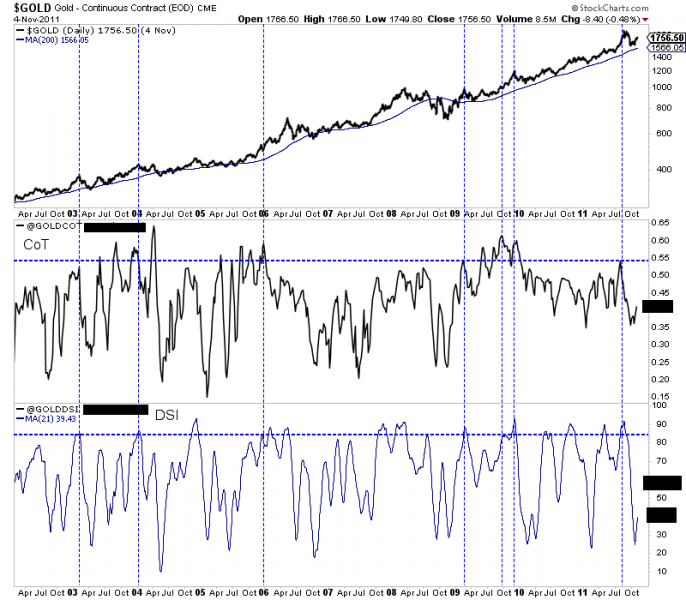
In the next chart we plot Gold’s net speculative position (51%) and the 21-day average of the daily sentiment index (DSI) from 2002 to 2011 (84%).
During that strong 10-year period, those figures of 51% and 84% were reached seven times. Five of those seven times Gold corrected or consolidated for at least a few months.
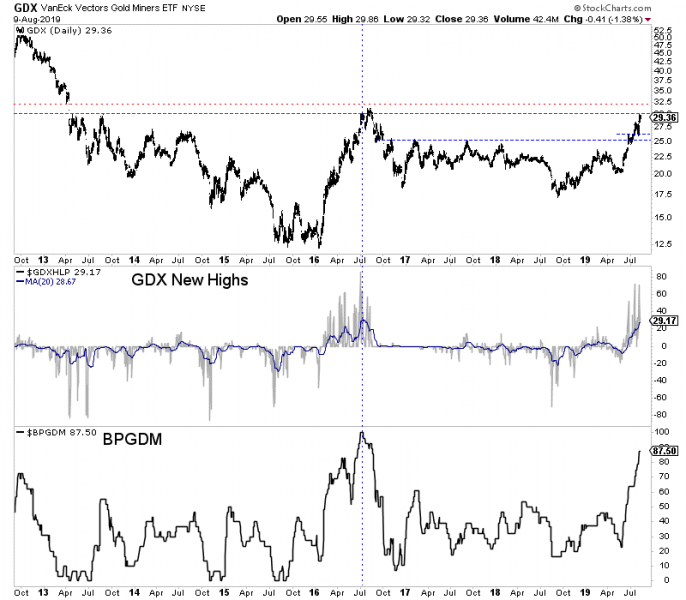
Turning to the gold stocks (and GDX specifically), we find a fairly overbought condition while the market approaches multi-year resistance at $31-$32.
The bullish percentage index (BPGDM) and a 20-day moving average of new highs in GDX are approaching the levels they peaked at in July 2016.
The trend in precious metals is strong and the fundamentals are bullish but there can obviously be corrections and consolidations within strong trends.
Sentiment indicators are becoming a concern and Gold and gold stocks (GDX) are approaching obvious resistance levels at $1550/oz and $31-$32.
This is not the time to be placing aggressive bets on Gold or the senior gold stocks. If there is a sector correction, those areas figure to be hit harder than Silver or junior mining stocks which are not as extended.
If you missed the recent run then it is best to be patient, buy value and wait for weakness in anything that is strong but too extended. New opportunities will emerge. To learn the stocks we own and intend to buy during the next correction that have 3x to 5x potential, consider learning more about our premium service.
By Jordan Roy-Byrne CMT, MFTA
August 14, 2019
The precious metals sector appears to have started a correction.
It was roaring higher until natural resistance kicked in and the U.S. Dollar grinded its way higher, towards its 2019 high. Factor in the Fed decision this week and it has created a natural “buy the rumor, sell the news” event.
We cannot know for certain what the Federal Reserve will do or even more importantly, how the market will react. But we can take note of key levels in these markets.
Gold has held above $1400/oz but has been unable to break past resistance at $1420-$1425/oz. A retest of $1385/oz is quite possible and so is a test of $1365/oz.
Silver has outperformed Gold since it broke above its 400-day moving average, which provided strong resistance dating back to the end of 2017.
Silver encountered resistance at $16.60-$16.70/oz and could test initial support at $16.20/oz. Below that is strong support at $15.95/oz.
Turning to the gold stocks, we find a clear setup between support and resistance.
GDX, the ETF for large gold producers has resistance at $28 but good support above $25.00, which was previous resistance for nearly three years. Look for initial support around $26.00.
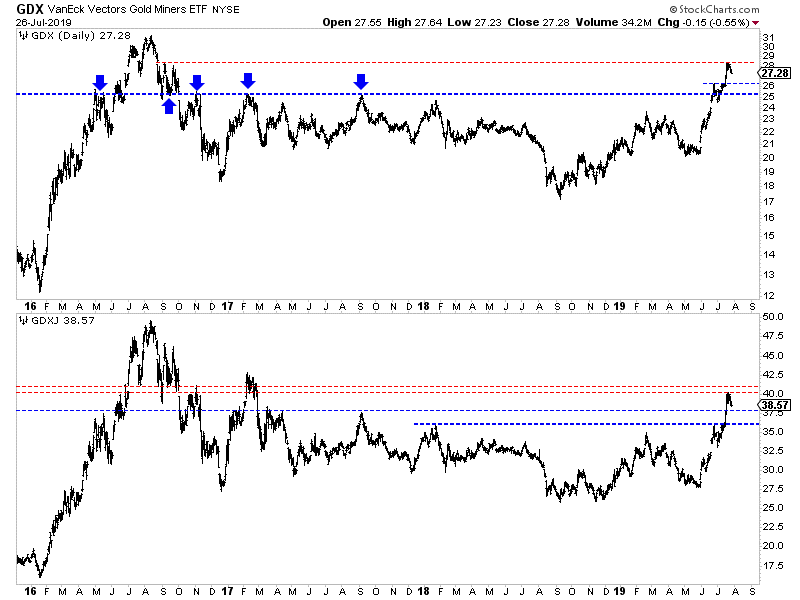
GDXJ, the ETF for the “senior” junior companies, faces resistance at $40-$41. It has initial support around $37.50 with strong support at $36.00.
Regardless of what the Fed does or says, my expectation is precious metals will test these levels and ultimately hold them. The Fed and global central banks want to ease policy and this figures to be more than a one-off.
Precious metals became overbought and a correction is in order.
Investors who smartly positioned in recent months should continue to hold their winners. If the sector continues to correct then look to be a buyer at the aforementioned support levels.
Look to focus your capital on fresh opportunities and value plays that are not very overbought or extended. To learn the stocks we own and intend to buy on this weakness that have 3x to 5x potential, consider learning more about our premium service.
Jordan Roy-Byrne CMT, MFTA
July 30, 2019
It was a huge week for the gold stocks. GDX gained nearly 7% while GDXJ surged over 10%.
Gold hit $1450/oz after Thursday before selling off Friday. Silver met the same fate on Friday but managed to close the week up over 6% and at a new 52-week high.
Let’s take a look at the current technicals.
Gold closed the week just below $1427/oz. If it remains above $1420-$1425, then it is likely to trend towards $1475/oz, which is the only resistance between $1425 and $1525.
If Gold trades back below $1420 then there is a risk it could test $1380 again.
Silver has taken out resistance at its 400-day moving average in convincing fashion but needs to surpass its February 2019 high. Its next major resistance target is the mid $18s.
Turning to the stocks, we start with GDX which is closing in on its 2016 high. Should Gold trend towards $1475/oz then GDX would likely retest that 2016 high at $31.
Breadth remains strong and so too is GDX’ relative strength. GDX relative to the S&P made a 21-month high and relative to Gold made a 2-year high.
Both GDXJ (juniors) and the HUI (miners only) still have room to go before reaching their 2016 highs.
In fact, both are facing some immediate overhead resistance. For GDXJ which closed at $39.50, that resistance is at $40-$41. For HUI which closed at 211, that resistance is at 220.
The support levels are $36 for GDXJ and 195 for the HUI.
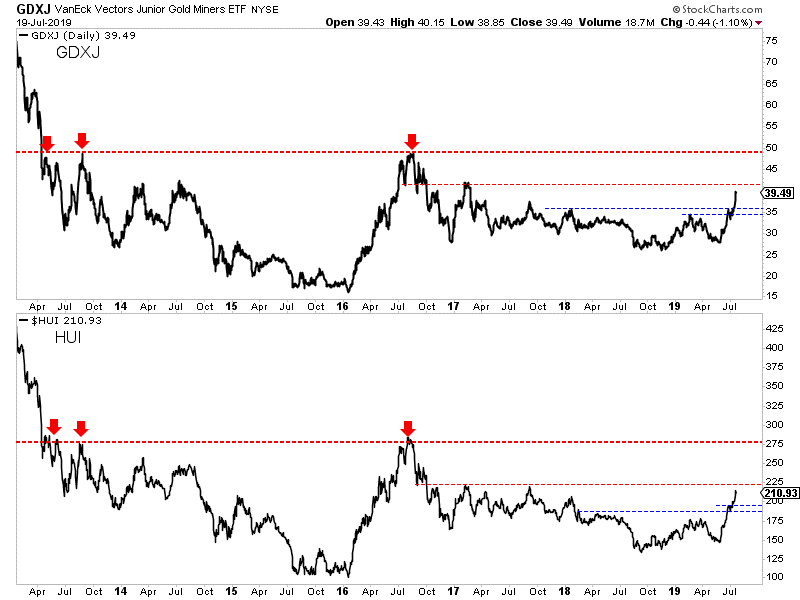
If Gold and Silver maintain current levels, then the immediate bias remains higher and GDX could soon test its 2016 high.
GDXJ and HUI have roughly 30% upside to their 2016 highs. Such a move probably requires a move in Gold to at least $1525/oz.
However, if Friday was the start of a correction then GDX could test $26 and GDXJ could test $36.
For investors in the juniors and seniors, continue to hold winners. If the sector corrects, then look to take advantage of that weakness. If metals and shares maintain these levels then focus your capital on fresh opportunities and value plays that are not overbought or extended. To learn the stocks we own and intend to buy that have 3x to 5x potential, consider learning more about our premium service.
By Jordan Roy-Byrne CMT, MFTA
July 23, 2019
Gold and gold stocks especially continue to shrug off bits and pieces of bad news.
No escalation in the trade war? The selloff lasted one day and the sector rebounded strongly the following day.
Strong headline jobs number? Again, the weakness was a buying opportunity.
This past week there was more.
The June CPI report came in hotter than expected, which could mitigate the degree the Fed eases in the future. Also, bond yields in the US have risen the entire week.
No dice.
Gold closed the week at $1412/oz while the gold stocks closed just inches from new highs on the daily charts.
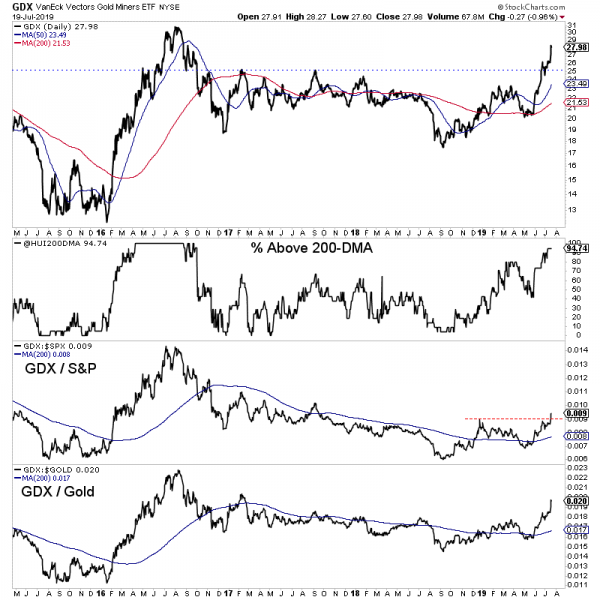
Turning to the technicals of the gold stocks, we see both underlying and relative strength.
Nearly 95% of the large miners closed above the 200-day moving average. Meanwhile GDX relative to both the S&P 500 and Gold is above a rising 200-day moving average. The GDX to Gold ratio is at a 2-year high while the GDX to S&P 500 ratio is very close to a new 52-week high.
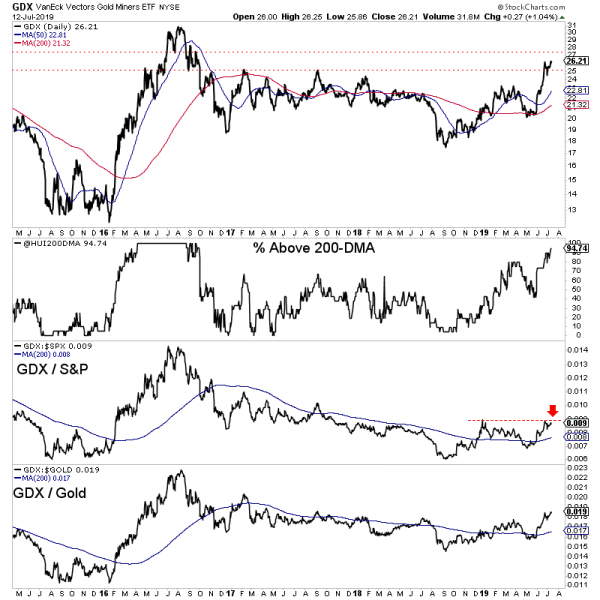
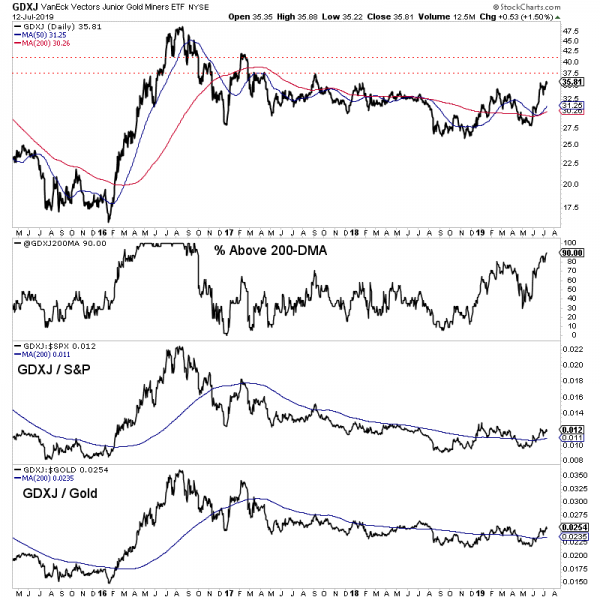
GDXJ is lagging GDX a bit but it is coming around.
90% of the ETF closed above the 200-day moving average. That is the highest reading in nearly three years.
GDXJ relative to the S&P and Gold has turned bullish and is holding above upward sloping 200-day moving averages.
The immediate upside targets for GDX and GDXJ are GDX $27.50 and GDXJ $37.50. The next level of targets would be GDX $30 and GDXJ $41.
Gold has endured some selling in the $1420-$1425/oz range but has remained bid around $1400/oz. A daily close above $1420/oz would remove much of the resistance from here to the low $1500s.
For investors in the juniors and seniors, continue to hold your winners and focus your capital on fresh opportunities and value plays that could move with the next leg higher. To learn which stocks we own and intend to buy that have 3x to 5x potential, consider learning more about our premium service.
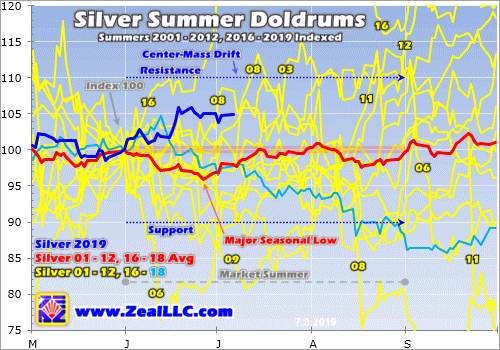
Gold’s incredible strength this summer is very unusual, as early summers are the weakest times of the year seasonally for gold, silver, and their miners’ stocks. With traders’ attention diverted to vacations and summer fun, interest in and demand for precious metals normally wane. So this entire sector tends to suffer a seasonal lull, along with the general markets. This June’s bull-market breakout is a momentous anomaly.
This doldrums term is very apt for gold’s usual summer predicament. It describes a zone in the world’s oceans surrounding the equator. There hot air is constantly rising, creating long-lived low-pressure areas. They are often calm, with little or no prevailing winds. History is full of accounts of sailing ships getting trapped in this zone for days or weeks, unable to make headway. The doldrums were murder on ships’ morale.
Crews had no idea when the winds would pick up again, while they continued burning through their limited stores of food and drink. Without moving air, the stifling heat and humidity were suffocating on these ships long before air conditioning. Misery and boredom were extreme, leading to fights breaking out and occasional mutinies. Being trapped in the doldrums was viewed with dread, it was a very trying experience.
Gold investors can somewhat relate. Like clockwork nearly every summer, gold starts drifting listlessly sideways. It often can’t make significant progress no matter what the trends looked like heading into June, July, and August. As the days and weeks slowly pass, sentiment deteriorates markedly. Patience is gradually exhausted, supplanted with deep frustration. Plenty of traders capitulate, abandoning ship.
Thus after decades of trading gold, silver, and their miners’ stocks, I’ve come to call this time of year the summer doldrums. Junes and Julies in particular are usually desolate sentiment wastelands for precious metals, totally devoid of recurring seasonal demand surges. Unlike much of the rest of the year, these summer months simply lack any major income-cycle or cultural drivers of outsized gold investment demand.
The vast majority of the world’s investors and speculators live in the northern hemisphere, so markets take a back seat to the great joys of summer. Traders take advantage of the long sunny days and kids being out of school to go on extended vacations, hang out with friends, and enjoy life. And when they aren’t paying much attention to the markets, naturally they aren’t allocating much new capital to gold.
Given gold’s dull summer action historically, it is never wise to expect too much from it this time of year. Summer rallies can happen, but they aren’t common. So expectations need to be tempered, especially in Junes and Julies. That early-1990s Gin Blossoms song “Hey Jealousy” comes to mind, declaring “If you don’t expect too much from me, you might not be let down.” The markets are ultimately an expectations game.
Quantifying gold’s summer seasonal tendencies during bull markets requires all relevant years’ price action to be recast in perfectly-comparable percentage terms. That is accomplished by individually indexing each calendar year’s gold price to its last close before market summers, which is May’s final trading day. That is set at 100, then all gold-price action each summer is recalculated off that common indexed baseline.
So gold trading at an indexed level of 105 simply means it has rallied 5% from May’s final close, while 95 shows it is down 5%. This methodology renders all bull-market-year gold summers in like terms. That’s necessary since gold’s price range has been so vast, from $257 in April 2001 to $1894 in August 2011. That span encompassed gold’s last secular bull, which enjoyed a colossal 638.2% gain over those 10.4 years!
Obviously 2001 to 2011 were certainly bull years. 2012 was technically one too, despite gold suffering a major correction following that powerful bull run. At worst that year, gold fell 18.8% from its 2011 peak. That was not quite enough to enter formal bear territory at a 20%+ drop. But 2013 to 2015 were definitely brutal bear years, which need to be excluded since gold behaves very differently in bull and bear markets.
In early 2013 the Fed’s wildly-unprecedented open-ended QE3 campaign ramped to full speed, radically distorting the markets. Stock markets levitated on the Fed’s implied backstopping, slaughtering demand for alternative investments led by gold. So in Q2’13 alone, gold plummeted 22.8% which proved its worst quarter in an astounding 93 years! Gold’s bear continued until the Fed started hiking rates again in late 2015.
The day after that first rate hike in 9.5 years in mid-December 2015, gold plunged to a major 6.1-year secular low. Then it surged out of that irrational rate-hike scare, formally crossing the +20% new-bull threshold in early March 2016. Ever since, gold has remained in this current bull. At worst in December 2016 after gold was crushed on the post-election Trumphoria stock-market surge, it had only corrected 17.3%.
So the bull-market years for gold in modern history ran from 2001 to 2012, skipped the intervening bear-market years of 2013 to 2015, then resumed in 2016 to 2019. Thus these are the years most relevant to understanding gold’s typical summer-doldrums performance, which is necessary for managing your own expectations this time of year. This spilled-spaghetti mess of a chart is fairly simple and easy to understand.
The yellow lines show gold’s individual-year summer price action indexed from each May’s final close for all years from 2001 to 2012 and 2016 to 2017. 2018’s is rendered in light blue. Together these establish gold’s summer trading range. All those past bull-market years’ individual indexes are averaged together in the red line, revealing gold’s central summer tendency. 2019’s indexed action is superimposed in dark blue.
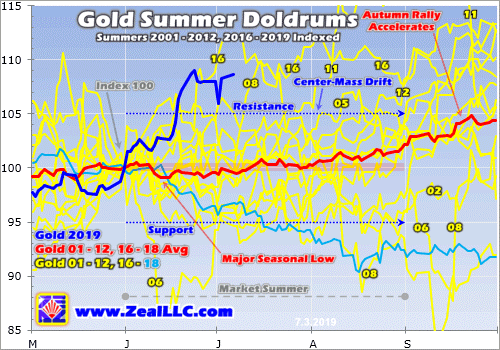
While there are outlier years, gold generally drifts listlessly in the summer doldrums much like a sailing ship trapped near the equator. The center-mass drift trend is crystal-clear in this chart. The vast majority of the time in June, July, and August, gold simply meanders between +/-5% from May’s final close. This year that equated to a probable summer range between $1240 to $1370. Gold tends to stay well within trend.
Obviously this year has proven a huge exception to that normal summer rule, with gold rocketing higher to a major bull-market breakout! Gold blasted to its best early-summer performance ever seen in all modern bull-market years. Comparing this current summer’s dark-blue line to past years’ price action certainly drives home how unique, exceptional, and special gold’s breakout surge to major new secular highs has been.
Still, understanding gold’s typical behavior this time of year is important for traders. Sentiment isn’t only determined by outcome, but by the interplay between outcome and expectations. If gold rallies 5% but you expected 10% gains, you will be disappointed and grow discouraged and bearish. But if gold rallies that same 5% and you expected no gains, you’ll be excited and get optimistic and bullish. Expectations are key.
History has proven it is wise not to expect too much from gold in these lazy market summers, particularly Junes and Julies. Occasionally gold still manages to stage a summer rally, like this year’s monster. But most of the time gold doesn’t veer materially from its usual summer-drift trading range, where it is often adrift like a classic tall ship. With range breakouts either way uncommon, there’s often little to get excited about.
In this chart I labeled some of the outlying years where gold burst out of its usual summer-drift trend, both to the upside and downside. But these exciting summers are atypical, and can’t be expected very often. Most of the time gold grinds sideways on balance not far from its May close. Traders not armed with this critical knowledge often wax bearish during gold’s summer doldrums and exit in frustration, a real mistake.
Gold’s summer-doldrums lull marks the best time of the year seasonally to deploy capital, to buy low at a time when few others are willing. Gold enjoys powerful seasonal rallies that start in Augusts and run until the following Mays! These are fueled by outsized investment demand driven by a series of major income-cycle and cultural factors from around the world. Summer is when investors should be bullish, not bearish.
The red average indexed line above encompassing 2001 to 2012 and 2016 to 2018 reveals gold’s true underlying summer trend in bull-market years. Technically gold’s major seasonal low arrives relatively early in summers, mid-June. On average through all these modern bull-market years, gold slumped 0.9% between May’s close and that summer nadir. But seasonally that’s still on the early side to deploy capital.
Check out the yellow indexed lines in this chart. They tend to cluster closer to flatlined in mid-June than through all of July. The only reason gold’s seasonal low appears in mid-June mathematically is a single extreme-outlier year, 2006. The spring seasonal rally was epic that year, gold rocketed 33.4% higher to a dazzling new bull high of $720 in just 2.0 months between mid-March to mid-May! That was incredible.
Extreme euphoria had catapulted gold an astounding 38.9% above its 200-day moving average, radically overbought by any standard. That was way too far too fast to be sustainable, so after that gold had to pay the piper in a sharp mean-reversion overshoot. So over the next month or so into mid-June, gold’s overheated price plummeted 21.9%! That crazy outlier is the only reason gold’s major summer low isn’t later.
There were 15 bull-market years from 2001 to 2012 and 2016 to 2018. That is a big-enough sample to smooth out the trend, but not large enough to prevent extreme deviations from skewing it a bit. Gold sees a series of marginally-higher lows in late June, early July, and even late July. In this dataset they came in 0.0%, 0.3%, and 0.8% higher than mid-June’s initial low. And that last late-July one arrives over 6 weeks later.
So generally there’s no hurry to deploy capital right at that initial mid-June seasonal low. Gold tends to drift nearly flatlined over the next several weeks into early July, trying traders’ patience. Buying within a few trading days of the US Independence Day holiday seems to have the best odds of catching gold near its summer-doldrums lows. Investment capital inflows usually begin ramping back up after that as traders return.
On average in these modern bull-market years, gold slipped 0.4% in Junes before rallying 0.7% in Julies. After July’s initial lazy summer week, gold tends to gradually start clawing its way back higher again. But this is so subtle that Julies often still feel summer-doldrumsy. By the final trading day in July, gold is still only 0.3% higher than its May close kicking off summers. That’s too small to restore damaged sentiment.
Since gold exited May 2019 at $1305, an average 0.3% rally by July’s end would put it at $1309. That’s hardly enough to generate excitement after two psychologically-grating months of drifting. But the best times to deploy any investment capital are when no one else wants to so prices are low. Gold’s summer doldrums come to swift ends in Augusts, which saw hefty average gains of 1.9% in these bull-market years!
And that’s just the start of gold’s major autumn seasonal rally, which has averaged strong 5.7% gains between mid-Junes to late Septembers. That is driven by Asian gold demand coming back online, first post-harvest-surplus buying and later Indian-wedding-season buying. June is the worst of gold’s summer doldrums, and the first half of July is when to buy back in. It’s important to be fully deployed before August.
These gold summer doldrums driven by investors pulling back from the markets to enjoy their vacation season don’t exist in a vacuum. Gold’s fortunes drive the entire precious-metals complex, including both silver and the stocks of the gold and silver miners. These are effectively leveraged plays on gold, so the summer doldrums in them mirror and exaggerate gold’s own. Check out this same chart type applied to silver.
Since silver is much more volatile than gold, naturally its summer-doldrums-drift trading range is wider. The great majority of the time, silver meanders between +/-10% from its final May close. That came in at $14.56 this year, implying a summer-2019 silver trading range between $13.10 to $16.02. While silver suffered that extreme June-2006 selling anomaly too, its major seasonal low arrives a couple weeks after gold’s.
Given gold’s spectacular bull-market-breakout surge last month, silver’s summer performance this year has been utterly dismal. Normally silver amplifies gold upside by at least 2x. But silver has been bombed out and languishing for so long that investors and speculators still want nothing to do with it. Silver often acts as a gold sentiment gauge, and gold hasn’t been over $1400 long enough yet to shift psychology to bullish.
On average in these same gold-bull-market years of 2001 to 2012 and 2016 to 2018, silver dropped 4.1% between May’s close and late June. That is much deeper than gold’s 0.9% seasonal slump, which isn’t surprising given silver’s leverage to gold. Silver’s summer performances are also much lumpier than gold’s. Junes see average silver losses of 3.2%, but those are more than erased in strong rebounds in Julies.
Silver’s big 3.6% average rally in Julies amplifies gold’s gains by an impressive 5.1x! But unfortunately silver hasn’t been able to maintain that seasonal momentum, with Augusts averaging a modest decline of 0.7%. Overall from the end of May to the end of August, silver’s summer-doldrums performance tends to drift lower. Silver averaged a 0.4% full-summer loss, way behind gold’s 2.2% gain through June, July, and August.
That means silver sentiment this time of year is often worse than gold’s, which is already plenty bearish. The summer doldrums are more challenging for silver than gold. Being in the newsletter business for a couple decades now, I’ve heard from countless discouraged investors over the summers. While I haven’t tracked this, it sure feels like silver investors have been disproportionally represented in that feedback.
Since gold is silver’s primary driver, this white metal is stuck in the same dull drifting boat as gold in the market summers. Silver usually leverages whatever is happening in gold, both good and bad. But again the brunt of silver’s summer weakness is borne in Junes. Fully expecting this seasonal weakness and rolling with the punches helps prevent getting disheartened, which in turn can lead to irrationally selling low.
The gold miners’ stocks are also hostage to gold’s summer doldrums. This last chart applies this same methodology to the flagship HUI gold-stock index, which mostly closely mirrors that leading GDX VanEck Vectors Gold Miners ETF. The major gold stocks tend to amplify gold’s gains and losses by 2x to 3x, so it is not surprising that the HUI’s summer-doldrums-drift trading range is also twice as wide as gold’s own.
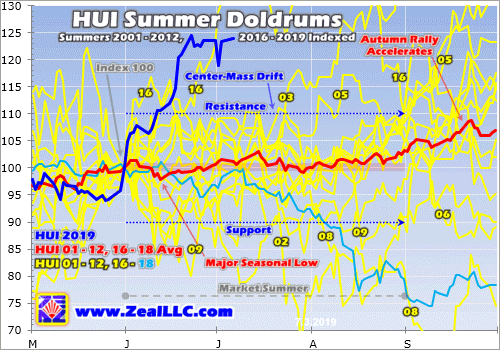
The gold miners’ stocks share silver’s center-mass summer drift running +/-10% from May’s close. This year the HUI entered the summer doldrums at 157.1, implying a June, July, and August trading range of 141.4 to 172.8. While gold stocks’ GDX ETF is too young to do long-term seasonal analysis on, in GDX terms this summer range translates to $19.43 to $23.75 this year. That’s based off a May 31st close of $21.59.
Thanks to gold’s dazzling bull-market breakout, gold stocks have defied these weak summer seasonals this year to soar to their own major decisive breakout! This high-potential contrarian sector has enjoyed its best early-summer performance ever witnessed in gold’s modern bull-market years. While I hope this incredible outperformance persists, the summer doldrums could still reassert themselves if gold retreats.
Like gold, the gold stocks’ major summer seasonal low arrives in mid-June. On average in these gold-bull-market years of 2001 to 2012 and 2016 to 2018, by then the HUI had slid 2.1% from its May close. Then gold stocks tended to more than fully rebound by the end of June, making for an average 0.6% gain that month. But there is no follow-through in July, where the gold stocks averaged a modest 0.5% loss.
Overall between the end of May and the end of July, which encompasses the dark heart of the summer doldrums, the HUI proved dead flat on average. Again two solid months of grinding sideways on balance is hard for traders to stomach, especially if they’re not aware of the summer-doldrums drift. The key to surviving it with minimum psychological angst is to fully expect it. Managing expectations in markets is essential!
But also like gold, the big payoff for weathering the gold-stock summer starts in August. With gold’s major autumn rally getting underway, the gold stocks as measured by the HUI amplify it with good average gains of 3.1% in Augusts! And that’s only the start of gold stocks’ parallel autumn rally with gold’s, which has averaged 9.3% gains from late Julies to late Septembers. Gold-stock upside resumes in late summers.
Like much in life, withstanding the precious-metals summer doldrums is less challenging if you know they’re coming. While outlying years happen, they aren’t common. So the only safe bet to make is expecting gold, silver, and the stocks of their miners to languish in Junes and Julies. Then when these drifts again come to pass, you won’t be surprised and won’t get too bearish. That will protect you from selling low.
The precious-metals sector radically bucked its seasonal-slump trend this year, surging to a record start. Gold began blasting higher on May’s final trading day, and that sharp rally carried into early June. New trade-war tariff threats were ramping up market fears, driving the US stock markets to selloff lows following late April’s all-time record highs. So traders remembered diversifying with gold and flocked back to it.
In mid-June gold’s gains accelerated after the Fed reversed its future-rate outlook from hiking back to cutting. That propelled gold to its first new bull-market highs in 3.0 years, with it surging to a 5.8-year secular high on that late-June breakout day. That momentum fed on itself and carried gold back over $1400 for the first time since early September 2013. Those awesome $1400+ levels have mostly held since.
The gold miners’ stocks naturally leveraged gold’s gains, enjoying their own epic early-summer action. The precious-metals sector is doing wildly better than last summer, when gold rolled over in mid-June on a sharp US dollar rally. Hyper-leveraged gold-futures speculators watch the dollar’s fortunes for trading cues. Hopefully gold’s huge early-summer gains can hold, and it consolidates sideways in coming weeks.
Gold’s massive and exceptional June rally was mostly fueled by speculators buying enormous quantities of gold futures. That has largely exhausted their available capital firepower, and left their collective bets on gold exceedingly bullish. These positions must be partially unwound with selling, which forces gold into a high consolidation at best and a sharp selloff at worst. So gold isn’t out of the summer-doldrums woods yet.
The inevitable coming gold-futures selling could be largely offset by investment buying. Investors are radically underinvested in gold after the second-largest and first-longest stock bull in US history, giving them big room to buy to reestablish normal portfolio allocations. Since they love chasing winners, gold’s powerful new-high psychology is starting to attract them back. Their return could dwarf gold-futures selling.
Given gold’s long-established lackluster summer-doldrums performance record, it is probably not prudent to chase this rally with gold-futures speculators effectively all-in longs and all-out shorts. But the metal and its miners’ stocks can be accumulated aggressively on any significant weakness. All portfolios need a 10% allocation in gold and gold stocks! Far-more upside is coming after recent overboughtness is worked off.
One of my core missions at Zeal is relentlessly studying the gold-stock world to uncover the stocks with superior fundamentals and upside potential. The trading books in both our popular weekly and monthly newsletters are currently full of these better gold and silver miners. Mostly added in recent months as gold stocks recovered from selloffs, their unrealized gains were already running as high as +105% this week!
If you want to multiply your capital in the markets, you have to stay informed. Our newsletters are a great way, easy to read and affordable. They draw on my vast experience, knowledge, wisdom, and ongoing research to explain what’s going on in the markets, why, and how to trade them with specific stocks. As of Q1 we’ve recommended and realized 1089 newsletter stock trades since 2001, averaging annualized realized gains of +15.8%! That’s nearly double the long-term stock-market average. Subscribe today and take advantage of our 20%-off summer-doldrums sale!
The bottom line is gold, silver, and their miners’ stocks usually drift listlessly during market summers. As investors shift their focus from markets to vacations, capital inflows wane. Junes and Julies in particular are simply devoid of the big recurring gold-investment-demand surges seen during much of the rest of the year, leaving them weak. Investors need to expect lackluster sideways action on balance this time of year.
This summer has proven an epic exception, with gold rocketing to its first major bull-market breakout in years! That has catapulted both the metal and its miners’ stocks to their best early-summer performances in gold’s modern bull-market years. But the summer doldrums could still reassert themselves as specs’ excessively-bullish gold-futures bets are bled off. So enjoy these big anomalous gains, but remain wary.
Adam Hamilton, CPA
July 8, 2019
Copyright 2000 – 2019 Zeal LLC (www.ZealLLC.com)
- Major fundamental processes and events create the large chart patterns seen on the monthly charts. It’s important for gold and stock market investors to stay focused on the big picture, both technically and fundamentally.
- To view the big technical picture for gold, please click here now. Double-click to enlarge.
- Since 2001, my proprietary weekly chart signals system has only generated five buy signals for gold bullion. Note the similarity of the latest one with the 2009 signal.
- The current signal happens with India just days away (July 5) from a possible gold tariff tax cut as part of its new budget, and the July 31 Fed meeting only a month away.
- I’ve put the odds of a gold tariff tax cut at about 50%. To view key news related to the US business cycle, please click here now. The Dow gave back most of its early morning gain yesterday, after rising on the news that Trump would temporarily halt his tariff tax bombing runs on the stock markets, corporations, and working class of America.
- Over the long term, the only way for conservative governments to compete with handouts-focused liberals at the voting polls is with working class tax cuts. By refusing to cut income taxes for America’s working class, Trump risks losing the 2020 election.
- He is now rumoured to be considering a capital gain tax cut (for stock market elitists) instead of an income tax cut for the poor. That’s going to drive more blue-collar voters towards the democrats.
- With US corporate earnings and America’s working class now looking a lot like drowning passengers on the Titanic, gold is the obvious “choice of champions”.
- To view another key big picture chart for this mighty asset, please click here now. Double-click to enlarge.
- After a major upside breakout from an enormous bullish chart pattern, a pullback is expected and normal. The bigger the chart pattern is, the bigger the pullback can be.
- Gold could easily pull back to the $1320-$1250 price zone before roaring on towards my $1550 and $2000 price targets. That shouldn’t bother investors because this type of pullback action is typical after a major breakout.
- Regardless, a shallow pullback would obviously be preferred by most gold market investors and that’s also a realistic scenario.
- Please click here now. Double-click to enlarge. There is a bull flag in play on the daily gold chart.
- A cut in India’s gold tariff tax on Friday would be the likely catalyst for an upside breakout from the flag pattern. If there is no cut, a deeper correction would likely ensue. In that scenario, gold would probably pull back to at least $1360, but more likely to $1320-$1250 by the July 31 Fed meet.
- Please click here now. There’s a lot of talk about the gold versus silver ratio right now. Silver investors should exercise caution before racing in to buy silver just based on the level of the ratio. Here’s why:
- If Trump blows the 2020 election, America could quickly become a socialist state. Stock markets would incinerate and silver (an industrial metal) could fall further against gold on the ratio chart until inflation became obvious.
- Also, the monsoon season in India isn’t going well. It’s a mini-disaster now, and it could soon become a full disaster. If the crop harvest is horrific, Indian farmers won’t have additional money to buy physical silver bullion.
- They will likely just buy the gold they need to meet their needs for religious festivals and weddings. That will put even more upside pressure on the gold/silver ratio.
- U.S. corn crops are also in trouble. The crop situation in both India and America is significant. It could produce food inflation, especially if the democrats win the U.S. election. Regardless, silver investors should wait for inflation to appear rather than try to anticipate it.
- The 80 area on the ratio chart could be support now. Silver can do well against the dollar, but investors should wait for silver to break down from the green uptrend channel I’ve highlighted on the chart before getting too excited about… silver versus gold.
- Silver and mining stocks should be part of an overall allocation to the gold asset class. Amateur stock market investors need to be careful about trying to outperform the Dow with their own growth stocks portfolio. Growth stocks should be part of a US stock market portfolio. They are not a replacement for the Dow.
- Likewise, gold market investors should be careful about owning only silver or mining stocks with the belief they will outperform gold bullion over the long run. That’s unlikely to happen. A well-diversified gold asset class portfolio includes bullion, ETFs, and individual miners. Simply put, to stand tall, own it all!
- Please click here now. Double-click to enlarge this spectacular GDX chart. Note the bullish pennant formation in play. GDX has barely retraced any of its recent near-vertical blast to the upside. The 50% Fibonacci line sits at about $23.20. Gold stock accumulators need to get toes in the water as this pullback plays out. Why? Well, perhaps because history favours the bold!
- America could descend into a permanent socialist and stagflationary quagmire after the next election. This, while India’s first “semi-sane” finance minister in years could cut the gold import tax within just days. She is highly unlikely to unveil any new policy that is negative for gold. It’s obvious that for the world’s greatest asset and the companies that mine it, all major fundamental and technical lights are green!
Special Offer For Website Readers: Please send me an Email to freereports4@gracelandupdates.com and I’ll send you my free “The Bold Go For The Gold!” report. I highlight outperforming miners in the gold price pullback zone, with key buy and sell points for eight of them!
Stewart Thomson
Graceland Updates
Stewart Thomson is a retired Merrill Lynch broker. Stewart writes the Graceland Updates daily between 4am-7am. They are sent out around 8am-9am. The newsletter is attractively priced and the format is a unique numbered point form. Giving clarity of each point and saving valuable reading time.
Risks, Disclaimers, Legal
Stewart Thomson is no longer an investment advisor. The information provided by Stewart and Graceland Updates is for general information purposes only. Before taking any action on any investment, it is imperative that you consult with multiple properly licensed, experienced and qualified investment advisors and get numerous opinions before taking any action. Your minimum risk on any investment in the world is: 100% loss of all your money. You may be taking or preparing to take leveraged positions in investments and not know it, exposing yourself to unlimited risks. This is highly concerning if you are an investor in any derivatives products. There is an approx $700 trillion OTC Derivatives Iceberg with a tiny portion written off officially. The bottom line:
Are You Prepared?
Gold closed the month of June and the quarter above $1400/oz, holding the majority of its recent gains. That does not necessitate continued strength but it is a good sign.
The technicals and fundamentals are finally in place for Gold.
It is outperforming all major currencies and the Federal Reserve is weeks away from beginning a new cycle of rate cuts. The U.S. Dollar has lost its uptrend.
The near-term outlook is very strong but if the Federal Reserve cuts rates three or four times and Gold strongly outperforms the stock market then this move can go to $1900/oz.
But let’s focus and the here and now.
This breakout in Gold potentially has quite a bit of room to run.
The weekly chart below shows how there is very little resistance from $1420/oz to the low $1500s. Moreover, there are strong measured upside targets of $1600/oz to $1700/oz.
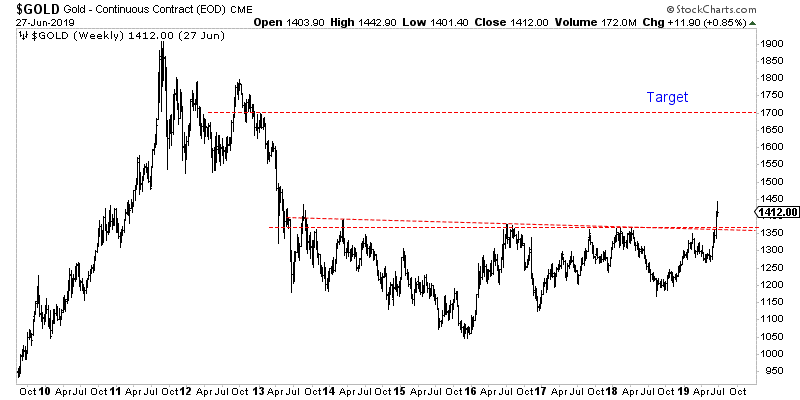
If Gold is going to trend higher towards $1600-$1700/oz, then the gold stocks are going to run much higher.
GDX is trading below $26. A break past $30-$31, would trigger a measured upside target of almost $50.
GDXJ is lagging both Gold and GDX but we know it can catch up quite quickly. First is needs to reach resistance at $50. A clean break past $50 triggers an upside target of ~$83.
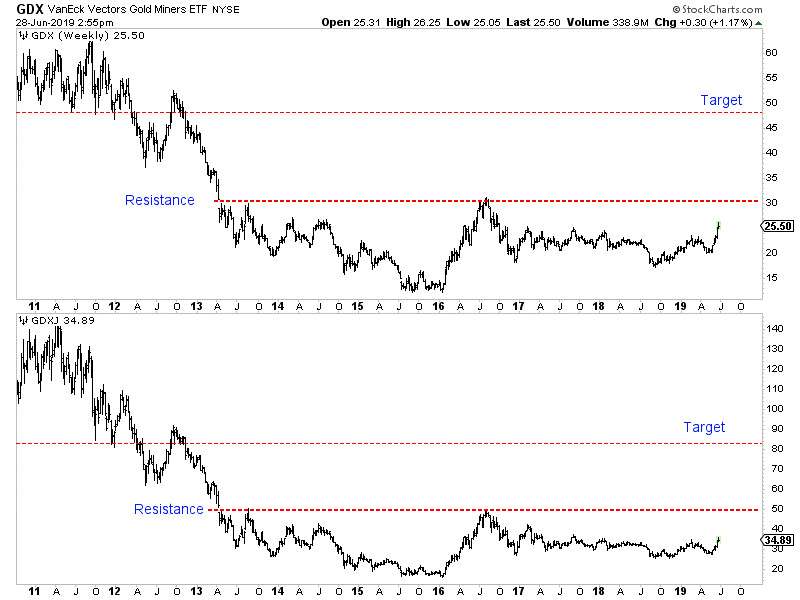
If the Fed does cut rates three or four times and either the greenback cracks more or Gold outperforms the stock market then Gold should be able to reach the $1700/oz target. If only one of those things happen then it still has a good shot to hit $1550/oz.
If the breakout gains traction then the gold stocks, which have strongly outperformed in recent weeks will continue to outperform. That is how these type of moves work.
As we noted last week, be wary of over anticipating a correction. Bull moves tend to remain overbought with overly bullish sentiment. The perfect entry point is behind us.
That being said if Gold does snap back to $1370-$1380/oz for a retest then that would be the time to put more capital work and aggressively so if you missed the last move. To learn which stocks we own and intend to buy that have 3x to 5x potential, consider learning more about our premium service.
Jordan Roy-Byrne CMT, MFTA
July 2, 2019
The gold miners’ stocks just blasted higher to a major decisive breakout this week! Driven by gold’s own huge bull-market breakout, the gold stocks surged well above vexing years-old upper resistance. The resulting new multi-year highs are a game changer, starting to shift long-apathetic sector sentiment back towards bullish. This will increasingly attract back traders, with their buying unleashing a virtuous circle of gains.
Traders usually track gold-stock fortunes with this sector’s most-popular exchange-traded fund, the GDX VanEck Vectors Gold Miners ETF. Launched in May 2006, this was the original gold-stock ETF. That big first-mover advantage has helped propel GDX to sector dominance. This week its net assets of $10.5b ran 44.6x larger than the next-biggest 1x-long major-gold-miners ETF! GDX is this sector’s leading benchmark.
And as recently as late May, neither speculators nor investors wanted anything to do with gold stocks. GDX slumped to $20.42 on May 29th, down 3.2% year-to-date. That was much worse than gold’s own slight 0.2% YTD decline then warranted. The gold stocks were really out of favor, largely ignored by apathetic traders. What a difference a month makes though, as their fortunes changed radically in June.
The gold miners started reanimating on May 31st, after Trump unleashed a bombshell warning to Mexico the evening before. He said tariffs would be imposed on all of its exports to the US if it didn’t seriously clamp down on illegal immigration across the US southern border. While Trump subsequently suspended those tariffs on Mexico’s promises to take action, that was the catalyzing event that awoke gold from its slumber.
A couple weeks ago I wrote an essay on the resulting mounting gold-stock upleg, explaining what was going on. But the developments since have been stunning, a colossal bullish surprise. Long neglected, GDX kept on marching higher mid-month leading into last week’s highly-anticipated Federal Open Market Committee decision. GDX closed at $23.67 the day before, already 15.9% higher in only several weeks.
The Fed kowtowed to stock traders’ hyper-dovish expectations and shifted its future rate bias from tightening to cutting, lighting a fire under gold. In last week’s essay I analyzed the gold bull breaking out, which was a momentous sea-change event. Gold rallied 1.0% to $1360 that day with top Fed officials forecasting a new rate cut next year. Gold-stock traders just shrugged at gold’s best close in 2.9 years.
They only bid GDX 1.4% higher to $24.00 after the Fed’s dovish shift. That only amplified gold’s gains by 1.4x, far short of the major gold stocks’ normal upside leverage to gold of 2x to 3x. While gold was high, it had tried and failed for years to break out above its $1350 resistance zone. And gold stocks suffered big and sharp selloffs after those previous forays proved unsuccessful. Traders didn’t expect this time to be different.
That Fed-Day evening New York time, Asian markets reopened as their Thursday morning rolled around. The Asian cultures have a deep cultural affinity for gold, and aggressively piled on in early trading. All that buying catapulted gold from $1358 to $1383 in about an hour! Partially thanks to Iran shooting down a big and sophisticated US surveillance drone overnight, gold’s Asia gains held in last Thursday’s U.S. trading.
Gold closed 2.1% higher that day at $1389, a decisive breakout 1%+ beyond its previous bull-market high of $1365 from way back in early July 2016! That also happened to be a 5.8-year closing high, so gold-stock traders realized big changes were afoot. They poured capital into gold stocks with a vengeance, catapulting GDX 4.4% higher on 3.5x its 3-month-average daily volume! That propelled it to $25.05 on close.
That was a critical technical level, as this GDX chart shows. It looks at the gold-stock price action of the last several years or so during gold’s own parallel bull market. GDX is rendered in blue, its key 50-day and 200-day moving averages in white and black, and 2.5-standard-deviation bands in light yellow. This leading gold-stock ETF had to decisively best years-old upper resistance at $25 to prove this time is different.
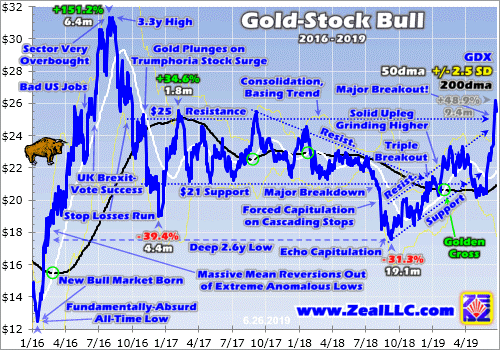
Since late 2016, GDX has largely been trapped in a giant consolidation basing trend running from $21 support to $25 resistance. $25 had proven a graveyard in the sky for gold stocks since November 2016, and needed to be overcome to change bearish psychology. GDX’s $25.05 close last Thursday on that new secular gold high was right there. But $25 resistance had to be broken decisively to impress traders.
Last Friday gold climbed another 0.7% to $1399 on pure momentum, yet gold-stock traders were worrying again. So GDX’s resulting 0.6% rally was pathetic, actually lagging gold. While not a decisive breakout over $25.25, or 1% above that long-vexing resistance line, GDX’s $25.21 close was darned close. The major gold stocks as measured by this ETF hadn’t been higher in 21.4 months. That was certainly bullish.
Last Friday and this Monday it was becoming evident that new-high psychology was taking root in gold. That is a powerful force motivating speculators and investors to buy. GDX $25 finally being materially surpassed has long been the key to unleashing this self-reinforcing sentiment in gold stocks. A couple weeks ago when GDX had merely climbed to $23.33 at best, I wrote about this coming critical breakout.
“The higher gold stocks climb, the more traders will want to buy them to ride that momentum. The more capital they deploy, the more gold stocks will rally. This normal virtuous circle of improving psychology and buying will become even more exaggerated as GDX $25 is surpassed. Seeing the highest gold-stock levels in several years will work wonders to improve sector sentiment, unleashing widespread bullishness.”
“This gold-stock upleg’s potential gains are massive spanning such a major upside breakout. Remember speculators and investors love chasing winners, so the higher gold stocks rally the more attractive they’ll look.” Nothing drives trader interest and thus capital inflows like major new highs. And GDX was right on the verge of entering that excitement-fueling zone decisively over $25 as markets opened for trading this week.
This Monday gold surged another 1.4% higher to a dazzling $1419 close! That new 6.1-year high was fueled by sheer momentum, there was little gold-moving news that day. Gold’s new-high psychology was already feeding on itself. And that enthusiasm spilled into gold stocks, with traders bidding GDX another 3.8% higher to $26.17. That was the long-awaited decisive $25 breakout, with GDX blasting 4.7% beyond!
The importance of gold stocks powering through to new 2.7-year highs cannot be overstated. Major new highs act like magnets attracting traders’ attention, interest, and capital. They prove that the long-ignored gold stocks are in bull-market-rallying mode again, portending massive gains to come. They also garner media coverage, which greatly increases the number of traders looking to ride the breakout momentum.
Since late May’s depressing low, GDX had rocketed a huge 28.2% higher in just 18 trading days! Stock traders would kill for those kinds of fast gains. And the major gold stocks’ upleg-to-date advance per this ETF had grown to 48.9% over 9.4 months. That would be impressive for any sector, but is actually still on the smaller side for the high-potential gold stocks. Their uplegs have tended to grow much larger in the past.
The last time gold was hitting new bull-market highs was in the first half of 2016. That was the maiden upleg of this bull, where gold soared 29.9% higher in just 6.7 months. The resulting excitement fueled a deluge of capital roaring into gold stocks, which skyrocketed GDX an incredible 151.2% higher in roughly that same span! While that upleg was exceptionally large, the last major gold-stock bull’s uplegs were big.
Before GDX came along, the primary gold-stock benchmark was the classic HUI NYSE Arca Gold BUGS Index. Like GDX it tracks most of the same major gold stocks, so HUI and GDX price action are usually indistinguishable. The last gold-stock bull straddling GDX’s birth saw the HUI soar 1664.4% higher over 10.8 years between November 2000 to September 2011! Those gains accrued over 12 separate uplegs.
One was an anomaly, the epic mean-reversion rebound after late 2008’s first-in-a-century stock panic. Excluding it, the other 11 normal gold-stock uplegs in that last bull averaged 80.7% gains over 7.9 months per the HUI! So GDX’s 48.9% upleg-to-date advance as of early this week remains well below precedent to be mature. Odds are it will grow much larger in line with past major uplegs before giving up its ghost.
Gold stocks paid a terrible price as gold drifted sideways over the last several years, trapped under that $1350 resistance zone which masked its in-progress bull. That’s why GDX mostly meandered between those $21 support and $25 resistance lines since late 2016. That chronic inability to break out to new highs gradually scared away the great majority of traders, leaving gold stocks incredibly undervalued.
Gold-stock prices are ultimately determined by gold, because it overwhelmingly drives their earnings. So one way to measure gold-stock “valuations” is looking at them relative to gold. This can be done using the GDX/GLD Ratio, the leading gold-stock ETF’s price divided by the flagship gold ETF’s price. That of course is the GLD SPDR Gold Shares. I last wrote about and analyzed the GGR in an early-February essay.
This Monday as GDX finally decisively broke above $25 to close at $26.17, GLD’s shares closed way up at $133.94. That made for a GGR of just 0.195x at the best gold-stock levels in several years. Yet that was still really low by historical standards. The last normal years for the gold market were arguably 2009 to 2012. That stretch was sandwiched between 2008’s stock panic and the Fed’s QE3 stock-market levitation.
The resulting extreme and irrational stock euphoria had a devastating impact on gold. But from 2009 to 2012 before markets became wildly central-bank-distorted and fake, the GDX/GLD ratio averaged 0.381x. That encompassed all kinds of gold environments, from strong bull to budding bear. So there’s no better recent span to approximate gold stocks’ “fair value” relative to gold. Applying that today is super-bullish.
At Monday’s $133.94 GLD close, that historical-average fair-value GGR would put GDX at $51.03. That is a whopping 95.0% higher than its actual close that day! Gold stocks are literally trading at just half of where they ought to be at today’s gold prices, meaning they still need to double just to catch up. And that doesn’t account for higher future gold prices or the GGR overshooting proportionally higher after mean reverting!
At best GDX has powered 151.2% higher within gold’s current bull. But during gold’s last secular bull, the HUI skyrocketed an astounding 1664.4% higher over 10.8 years! Gold stocks are one of the highest-potential sectors in the entire stock markets. When they really start running the resulting gains can truly generate life-changing wealth. That’s why contrarians are willing to suffer between their mighty bull runs.
This week’s long-awaited GDX $25 breakout is a critical technical milestone that is likely signaling much-bigger gains to come. The gold-stock surge this month is really special, actually the strongest early-summer performance for this sector in modern gold-bull history! Normally this time of year I’d be updating my gold-summer-doldrums research, highlighting the weakest time of the year seasonally for gold stocks.
Hopefully I can find time next week. This chart looks at the HUI’s average summer performances in all modern gold-bull-market years. Each summer is individually indexed to its final close in May, keeping gold-stock price action perfectly comparable regardless of prevailing gold levels. The yellow lines show 2001 to 2012 and 2016 to 2017. Last year’s summer gold-stock action is rendered in light blue for comparison.
All these lines averaged together form the red one, revealing the center-mass drift trend of gold stocks in market summers. Gold stocks’ current 2019 summer action is superimposed over all that in dark blue. As you can see, this past month’s action is the best summer start gold stocks have seen since at least 2001! They are even tracking better than the summer of 2016 in this gold bull’s mighty maiden upleg.
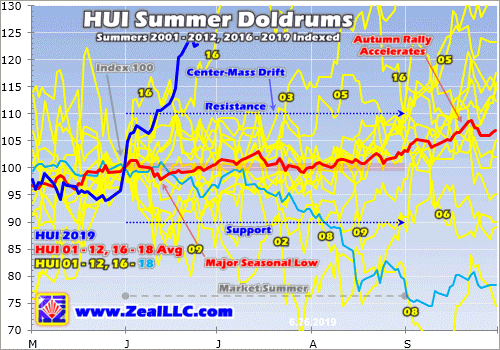
This chart really illuminates how unique gold stocks’ powerful June rally has been. This is more evidence that a sea-change sentiment shift is underway in this long-neglected sector. That sure implies the gains to come will be much larger than traders expect, driving GDX towards its own new bull highs on balance. In early August 2016, GDX hit its bull-to-date high of $31.32. That’s 19.7% higher than Monday’s breakout close.
The major gold miners’ fundamentals remain strong and bullish too, supporting much-higher stock prices. After every quarterly earnings season, I dig deep into the GDX gold miners’ fundamentals. They finished reporting their latest Q1’19 results about 6 weeks ago, and I wrote a comprehensive essay analyzing them. At that point GDX was still really out of favor, languishing under its $21 multi-year support line.
Stock prices are ultimately determined by underlying corporate earnings, and for the gold miners that is totally dependent on prevailing gold prices. Gold-mining costs are best measured in all-in-sustaining-cost terms. In Q1’19 the GDX gold miners’ AISCs averaged $893 per ounce. That’s right in line with the prior four quarters’ trend of $884, $856, $877, and $889. Gold-mining profits are going to soar with higher gold.
Gold averaged $1303 in Q1 when the major gold miners were producing it for $893. That implies they were earning $410 per ounce mined. $1400 and $1500 gold are only 7.4% and 15.1% higher from there. As the GDX gold miners’ AISCs reveal, gold-mining costs are largely fixed from quarter to quarter and don’t follow gold higher. So assuming flat AISCs, gold-mining profits surge to $507 at $1400 and $607 at $1500.
That’s 23.7% and 48.0% higher from Q1’19 levels on mere 7.4% and 15.1% gold gains from that quarter’s average price! And as of earlier this week, gold had already climbed 9.2% of that. The major gold miners’ fundamentals are already bullish, but improve greatly at higher prevailing gold prices. With earnings growth hard to come by in general stock markets this year, the gold stocks will be even more alluring.
All the stars are aligning for big gold-stock gains in coming months, with their technicals, sentiment, and fundamentals all looking very bullish. This breaking-out gold-stock upleg has excellent potential to grow much larger later this year, greatly rewarding contrarians buying in early. More and more traders are becoming aware of this sector’s huge potential, and their buying will push the gold stocks much higher.
This is not the summer to check out, but to do your homework and get deployed in great gold stocks. All portfolios need a 10% allocation in gold and its miners’ stocks! Many smaller mid-tier and junior miners have superior fundamentals and upside potential to the majors of GDX. And by the time gold stocks get really exciting again hitting their own new bull highs, much of the easy gains will have already been won.
One of my core missions at Zeal is relentlessly studying the gold-stock world to uncover the stocks with superior fundamentals and upside potential. The trading books in both our popular weekly and monthly newsletters are currently full of these better gold and silver miners. Mostly added in recent months as gold stocks recovered from selloffs, their unrealized gains were already running as high as +109% this week!
If you want to multiply your capital in the markets, you have to stay informed. Our newsletters are a great way, easy to read and affordable. They draw on my vast experience, knowledge, wisdom, and ongoing research to explain what’s going on in the markets, why, and how to trade them with specific stocks. As of Q1 we’ve recommended and realized 1089 newsletter stock trades since 2001, averaging annualized realized gains of +15.8%! That’s nearly double the long-term stock-market average. Subscribe today and take advantage of our 20%-off summer-doldrums sale!
The bottom line is gold stocks have joined gold with their own decisive breakout! GDX finally burst back above its long-oppressing $25 upper-resistance line this week. These multi-year highs are a game changer for gold stocks, ushering back long-absent bullish psychology enticing traders to return. They’ve been gone for so long that this entire gold-mining sector is deeply undervalued relative to prevailing gold prices.
That portends huge upside potential as gold and its miners’ stocks return to the limelight on their major breakouts. Traders love chasing winners to ride their upside momentum, and buying begets buying. Of course gold-stock uplegs don’t power higher in straight lines, periodic selloffs to rebalance sentiment are normal and healthy. So any material gold-stock weakness should be used to accumulate sizable positions.
Adam Hamilton, CPA
June 28, 2019
Copyright 2000 – 2019 Zeal LLC (www.ZealLLC.com
Gold has finally broken out to the upside.
In Asia trading on Thursday, Gold exploded through the $1360 to $1370 resistance zone and was able to hold the gains throughout the day, closing above $1395/oz.
As we pen this article, Gold has to chance to break $1400/oz by the weekend. The close of the month (and quarter) next week will provide an additional clue as to the sustainability of this strength.
The gold stocks meanwhile have been on an absolute tear. GDX is up 16 of the past 17 trading days and has gained 23% over that period. GDXJ is up 13 of the past 17 sessions and has also gained 23% during that period.
GDX closed right at resistance at $25. It could blow through it and reach a multi-year high at $27 or it could first correct and consolidate around $25.
GDX’s various indicators are very encouraging but not quite at confirmed bull market levels.
Roughly a third of GDX made new highs, which is the highest amount since August 2016. Also, 79% of miners closed above the 200-day moving average. Surpassing 90% would be quite bullish.
The GDX to S&P ratio needs to close above its recent peak to signal sustainable relative strength.
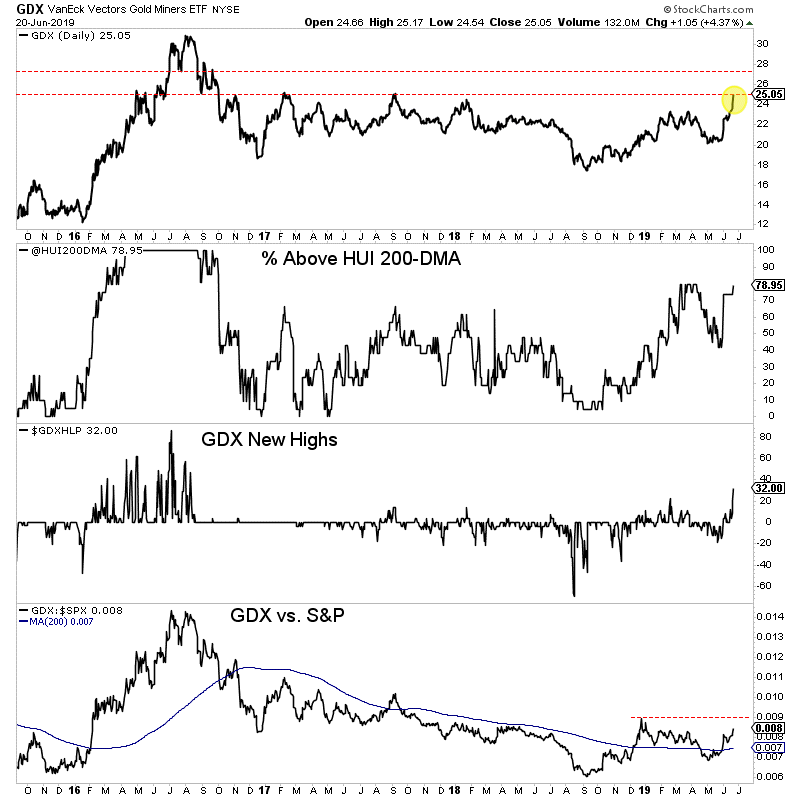
Turning to GDXJ, we see that it is slightly behind GDX in nominal and relative terms. It faces a bit of resistance here around $35 but more resistance at $37.
The percentage of GDXJ stocks above the 200-day moving average and at new highs are at very encouraging levels but need to advance higher to confirm a new bull market.
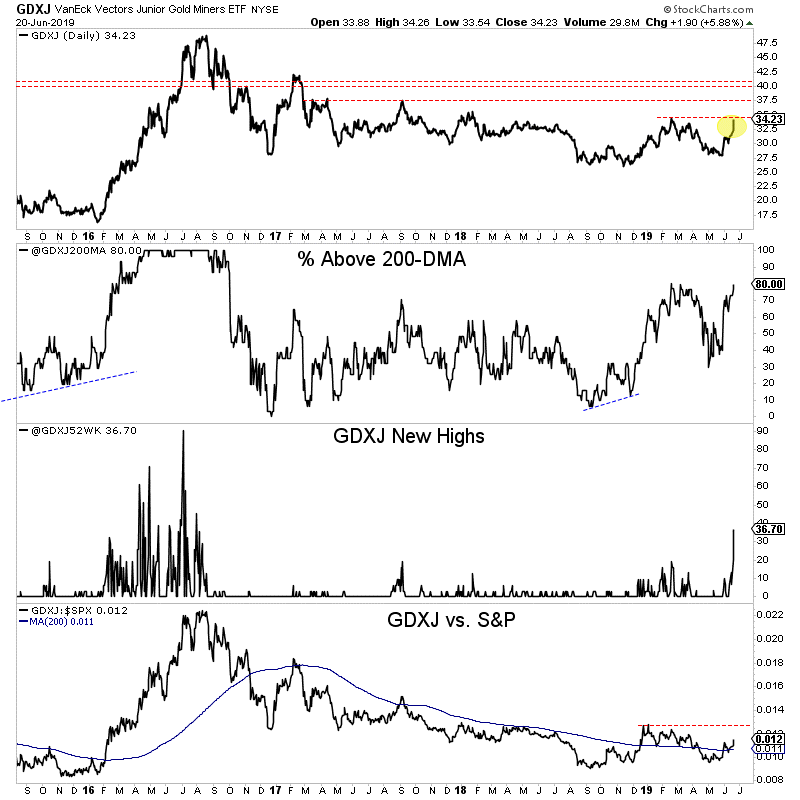
Assuming Gold maintains current strength without more than a minor retest of previous resistance then we should look for GDX and GDXJ to approach the aforementioned resistance targets. Initially, that means GDX $27 and GDXJ $37.
If the miners were to reach those targets then these various indicators should reach bull market levels at the same time.
The fundamentals are finally in place for precious metals (as we’ve mentioned in recent articles) and that, along with bullish technicians is why we should remain bullish.
Unless Gold loses the breakout gains into the end of the quarter, then I would not anticipate too much of a pullback. Bull moves tend to remain overbought with overly bullish sentiment.
As we noted last week, the gold stocks, junior gold stocks and Silver are ready to explode higher once the breakout move in Gold is confirmed. To learn which stocks we own and intend to buy that have 3x to 5x potential, consider learning more about our premium service.
By Jordan Roy-Byrne CMT, MFTA
June 21, 2019
1. The fear trade for gold continues to gain fundamental strength. The technical picture is also solid. Please click here now. Double-click to enlarge. Gold is poised for significant upside action in the second half of this year.
2. A large bull wedge is in play as institutional investors become more concerned about the slowing global economy.
3. Please click here now. Double-click to enlarge. This Nasdaq ETF chart (QQQ-NYSE) looks particularly concerning. A break under the $177.50 price zone could be followed by a significant decline.
4. The recent peaks and troughs for the stock market are in sync with the peaks and troughs for the price of oil. If oil can’t rise with Iran being pounded by US government sanctions, something is wrong.
5. Oil could crash if there’s a softening of the sanctions and that could cause a stock market crash.
6. Please click here now. Double-click to enlarge this oil price chart. Low priced oil helps consumers, but it hurts stock market earnings. An ominous bear flag has appeared on the chart.
7. US frackers need $60 oil on a consistent basis. They help provide the stock market with the earnings growth it needs to satisfy institutional investors.
8. $60 oil on a sustained basis is just not happening right now, and I don’t expect it will happen without a major upturn in the global economy.
9. Please click here now. Institutional analysts are beginning to view the tariff taxes as a growth-inhibiting quagmire that won’t go away for a long time.
10. They are also beginning to talk about the inflationary implications of the tariffs. What happens if inflation picks up and Trump successfully pressures the Fed into leaving rates alone?
11. That could cause much greater concern about inflation amongst economists and money managers would likely turn to gold to protect their portfolios.
12. The second of half of 2019 is likely to see gold get significant investor interest… particularly if the stock market continues to weaken while inflationary pressures rise.
13. Both my short-term and medium-term stock market trade signals have moved to a “ sell ”. The long-term buy signal is still holding but it looks shaky.
14. Please click here now. Double-click to enlarge this dollar versus yen chart. The dollar looks terrible and a new leg lower seems imminent.
15. The dollar’s softness relates to lack of interest in US risk-on markets by investors. They are more interested in safety now than risk-related opportunity. That’s good news for gold!
16. The US government has referred to the tariff taxes issue as a war. In the short-term, it’s producing higher prices for US consumers and dragging down global GDP growth.
17. In the medium-term, China’s government could restrict rare earth exports to America. That would probably cause a stock market crash. If the US economy keeps softening as China begins to handle the tariffs issue more aggressively, US democrats could get elected.
18. In turn, that would put the dollar front and centre in the next economic downturn.
19. My big focus for the long-term asset allocation is the Indian stock market and gold. That’s because Indian GDP growth will almost certainly rise to 10%+ and stay there for decades.
20. This, while America probably grows at 3%-4% in a good year and averages 1%-2%. There’s only so much upside “ blood ” that the Fed can squeeze out of a QE “ stone ” for US stock market investors with that kind of growth. The demographics just aren’t there, and the entitlements are too big of a drag on the economy.
21. I’m vastly more focused on short-term trading for the US stock market now than long-term investment. I do that at www.guswinger.com where I also trade NUGT and DUST for gold stock trading enthusiasts.
22. Please click here now. Double-click to enlarge. I don’t expect much action from GDX and gold stocks until gold bursts out of the bull wedge formation and the US stock market begins another leg down.
23. That likely happens as institutional investors accept the tariff talks as an unresolvable quagmire and begin to wonder how the Fed will deal with emerging stagflation.
24. A Friday close of $23 for GDX, $14 for Barrick (GOLD-NYSE), $36 for Newmont (NEM-NYSE) and $46 for Agnico (AEM-NYSE) are the “ launchpad ” numbers for gold stock investors to focus on. When those numbers are hit, basis a Friday close, gold, silver, and the miners will be ready for a major bull run!
Special Offer For Website Readers: Please send me an Email to freereports4@gracelandupdates.com and I’ll send you my free “Gold Stock Fresh Buy & Sell Signals!” report. I highlight key signals for stocks like Kirkland Lake that offer lucrative profits for both traders and investors!
Cheers
Stewart Thomson
Graceland Updates
Written between 4am-7am. 5-6 issues per week. Emailed at approx 9am daily.
www.gracelandupdates.com
gracelandjuniors.com
www.guswinger.com
Email:
stewart@gracelandupdates.com
stewart@gracelandjuniors.com
stewart@guswinger.com
Stewart Thomson is a retired Merrill Lynch broker. Stewart writes the Graceland Updates daily between 4am-7am. They are sent out around 8am-9am. The newsletter is attractively priced and the format is a unique numbered point form. Giving clarity of each point and saving valuable reading time.
Risks, Disclaimers, Legal
Stewart Thomson is no longer an investment advisor. The information provided by Stewart and Graceland Updates is for general information purposes only. Before taking any action on any investment, it is imperative that you consult with multiple properly licensed, experienced and qualified investment advisors and get numerous opinions before taking any action. Your minimum risk on any investment in the world is: 100% loss of all your money. You may be taking or preparing to take leveraged positions in investments and not know it, exposing yourself to unlimited risks. This is highly concerning if you are an investor in any derivatives products. There is an approx $700 trillion OTC Derivatives Iceberg with a tiny portion written off officially. The bottom line:
Are You Prepared?
The mid-tier gold miners’ stocks in the sweet spot for price-appreciation potential have been struggling in recent months, grinding lower with gold. Their strong early-year momentum has been sapped by recent stock-market euphoria. But gold-mining stocks are more important than ever for prudently diversifying portfolios. The mid-tiers’ recently-reported Q1’19 results reveal their fundamentals remain sound and bullish.
The wild market action in Q4’18 emphasized why investors shouldn’t overlook gold stocks. All portfolios need a 10% allocation in gold and its miners’ stocks! As the flagship S&P 500 broad-market stock index plunged 9.2% in December alone, nearly entering a new bear market, the leading mid-tier gold-stock ETF surged 13.7% higher that month. That was a warning shot across the bow that these markets are changing.
Four times a year publicly-traded companies release treasure troves of valuable information in the form of quarterly reports. Required by the U.S. Securities and Exchange Commission, these 10-Qs and 10-Ks contain the best fundamental data available to traders. They dispel all the sentiment distortions inevitably surrounding prevailing stock-price levels, revealing corporations’ underlying hard fundamental realities.
The global nature of the gold-mining industry complicates efforts to gather this important data. Many mid-tier gold miners trade in Australia, Canada, South Africa, the United Kingdom, and other countries with quite-different reporting requirements. These include half-year reporting rather than quarterly, long 90-day filing deadlines after year-ends, and very-dissimilar presentations of operating and financial results.
The definitive list of mid-tier gold miners to analyze comes from the GDXJ VanEck Vectors Junior Gold Miners ETF. Despite its misleading name, GDXJ is largely dominated by mid-tier gold miners and not juniors. GDXJ is the world’s second-largest gold-stock ETF, with $3.6b of net assets this week. That is only behind its big-brother GDX VanEck Vectors Gold Miners ETF that includes the major gold miners.
Major gold miners are those that produce over 1m ounces of gold annually. The mid-tier gold miners are smaller, producing between 300k to 1m ounces each year. Below 300k is the junior realm. Translated into quarterly terms, majors mine 250k+ ounces, mid-tiers 75k to 250k, and juniors less than 75k. GDXJ was originally launched as a real junior-gold-stock ETF as its name implies, but it was forced to change its mission.
Gold stocks soared in price and popularity in the first half of 2016, ignited by a new bull market in gold. The metal itself awoke from deep secular lows and surged 29.9% higher in just 6.7 months. GDXJ and GDX skyrocketed 202.5% and 151.2% higher in roughly that same span, greatly leveraging gold’s gains. As capital flooded into GDXJ to own junior miners, this ETF risked running afoul of Canadian securities laws.
Canada is the center of the junior-gold universe, where most juniors trade. Once any investor including an ETF buys up a 20%+ stake in a Canadian stock, it is legally deemed a takeover offer. This may have been relevant to a single corporate buyer amassing 20%+, but GDXJ’s legions of investors certainly weren’t trying to take over small gold miners. GDXJ diversified away from juniors to comply with that archaic rule.
Smaller juniors by market capitalization were abandoned entirely, cutting them off from the sizable flows of ETF capital. Larger juniors were kept, but with their weightings within GDXJ greatly demoted. Most of its ranks were filled with mid-tier gold miners, as well as a handful of smaller majors. That was frustrating, but ultimately beneficial. Mid-tier gold miners are in the sweet spot for stock-price-appreciation potential!
For years major gold miners have struggled with declining production, they can’t find or buy enough new gold to offset their depletion. And the stock-price inertia from their large market capitalizations is hard to overcome. The mid-tiers can and are boosting their gold output, which fuels growth in operating cash flows and profitability. With much-lower market caps, capital inflows drive their stock prices higher much faster.
Every quarter I dive into the latest results from the top 34 GDXJ components. That’s simply an arbitrary number that fits neatly into the tables below, but a commanding sample. These companies represented 82.7% of GDXJ’s total weighting this week, even though it contained a whopping 72 stocks! 3 of the top 34 were majors mining 250k+ ounces, 21 mid-tiers at 75k to 250k, 7 “juniors” under 75k, and 3 explorers with zero.
These majors accounted for 13.0% of GDXJ’s total weighting, and really have no place in a “Junior Gold Miners ETF” when they could instead be exclusively in GDX. These mid-tiers weighed in at 57.6% of GDXJ. The “juniors” among the top 34 represented just 8.9% of GDXJ’s total. But only 4 of them at a mere 4.4% of GDXJ are true juniors, meaning they derive over half their revenues from actually mining gold.
The rest include a primary silver miner, gold-royalty company, and gold streamer. GDXJ has become a full-on mid-tier gold miners ETF, with modest major and tiny junior exposure. Traders need to realize it is not a junior-gold investment vehicle as advertised. GDXJ also has major overlap with GDX. Fully 29 of these top 34 GDXJ gold miners are included in GDX too, with 23 of them also among GDX’s top 34 stocks.
The GDXJ top 34 accounting for 82.7% of its total weighting also represent 37.4% of GDX’s own total weighting! The GDXJ top 34 mostly clustered between the 10th- to 40th-highest weightings in GDX. Thus over 3/4ths of GDXJ is made up by almost 3/8ths of GDX. But GDXJ is far superior, excluding the large gold majors struggling with production growth. GDXJ gives much-higher weightings to better mid-tier miners.
The average Q1’19 gold production among GDXJ’s top 34 was 149k ounces, a bit over half as big as the GDX top 34’s 267k average. Despite these two ETFs’ extensive common holdings, GDXJ is increasingly outperforming GDX. GDXJ holds many of the world’s best mid-tier gold miners with big upside potential as gold’s own bull resumes powering higher. Thus it is important to analyze GDXJ miners’ latest results.
So after every quarterly earnings season I wade through all available operational and financial results and dump key data into a big spreadsheet for analysis. Some highlights make it into these tables. Any blank fields mean a company hadn’t reported that data as of this Wednesday. The first couple columns show each GDXJ component’s symbol and weighting within this ETF as of this week. Not all are US symbols.
18 of the GDXJ top 34 primarily trade in the U.S., 5 in Australia, 8 in Canada, and 3 in the U.K. So some symbols are listings from companies’ main foreign stock exchanges. That’s followed by each gold miner’s Q1’19 production in ounces, which is mostly in pure-gold terms excluding byproducts often found in gold ore like silver and base metals. Then production’s absolute year-over-year change from Q1’18 is shown.
Next comes gold miners’ most-important fundamental data for investors, cash costs and all-in sustaining costs per ounce mined. The latter directly drives profitability which ultimately determines stock prices. These key costs are also followed by YoY changes. Last but not least the annual changes are shown in operating cash flows generated, hard GAAP earnings, revenues, and cash on hand with a couple exceptions.
Percentage changes aren’t relevant or meaningful if data shifted from positive to negative or vice versa, or if derived from two negative numbers. So in those cases I included raw underlying data rather than weird or misleading percentage changes. In cases where foreign GDXJ components only released half-year data, I used that and split it in half where appropriate. That offers a decent approximation of Q1’19 results.
Symbols highlighted in light blue newly climbed into the ranks of GDXJ’s top 34 over this past year. And symbols highlighted in yellow show the rare GDXJ-top-34 components that aren’t also in GDX. If both conditions are true blue-yellow checkerboarding is used. Production bold-faced in blue shows the handful of junior gold miners in GDXJ’s higher ranks, under 75k ounces quarterly with over half of sales from gold.
This whole dataset together compared with past quarters offers a fantastic high-level read on how mid-tier gold miners as an industry are faring fundamentally. While slightly-lower gold prices made Q1 somewhat challenging, the GDXJ miners generally fared quite well. They mostly kept costs in check, paving the way for profits to soar and really amplify gold’s overdue-to-resume bull market. That’s very bullish for their stocks.
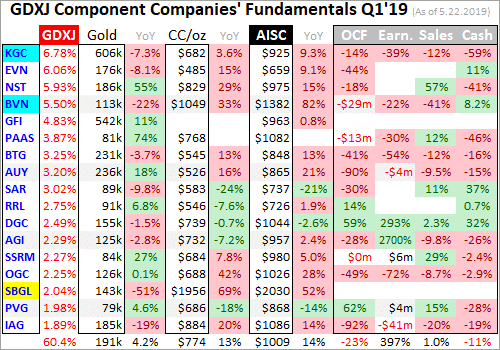
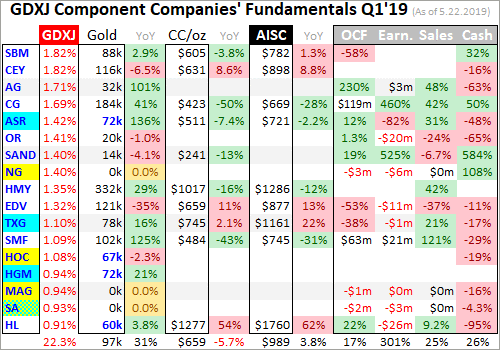
GDXJ’s managers have continued to fine-tune its ranks over this past year, making some good changes. For some inexplicable reason, one of the world’s largest gold miners AngloGold Ashanti was one of this ETF’s top holdings as discussed in Q3’18. AU was finally kicked out and replaced with a smaller major gold miner Kinross and a mid-tier Buenaventura. Together they now account for 12.3% of GDXJ’s weighting.
Reshuffling at the top makes year-over-year changes less comparable, particularly given KGC’s larger size relative to most of the rest of GDXJ’s stocks. 4 other smaller stocks also climbed into this ETF’s top-34 ranks. As GDXJ is largely market-cap weighted, it is normal for companies to rise into and fall out of the top 34’s lower end. All these year-over-year comparisons are across somewhat-different top-34 stocks.
Production has always been the lifeblood of the gold-mining industry. Gold miners have no control over prevailing gold prices, their product sells for whatever the markets offer. Thus growing production is the only manageable way to boost revenues, leading to amplified gains in operating cash flows and profits. Higher production generates more capital to invest in expanding existing mines and building or buying new ones.
Gold-stock investors have long prized production growth above everything else, as it is inexorably linked to company growth and thus stock-price-appreciation potential. The top 34 GDXJ gold miners excelled in that department, growing their aggregate Q1 output by a big 15.6% YoY to 4.6m ounces! That’s impressive, trouncing both the major gold miners dominating GDX as well as the entire world’s gold-mining industry.
Last week I analyzed the GDX majors’ Q1’19 results, showing they are still struggling to replace depleting production. The GDX top 34’s total output plunged a sharp 6.3% YoY to 8.8m ounces, but if adjusted for a recent in-process mega-merger that decline moderates to 0.2% YoY. That’s still much worse than the world gold-mining industry as a whole, as reflected in the World Gold Council’s comprehensive quarterly data.
Total global gold production in Q1’19 climbed 1.1% YoY to 27.4m ounces, which the majors still fell well short of. The GDXJ mid-tiers were able to enjoy very-strong growth because this ETF isn’t burdened by the struggling majors. Again GDXJ’s components start at the 10th-highest weighting in GDX. The 9 above that averaged huge Q1 production of 537k ounces, which is fully 3.6x bigger than the GDXJ-top-34 average!
The more gold miners produce, the harder it is to even keep up with relentless depletion let alone grow their output consistently. Large economically-viable gold deposits are getting increasingly difficult to find and ever-more-expensive to develop, with low-hanging fruit long since exploited. But with much-smaller production bases, mine expansions and new mine builds generate big output growth for mid-tier golds.
Their awesome Q1 production surge wasn’t just from the new components climbing into the ranks of the top 34 over this past year. The average growth rate of all these companies producing weighed in at 16.1% YoY, right in line with the 15.6% total growth. The law-of-large-numbers growth limitations also apply to gold miners’ market capitalizations. The GDXJ top 34 averaged just $1.7b in the middle of this week.
Last week the GDX top 34 sported a far-higher average of $5.2b. With the mid-tiers generally less than a third as big as the majors, their stock prices have much-less inertia. Capital inflows as gold stocks return to favor on gold rallying propel mid-tier stocks to much-higher levels faster than majors. They truly are the sweet spot of the gold-stock realm, not bogged down like the majors with way less risk than the juniors.
Also interesting on the GDXJ production front last quarter was silver. This “Junior Gold Miners ETF” also includes major silver miners, both primary and byproduct ones. The GDXJ top 34’s silver mined surged 13.8% higher YoY to 26.5m ounces! For comparison the GDX top 34’s total reported silver output of 27.3m actually plunged 25.2% YoY. Even mega-merger-adjusted their silver production still fell 8.0% YoY.
The mid-tier gold miners continue to prove all-important production growth is achievable off smaller bases. With a handful of mines or less to operate, mid-tiers can focus on expanding them or building a new mine to boost their output beyond depletion. But the majors are increasingly failing to do this from the already-high production bases they operate at. As long as majors are struggling, it is prudent to avoid them.
GDXJ investors would be better served if this ETF contained no major gold miners producing over 250k ounces a quarter on average. They still command over 1/8th of its weighting, which could be far better reallocated in mid-tiers and juniors. If VanEck kept the major gold miners in GDX where they belong, it would give GDXJ much-better upside potential. That would make this ETF more popular and successful.
In gold mining, production and costs are generally inversely related. Gold-mining costs are largely fixed quarter after quarter, with actual mining requiring about the same levels of infrastructure, equipment, and employees. So the higher production, the more ounces to spread mining’s big fixed costs across. Thus with sharply-higher YoY production in Q1’19, the GDXJ top 34 should’ve seen proportionally-lower costs.
There are two major ways to measure gold-mining costs, classic cash costs per ounce and the superior all-in sustaining costs per ounce. Both are useful metrics. Cash costs are the acid test of gold-miner survivability in lower-gold-price environments, revealing the worst-case gold levels necessary to keep the mines running. All-in sustaining costs show where gold needs to trade to maintain current mining tempos indefinitely.
Cash costs naturally encompass all cash expenses necessary to produce each ounce of gold, including all direct production costs, mine-level administration, smelting, refining, transport, regulatory, royalty, and tax expenses. In Q1’19 these top-34-GDXJ-component gold miners that reported cash costs averaged $730 per ounce. That was up a sizable 5.4% YoY, and much worse than the GDX top 34’s $616 average.
These were the highest average mid-tier cash costs seen in the 12 quarters I’ve been doing this research, which was potentially concerning. Thankfully that was heavily skewed by some extreme outliers relative to this sector and their own history. Peru’s Buenaventura saw cash costs soar 33% YoY to $1049! That was a one-off anomaly driven by the company halting one of its key mines in January to centralize operations.
Two major South African miners saw really-high cash costs too, Sibanye’s eye-popping $1956 per ounce and Harmony’s $1017. South Africa’s former gold juggernaut has been struggling for years, facing endless government corruption and very-deep and expensive mines. Sibanye in particular really needs to get kicked out of GDXJ, as it is now a primary platinum-group-metals miner at well over 5/8ths of Q1 revenues.
Finally Hecla’s cash costs skyrocketed 54% YoY to $1277 in Q1, mainly due to ongoing problems at its Nevada operations. It actually suspended 2019 production and cost guidance on these, which certainly isn’t a good sign! None of these 4 gold miners represent mid-tiers as a whole. Excluding them, the rest of the GDXJ top 34 averaged excellent cash costs of just $622 last quarter. That’s on the low end of the range.
Way more important than cash costs are the far-superior all-in sustaining costs. They were introduced by the World Gold Council in June 2013 to give investors a much-better understanding of what it really costs to maintain gold mines as ongoing concerns. AISCs include all direct cash costs, but then add on everything else that is necessary to maintain and replenish operations at current gold-production levels.
These additional expenses include exploration for new gold to mine to replace depleting deposits, mine-development and construction expenses, remediation, and mine reclamation. They also include the corporate-level administration expenses necessary to oversee gold mines. All-in sustaining costs are the most-important gold-mining cost metric by far for investors, revealing gold miners’ true operating profitability.
The GDXJ-top-34 AISC picture in Q1’19 looked much like the cash-cost one. Average AISCs defied much-higher production to surge 6.0% higher YoY to $1002 per ounce! While still far below Q1’s average gold price of $1303, those were the highest AISCs seen by far since at least Q2’16 when I started this thread of research. But again that was heavily skewed by those same 4 gold miners struggling with sky-high costs.
Excluding BVN’s $1382, SBGL’s insane $2030, HMY’s $1286, and HL’s extreme $1760, the rest of the GDXJ top 34 averaged a far-better $891 per ounce. That was 5.8% lower than Q1’18’s average, indeed reflecting fast-growing output. It was also right in line with the 2017-and-2018 quarterly average of $903, as well as the top 34 GDX majors’ Q1’19 average of $893. Most mid-tier golds are keeping costs under control.
Interestingly gold-mining costs tend to peak in Q1s before drifting lower in subsequent quarters. That’s because gold miners often make capital improvements and sequence mining in such a way that Q1s see the lowest ore grades and thus lowest production. I discussed this in some depth last week in my GDX Q1’19 essay. Odds are the GDXJ mid-tiers’ costs will decline significantly in coming quarters as output ramps.
Yet even at that distorted artificially-high Q1 average AISC of $1002, the elite GDXJ gold miners have great potential to enjoy surging profits and hence stock prices as gold recovers. The average gold price in Q1’19 drifted 1.9% lower YoY to $1303. That implies the mid-tier miners were averaging profits around $301 per ounce. Gold is due to head far higher as these bubble-valued stock markets face an overdue bear.
That will rekindle gold investment demand like usual, those new capital inflows fueling a major gold upleg. A mere 7.7% advance from $1300 would carry gold to $1400, and just 15.4% would hit $1500. Those are modest and easily-achievable gains by past-gold-upleg standards. During essentially the first half of 2016 after major stock-market selloffs, gold blasted 29.9% higher in 6.7 months! Gold can rapidly return to favor.
At $1300 and Q1’s $1002 average AISCs, the major gold miners are still earning a very-healthy $298 per ounce. But at $1400 and $1500 gold, those profits soar to $398 and $498. That’s 33.6% and 67.1% higher on relatively-small 7.7% and 15.4% gold uplegs from here! And if the mid-tiers’ average AISCs retreat back near $900 without the outliers, that profits growth rockets to 67.8% at $1400 and 101.3% at $1500!
The gold miners’ awesome inherent profits leverage to gold is why this beaten-down forsaken sector is so darned attractive. The major gold stocks of GDX tend to amplify gold uplegs by 2x to 3x, and the mid-tier miners of GDXJ usually do much better. As gold rallies on renewed investment demand as stock markets weaken, better mid-tier gold stocks soar dramatically multiplying investors’ wealth. This is a must-own sector.
While investors continue to harbor serious apathy for gold stocks, the mid-tier miners’ costs remain well-positioned to fuel monster profits growth in a higher-gold-price environment. This is a stark contrast to the rest of the markets, where rising earnings are looking to be scarce. Investors love higher profits, and few if any sectors will rival the gold miners’ earnings growth. It was already underway in Q1 on higher production.
In terms of hard accounting numbers, the GDXJ top 34’s total sales grew 5.0% YoY to $4.9b in Q1’19. That was the result of 15.6%-higher gold output easily offsetting the 1.9%-lower average gold price last quarter. Again the mid-tiers just trounced the majors, with the GDX top 34’s sales dropping a sharp 5.2% YoY when adjusted for the in-progress mega-merger between elite gold majors Newmont and Goldcorp.
The higher sales among the top 34 GDXJ stocks also drove impressive 22.2% YoY GAAP profits growth to a total of $197m in Q1! That again reveals the rising-cost problems are isolated in a handful of GDXJ components, not mid-tier miners as a whole. The majors of GDX again fared much worse last quarter, seeing earnings fall 7.2% YoY when accounting for that mega-merger. Mid-tiers are really outperforming.
The one blemish on the accounting front was operating cash flows generated, which fell 17.7% YoY in total among the GDXJ-top-34-component stocks to $1.1b. There were no individual-company disasters which stood out, just weaker cash flows across the board. Still the mid-tier miners were producing healthy amounts of cash as the big profits gap between their AISCs and prevailing gold prices last quarter implied.
The GDXJ top 34’s overall cash treasuries fell a similar 20.4% YoY in Q1 to $5.1b, reflecting lower OCFs. But less cash isn’t necessarily negative, as gold miners tap their cash hoards when they are building or buying expansions or mines. So declining cash balances suggest more investment to grow production in future quarters, which is always good news in this sector. The mid-tier golds’ Q1’19 results were bullish.
GDXJ’s mostly-mid-tier component list of great gold miners is really faring well, especially compared to the struggling large gold miners. Investors looking to ride this gold-stock bull should avoid the world’s biggest gold producers and instead deploy their capital in the mid-tier realm. The best gains will be won in individual smaller gold miners with superior fundamentals, plenty of which are included within GDXJ.
Despite being the world’s leading gold-stock ETF, GDX needs to be avoided. The major gold miners that dominate its weightings are struggling too much fundamentally, unable to grow their production. Capital will instead flow into the mid-tiers, juniors, and maybe a few smaller majors still able to boost their output and thus earnings going forward. None of this is new, but the major and mid-tier disconnect continues to worsen.
Again back in essentially the first half of 2016, GDXJ skyrocketed 202.5% higher on a 29.9% gold upleg in roughly the same span! While GDX somewhat kept pace then at +151.2%, it is lagging GDXJ more and more as its weightings are more concentrated in stagnant gold mega-miners. The recent big mergers are going to worsen that investor-hostile trend. Investors should buy better individual gold stocks, or GDXJ.
One of my core missions at Zeal is relentlessly studying the gold-stock world to uncover the stocks with superior fundamentals and upside potential. The trading books in both our popular weekly and monthly newsletters are currently full of these better gold and silver miners. Mostly added in recent months as gold stocks recovered from deep lows, their prices remain relatively low with big upside potential as gold rallies!
If you want to multiply your capital in the markets, you have to stay informed. Our newsletters are a great way, easy to read and affordable. They draw on my vast experience, knowledge, wisdom, and ongoing research to explain what’s going on in the markets, why, and how to trade them with specific stocks. As of Q1 we’ve recommended and realized 1089 newsletter stock trades since 2001, averaging annualized realized gains of +15.8%! That’s nearly double the long-term stock-market average. Subscribe today for just $12 per issue!
The bottom line is the mid-tier gold miners are thriving fundamentally. They are still rapidly growing their production while majors suffer chronic output declines. Most mid-tiers are holding the line on costs, which portends strong leveraged profits growth as gold continues grinding higher on balance. The performance gap between the smaller mid-tier and junior gold miners and larger major ones is big and still mounting.
Investors and speculators really need to pay attention to this intra-sector disconnect. Gold and its miners’ stocks should power far higher in coming years as the lofty general stock markets roll over. But the vast majority of the gains will be concentrated in growing gold miners, not shrinking ones. This means the mid-tier and junior gold miners will far outperform the majors as gold powers higher on weaker stock markets.
Adam Hamilton, CPA
May 27, 2019
Copyright 2000 – 2019 Zeal LLC (www.ZealLLC.com)
1. “Buy in July to watch your gold stocks fly!” That’s a time-tested mantra from “Goldlion”, who picks the junior mining stocks for my Graceland Juniors newsletter.
2. Sadly, this is not July. It’s the month of May, and May is part of the soft demand season for gold. The strong demand season typically runs from August to February.
3. A lot of gold stock investors want gold stocks to roar higher now, but nothing happens before its time. Interestingly, gold’s strong season begins just as stock market crash season begins.
4. Crash season for the US stock market typically runs from August to October. As the business cycle matures, stock market crash season becomes more dangerous and the strong demand season for gold offers more potential reward.
5. Please click here now. Double-click to enlarge. The soft price action is seasonally expected and there’s short term technical weakness, but there’s nothing overly negative, let alone bearish, on this daily gold chart.
6. Please click here now. Double-click to enlarge this magnificent weekly gold chart. Like Ray Dalio, I’ve suggested the next crisis will be a US dollar crisis more than an economic growth crisis.
7. That’s mainly because Trump administration is pro-growth and pro-business, but it’s also continued to grow both the government debt and the overall size of the government, all in the name of “making citizens great”.
8. This approach to running the government has greatly strengthened the private sector economy while greatly weakening the ability of the government to fund its insane debt and size growth in even a mild economic downturn.
9. In the next downturn, I expect the American private sector to weather the storm reasonably well while the government is forced to print money to fund itself. The bottom line:
10. In the last downturn, QE was used to promote growth and it was deflationary. In the next downturn, QE will be used to make up for lacklustre demand for government bonds, and it will be extremely inflationary.
11. Please click here now. Like America’s Warren Buffett, India’s Rakesh “RJ” Jhunjhunwala likes to heap praise on his government leaders instead of calling them out as extortionists and bullies.
12. Having said that, RJ has the same outlook for the private sector of India that I do in the medium and long-term; a move back towards 8%-9% GDP growth, and then a long-term stay in the double-digits range.
13. This gargantuan growth will increase gold demand quite substantially, and it’s likely to happen as the US government begins devaluing the dollar to manage its outrageous spending and debt. That will trigger fresh fear trade buying in America.
14. Please click here now. Double-click to enlarge this spectacular bitcoin chart. I expect a flag pattern will form, and then bitcoin should roar to the $20,000 area highs.
15. Most investors try to make money by buying what is hot, and they tend to get emotional about it. Bitcoin is not hot. It’s warm.
16. I focus on asset classes more than market timing, although I do that too. Investors build the most wealth, and stay sane doing it, by reducing their focus on what is hot, and instead focusing on making sure they own a piece of the asset class action.
17. The US stock market is part of the global stock markets asset class. So are Chindian stock markets. So, I own some US, Indian, and Chinese stock markets asset class action and I recommend that all investors own some too. It’s that simple.
18. Bitcoin and related crypto currencies are the newest asset class. There’s a lot of silly debate about whether gold is better than bitcoin, or vice-versa. I take the stand that it doesn’t matter which is better. What matters is that both are asset classes and investors need to get involved if they want to get richer. Period.
19. Some analysts claim that bitcoin is already more widely used as a payment mechanism than Paypal. That may or may not be true. Regardless, in time I think crypto will become as widely used as most government fiat, and governments will eagerly tax it with an electronic money transaction tax.
20. My prediction is that bitcoin isn’t going away but governments will ultimately make the most money from it. Investors who want to make money with it, albeit less than the government “people helpers” will make, can check out my crypto/blockchain newsletter at www.gublockchain.com.
21. Please click here now. Double-click to enlarge. I’ll make another prediction, which is that in the current pullback, gold stocks will bottom before bullion does.
22. So far in this month of May, GDX is already showing solid strength relative to gold.
23. Note the dramatic decline in volume from February. Declining volume that accompanies a price decline is a sign of a very healthy market.
24. My Graceland “traffic lights” proprietary technical system indicates that a Friday close over $23 would see a lot of gold stocks begin a major rally. I’ll be watching gold stocks closely for signs of a bullish non-confirmation with bullion… to jump-start that rally!
Special Offer For Website Readers: Please send me an Email to freereports4@gracelandupdates.com and I’ll send you my free “Golden Mid Caps!” report. I highlight gold producers that are not too big and not too small that are trading in the $2 to $10 price range with significant upside price action possible!
Thanks!!
Stewart Thomson
Graceland Updates
https://gracelandjuniors.com
www.guswinger.com
Email:
stewart@gracelandupdates.com
stewart@gracelandjuniors.com
stewart@guswinger.com
Stewart Thomson is a retired Merrill Lynch broker. Stewart writes the Graceland Updates daily between 4am-7am. They are sent out around 8am-9am. The newsletter is attractively priced and the format is a unique numbered point form. Giving clarity of each point and saving valuable reading time.
Risks, Disclaimers, Legal
Stewart Thomson is no longer an investment advisor. The information provided by Stewart and Graceland Updates is for general information purposes only. Before taking any action on any investment, it is imperative that you consult with multiple properly licensed, experienced and qualified investment advisors and get numerous opinions before taking any action. Your minimum risk on any investment in the world is: 100% loss of all your money. You may be taking or preparing to take leveraged positions in investments and not know it, exposing yourself to unlimited risks. This is highly concerning if you are an investor in any derivatives products. There is an approx $700 trillion OTC Derivatives Iceberg with a tiny portion written off officially. The bottom line:
Are You Prepared?
Gold has failed to gain traction over the past couple months, normally a seasonally-strong time. That has really weighed on sentiment, leaving traders increasingly bearish. Gold investment demand has flagged dramatically with lofty stock markets spewing great euphoria. That’s given gold-futures speculators the run of the market, where they have sold aggressively including extreme shorting. But that’s actually very bullish.
Gold price action is driven by the collective trading of both investors and speculators. The former control vast amounts of capital, which dominates gold prices when it is migrating in or out. But investors’ interest in gold withers when stock markets are super-high. When stocks seemingly do nothing but rally, there’s no perceived need to prudently diversify stock-heavy portfolios with counter-moving gold. It falls out of favor.
Extreme stock-market euphoria is gold’s primary problem now, acting like kryptonite for gold investment. This week the flagship US S&P 500 broad-market stock index clawed back to a new all-time record high. That extended its monster rebound rally since late December’s near-bear lows to 24.8%! The farther the stock markets advance, the more gold is forgotten. Investors have relentlessly pulled capital back out of gold.
The best proxy for gold investment demand is the physical gold-bullion holdings of the world’s dominant gold exchange-traded fund, the American GLD SPDR Gold Shares. In early October soon after the S&P 500 peaked but before it started plunging in its severe 19.8% correction, GLD’s holdings slumped to a deep 2.6-year low of 730.2 metric tons. I explained these stock-market and GLD dynamics in depth last week.
Then the very day the stock markets first dropped hard, investors remembered gold. Over the next 3.8 months into late January, GLD’s holdings surged 12.8% to 823.9t on heavy capital inflows from American stock investors. That helped push gold 8.9% higher in that span. But as euphoria came roaring back as the S&P 500 rebounded sharply from its deep selloff, gold’s relative luster again faded in investors’ eyes.
Between late January and this week, they’ve dumped GLD shares much faster than gold itself was being sold. That has forced GLD’s holdings 9.2% lower in the last 2.8 months to 747.9t, helping push gold’s price down 2.7%. Over 4/5ths of gold’s stock-market-correction-driven investment surge has now been erased, leaving GLD’s holdings just 2.4% above their secular lows of early October before stocks plunged!
The gold-investment selling via GLD in recent months has been relentless, especially in February and now April. During February’s 19 trading days, 13 saw GLD draws averaging 0.4%. And as of the middle of this week, April’s 17 trading days so far have seen 12 GLD-draw days also averaging 0.4%. Gold has faced unyielding selling pressure from American stock investors as the S&P 500 levitated ever higher.
There’s an old proverb stating “when the cat’s away, the mice will play”. That concept perfectly applies to the gold market. When investors are away, the gold-futures speculators will play. Investors’ capital just dwarfs speculators’, so when gold investment demand is robust spec trading is drowned out and usually irrelevant. But when investors aren’t interested, the gold-price impact of gold-futures trading is magnified.
These traders already punch far above their weights, their capital being far more potent than investors’ on a dollar-for-dollar basis. Gold futures allow extreme leverage far beyond anything legal in the stock markets. Each gold-futures contract controls 100 troy ounces of gold, which is worth $127,500 at $1275. But gold-futures speculators are only required to keep $3,400 cash in their accounts for each gold-futures contract.
That gives them absurd maximum leverage up to 37.5x, compared to the decades-old 2.0x limit in stock markets! At 30x leverage, every dollar deployed in gold futures has literally 30x the price impact on gold as another dollar used to buy gold outright. Just $1 of gold-futures capital flows yield the same gold-price result as $30 of investment capital flows. Gold-futures trading’s impact on gold is wildly disproportionate.
Further amplifying gold-futures speculators’ outsized influence, the American gold-futures price is gold’s global reference one. So when heavy gold-futures selling blasts that headline price lower, the resulting negative psychology quickly infects the rest of the world gold markets. Gold-futures trading is effectively the tail that wags the gold-investment dog. This vexing problem shouldn’t be allowed to exist, but it does.
Over the past couple months as mounting stock-market euphoria seduced investment capital out of gold, speculators’ gold-futures selling has soared to extremes at times. That really exacerbated the counter-seasonal downside pressure on gold prices. This heavy selling is evident in the weekly Commitments of Traders reports from the CFTC, which detail speculators’ collective long and short positions in gold futures.
This chart superimposes several years of daily gold prices in blue over the weekly CoT data. Total spec long contracts are shown in greed, and total shorts in red. The falling longs and rising shorts since gold last peaked near $1341 in mid-February are a big reason for its recent weakness. But the lower specs push their longs and the higher they ramp their shorts, the more bullish gold’s near-term outlook grows.
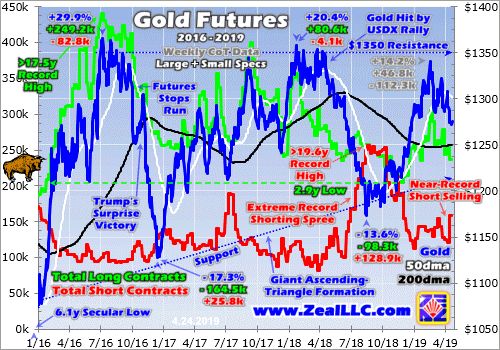
A couple weeks ago I dug deeper into gold futures’ impact on gold prices in recent years, so I’m going to focus on recent months here. On February 19th when gold surged to $1341, total spec longs and shorts were running 305.0k and 138.5k contracts. While those longs remained way below recent years’ peaks, they were still near the highest levels seen in the past year. I developed a simple metric to quantify that.
This chart shows the general rule on gold-futures trading driving gold price action. When speculators are buying by either adding new longs or covering existing shorts, gold rallies. When they are selling existing longs or adding new shorts, gold retreats. So the lower spec longs, and the higher spec shorts, the more bullish gold’s near-term outlook. The opposite is also true, higher longs and lower shorts are bearish for gold.
Gold’s biggest uplegs in recent years emerged from relatively-low spec longs and/or relatively-high spec shorts. Figuring out how low or high both sides of this trade happen to be can be done by looking at current levels compared to their trading ranges over the past year. When gold peaked at $1341 9 weeks ago, total spec longs were running 96% up into their 52-week trading range. That was certainly relatively high.
That left speculators little room to buy more gold-futures long contracts unless they expanded their total capital allocation back to bigger prior-year levels. If they didn’t, they had a lot more room to sell than to buy. That same CoT week, total spec shorts were running 32% up into their own past-year trading range. Thus the short-side guys had probable remaining room to cover 1/3rd of their shorts, which was relatively low.
If investors had been buying gold, if the mounting stock euphoria hadn’t been sucking capital out of gold, speculators’ gold-futures positioning wouldn’t have mattered much. But with investors missing in action, the gold-futures traders were ruling the roost. And they started selling heavily in the CoT week ending on Tuesday March 5th. Be aware that CoT weeks always run from Tuesday closes to Tuesday closes.
Gold began that CoT week looking great, trading at $1328. But speculators started selling gold futures, pushing gold down towards $1300. That is a hugely-important psychological level for gold, which seems to attract gold-futures stop losses like gravity. So as $1300 neared and failed, gold-futures selling ramped up massively. That CoT week ended with specs dumping 34.0k long contracts while adding 11.9k short ones!
A 20k+ contract change in either spec longs or shorts in a single CoT week is the threshold where huge begins. 20k contracts control the equivalent of 62.2 metric tons of gold, way too much for normal markets to absorb in a single week. That big bout of spec gold-futures long selling that kicked off the last couple months’ gold slump was exceptional. At that point 1053 CoT weeks had passed since early 1999, a long span.
That CoT week’s spec long selling ranked as the 20th largest ever witnessed, a rare event. And in terms of speculators’ total gold-futures selling including both longs and shorts, it was the 11th largest on record! It’s important to realize that gold-futures selling of that magnitude is unusual, unsustainable, and self-limiting. The lower spec longs and the higher spec shorts, the less gold futures these traders have left to sell.
That extreme selling blitz puking out the equivalent of 142.6t of gold in a single CoT week would probably have been the end of it without the growing stock-market euphoria. Gold usually carves a major seasonal low in mid-March before powering higher in its spring rally. But with the S&P 500 levitating and investors still selling gold on balance, sentiment stayed fairly bearish so gold-futures specs had the run of the market.
Still gold defied the surging stock markets to rally like usual, climbing back to $1322 by March 25th. The gold-futures speculators were responsible, adding 20.4k new long contracts while covering 15.4k short ones in the CoT week ending a day later. That was the equivalent of 111.3t of gold buying. But over the next CoT week, that reversed into heavy selling. That again surrounded gold plunging back under $1300.
For decades now I’ve intensely studied and closely watched the markets in real-time. I get up at 5am and follow the data and news feeds until 4pm or later. Usually when gold or the stock markets make some big intraday move, it’s explainable by news or data. Neither gold’s 1.7% plunge on March 1st, nor its later 1.4% drop on March 28th, had any apparent catalysts! But both days saw gold break back below $1300.
Running extreme leverage up to 37.5x, gold-futures speculators can’t afford to be wrong for long. A mere 2.7% gold price move against their positions would wipe out 100% of their capital risked at such leverage! So these guys have to maintain an ultra-short-term price-dominated focus, and they have to run tight stop losses or risk quick ruin. Long-side gold-futures traders have long clustered stops near that key $1300 level.
So when gold falls back through $1300 from above, mechanical stop-loss orders start triggering resulting in forced long selling. That quickly pushes gold even lower, tripping more stops to fuel cascading selling. By the time the dust settled in that CoT week ending on April 2nd with gold battered back to $1291, total spec gold-futures longs had plummeted 35.3k contracts! They weren’t short selling then, as shorts fell 2.1k.
That massive long dump was again exceptional, ranking as the 18th largest ever witnessed out of 1057 CoT weeks since early 1999 at that point. Speculators can’t maintain such crazy selling rates for long, as just 7 weeks at that pace would drive their longs to zero which will never happen. For the second time in 4 CoT weeks, extreme spec gold-futures long selling hammered gold from well above $1300 to back below.
But gold soon started recovering even while investors mesmerized by stock euphoria exited. Gold again climbed up over $1300, hitting $1308 on April 10th. This metal really wants to power higher even with investment capital fleeing to chase the lofty stock markets. Yet once again extreme gold-futures selling erupted in the latest CoT week reported before this essay was published, which ended last Tuesday April 16th.
For the third time in 7 weeks, extreme gold-futures selling flared as gold passed back down below $1300. Once again there were no significant data or news catalysts around the world, gold-futures selling just snowballed to a stunning degree. That CoT week total spec longs dropped another 17.5k contracts, close to that 20k+ huge threshold. But total spec shorts exploded an utterly-astounding 36.9k contracts higher!
That single-CoT-week shorting was so crazy it ranked as the 2nd highest ever witnessed out of the 1059 CoT weeks since early 1999! The only bigger shorting week was back in mid-November 2015, soon after the Fed telegraphed its first rate hike of the recent cycle. Yet that record shorting would soon prove very bullish for gold, birthing a major bull market. Gold surged 29.9% higher in 6.7 months in the first half of 2016.
Considered together in that latest reported CoT week ending April 16th, speculators’ total long and short selling rocketed to 54.4k contracts! That is the 5th highest on record, incredibly extreme. The 1st and 4th weighed in at 70.4k and 56.7k, and both occurred in December 2017. That record gold-futures selling also proved very bullish, as gold soon surged sharply to challenge a major bull-market breakout above $1350.
Big gold-futures selling is always bullish for gold, because those bearish bets will soon be unwound with proportional buying. This current episode won’t prove an exception, especially with near-record shorting. While making bullish long-side gold-futures trades is voluntary, short covering is mandatory. Shorting is effectively borrowing gold futures that traders don’t own, those contracts have to be repurchased and paid back.
Between gold’s latest interim high in mid-February to this extreme latest-reported CoT week, total spec longs collapsed 68.5k contracts or 22.5%. That’s a lot in a short span, leaving longs running just 32% up into their past-year trading range. That means specs easily have room to do over 2/3rds of their likely near-term long buying, and much more if higher gold prices excite traders enough to bet at previous years’ scales.
And over the last 8 reported CoT weeks, total spec shorts rose 19.5k contracts. That left them 37% up into their own past-year trading range. That’s not high, but it still leaves a lot more shorts that have to be covered with offsetting buying as gold reverses higher again. Total spec selling since February 19th ran 88.0k contracts, the equivalent of 273.9t of gold. That’s helped force gold 4.8% lower from $1341 to $1276.
The bright side of all this gold-futures selling is it is inherently self-limiting and self-correcting. The more these traders sell, the less they have left to sell. And the higher the odds they will start buying in a big way to mean revert their recent bearish bets back to normal. One of these days some catalyst will arise that will spark major spec gold-futures buying. Gold will surge sharply for weeks as buying normalizes bets.
The biggest casualty of recent months’ extreme near-record gold-futures selling was the gold miners’ stocks, which amplify moves in gold. The major gold miners of the leading GDX VanEck Vectors Gold Miners ETF tend to leverage gold’s action by 2x to 3x. That has weighed on gold-stock prices and psychology since mid-February. GDX slumped while gold-futures speculators battered the gold price lower.
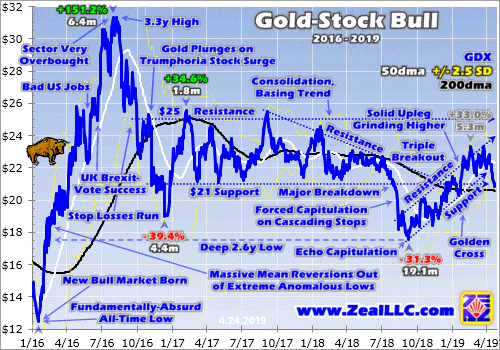
Despite that extreme gold-futures selling nearing records, and incredible stock-market euphoria stunting gold investment demand, the gold stocks have weathered this storm really well. GDX did knife back under its upleg’s support, nearing its 200-day moving average which is much-stronger support. But the major gold stocks have proven impressively resilient overall, largely consolidating high as gold swooned.
Again gold was pounded 4.8% lower over those 8 CoT weeks starting near $1341 and ending way down near $1276. At 2x to 3x normal leverage, the gold stocks would’ve plunged almost 10% to 15%. Yet over that exact span GDX merely slid 5.7%, just 1.2x gold’s loss! And GDX’s leverage was healthy before that as gold rallied, running 2.8x at best by mid-February. The gold stocks have really been holding their own.
Gold stocks are set to surge again once gold reverses decisively higher, which is increasingly likely any day now. These lofty euphoric stock markets are going to inevitably encounter some catalyst sparking significant selling, which will snowball after such a massive and long rally steeped in such epic complacency. Gold investment demand will turn on a dime as stock markets roll over, just like back in early October.
And when gold starts moving higher, the hyper-leveraged gold-futures speculators will rush to buy and pile on to its upside momentum. And after slashing their longs and ramping their shorts over the past couple months, they have major buying to do to reestablish bullish positioning relative to gold to ride its next rally. As leveraged gold-futures capital inflows force gold higher, gold stocks will really amplify its gains.
The last time major gold investment buying lined up with major gold-futures buying by the speculators was in roughly the first half of 2016. That catapulted gold 29.9% higher in 6.7 months kicking off this bull. The major gold stocks as measured by GDX soared 151.2% in essentially that same span, amplifying the big gold gains by 5.1x. Gold stocks are the place to be when traders are pouring capital back into gold!
One of my core missions at Zeal is relentlessly studying the gold-stock world to uncover the stocks with superior fundamentals and upside potential. The trading books in both our popular weekly and monthly newsletters are currently full of these better gold and silver miners. We’ve added plenty of new trades since mid-February as older ones were stopped out, which are ready to surge much higher as gold recovers.
To multiply your capital in the markets, you have to stay informed. Our newsletters are a great way, easy to read and affordable. They draw on my vast experience, knowledge, wisdom, and ongoing research to explain what’s going on in the markets, why, and how to trade them with specific stocks. As of Q1 we’ve recommended and realized 1089 newsletter stock trades since 2001, averaging annualized realized gains of +15.8%! That’s nearly double the long-term stock-market average. Subscribe today for just $12 per issue!
The bottom line is gold has been bludgeoned by extreme gold-futures selling in the past couple months, culminating in near-record shorting. That’s what forced gold lower during its usual spring-rally timeframe. With investors seduced by the lofty euphoric stock markets, gold-futures speculators have been running roughshod over gold prices. But their heavy selling is self-limiting, and will reverse into proportional buying.
Speculators’ big bearish shift in gold-futures positioning will have to be normalized, resulting in big buying that will push gold higher. That upside momentum could really grow, especially when stock markets roll over and again rekindle gold investment demand. The biggest gains as gold mean reverts back higher will come in the stocks of its miners. They’ve proven resilient as gold swooned, and are poised to surge again.
Adam Hamilton, CPA
April 30, 2019
Copyright 2000 – 2019 Zeal LLC (www.ZealLLC.com)
- The weak physical demand season continues to cause gold to drift with a clear but modest downside bias.
- Despite the swoon, most top bank analysts are extremely positive in their outlook for gold in the second half of the year.
- Please click here now. Standard Chartered analyst Suki Cooper notes a high correlation between the Fed’s actions now and in 2006. Gold does respond to a more dovish Fed, but not immediately.
- Suki also predicts U.S. GDP growth will be under 2.5% in 2019, fade to under 2% in 2020, and a downturn will begin in 2021.
- She expects the Fed to remain in pause mode and then announce a rate cut as growth and corporate profits continue to fade.
- The IMF predicts a similar fade in global growth generally, with the exception of China. India is also likely to see strong growth and that will likely be augmented with government handouts related to the election there.
- Essentially, the West will see fading growth. The Fed’s actions will be negative for the dollar and positive for the fear trade for gold. The East will see solid growth and that will be supportive for the love trade for gold.
- The big picture for gold in both the East and the West is positive.
- Please click here now. Double-click to enlarge this GDX chart.
- While the bank analysts are happy to wait out the weak season, I focus on swing trading with my guswinger.com trade alerts service. While many gold investors are a bit gloomy right now, we’ve been “riding the gravy train” with DUST-NYSE throughout most of the latest GDX downturn.
- Recent COT reports show the commercials doing aggressive buying of both gold and silver COMEX contracts. That’s positive but it doesn’t reduce account drawdowns for gold stock investors.
- Ultimately, winning trades are how to reduce drawdowns and commercial traders on the COMEX are currently covering enormous short positions at huge profits.
- Diversification plays a key role in successful investing. A modest allocation of capital to a solid swing trade program should be part of that diversification.
- To view the daily gold chart, please click here now. Double-click to enlarge.
- A potential bull wedge pattern is in play, but until there’s a bigger rally it’s not an actual textbook pattern.
- On a positive note, the blue lag line of my 14,7,7 Stochastics oscillator is almost oversold and “rallies with teeth” tend to occur when that happens.
- Chinese citizens are becoming more positive about their economy and gold demand is perking up. The Akha Teej festival in India is scheduled for May 7 and demand is picking up there too.
- The commercial trader buying on the COMEX could be related to this Chindian love trade but the intensity of the buying could also suggest that commercial traders are also anticipating the U.S. stock market could have a particularly nasty “Sell in May and go away”
- The S&P 500 index is near its highs and oil prices keep climbing. For now, oil is really in a sweet spot where it is high enough to help S&P500 earnings but not too high to hurt consumers.
- That could change quite dramatically, depending on how Iran responds to the U.S. government’s “My way or the highway” announcement to end sanctions waivers on Iranian oil exports.
- Good news for oil company earnings could quickly morph into “stagflationary concern” and this could be on the minds of the COMEX commercial traders who are buying gold and silver extremely aggressively now.
- American “Gmen” enforce these sanctions by threatening to cut nations off from the dollar-oriented US financial system unless they follow their orders. In the big picture, U.S. government “my way or the highwayism” related to Iran is simply going to accelerate the global wave of de-dollarization, which is good news for gold investors.
- Please click here now. Double-click to enlarge this GDX chart. The 50% retracement zone in the $20.50 area and the 60% retracement zone in the $20 area are where gold stock investors should look for a significant rally to begin.
- The bottom line is that physical market demand softness is likely to continue into the summer… but a big relief rally for the entire precious metals sector is imminent!
Special Offer For Website Readers: Please send me an Email to freereports4@gracelandupdates.com and I’ll send you my free “Golden Exceptions To The Rule!” report. I highlight key miners that are blasting higher even with the gold/silver price swoon and I include pinpoint buy and sell trigger points for each stock!
Thanks!!
Cheers
Stewart Thomson
Graceland Updates
Written between 4am-7am. 5-6 issues per week. Emailed at approx 9am daily.
Email:
Graceland Updates daily between 4am-7am. They are sent out around 8am-9am. The newsletter is attractively priced and the format is a unique numbered point form. Giving clarity of each point and saving valuable reading time.
Risks, Disclaimers, Legal
Stewart Thomson is no longer an investment advisor. The information provided by Stewart and Graceland Updates is for general information purposes only. Before taking any action on any investment, it is imperative that you consult with multiple properly licensed, experienced and qualified investment advisors and get numerous opinions before taking any action. Your minimum risk on any investment in the world is: 100% loss of all your money. You may be taking or preparing to take leveraged positions in investments and not know it, exposing yourself to unlimited risks. This is highly concerning if you are an investor in any derivatives products. There is an approx $700 trillion OTC Derivatives Iceberg with a tiny portion written off officially. The bottom line:
Are You Prepared?
- Please click here now. Double-click to enlarge this long-term gold chart. Fundamental and technical analysis are both strongly supporting gold’s rally towards the key $1400 area.
- Having said that, COMEX price action mainly reflects action in the physical market and this is the weak season for gold.
- Investors need patience. News in the West that “should” push gold $100/ounce higher is in play, but modest physical market demand in China and India means that rallies are modest.
- Please click here now. If this news was happening during the Chinese New Year Jan-Feb peak physical demand time frame, gold would be staging a “barn burner” rally.
- Instead, it’s contained in a $1280-$1350 consolidation range.
- Please click here now. Double-click to enlarge this daily gold chart.
- The bottom line: Gold is on a journey to the $1400-$1420 price zone, but it’s not a rocket ride. It’s more of what I call a “bull era plod”.
- The other fact to keep in mind is that the inversion of the US yield curve with artificially low rates isn’t suggesting that American economic growth is “cratering”.
- Growth is slowing down, but it’s too early to predict that a recession is imminent. A US-China trade deal could provide some medium-term support for stock markets without being negative for gold.
- Central bank gold accumulation is another positive factor, but it’s currently only about 50-60 tons a month. In the weak season Chindian demand often drops from 200+ tons a month to about 60-80.
- Central bank and Western fear trade demand is decent, but isn’t making up for the shortfall caused by the drop in Chindian demand. That’s being reflected in commercial trader action on the COMEX.
- Gold is rallying strongly from the $1280 zone because Chindian dealers are buyers there. They are fading their buying in the $1310-$1320 area, leaving Western money managers to do the heavy lifting. That’s no easy task with Chindia quiet.
- To put it simply, Western financial news is gold-supportive in content, but until Chindian buying resumes in size gold will be more of a trader’s market than the start of a “huge bull run”.
- The good news is that $1280-$1350 gold is a great price for the miners, and many are surging to one fresh high after another!
- Please click here now. Double-click to enlarge this fabulous GDX chart.
- I’ve suggested that a Friday close of $23 or higher for GDX and $14 for Barrick (GOLD-NYSE) would open the door to a much more significant rally for most gold and silver mining stocks.
- GDX closed above $23 yesterday and Barrick closed above $14. It’s not Friday yet, but this is a very positive sign!
- I don’t expect gold to move above $1350 until Chindian demand begins to strengthen in August… unless there’s a major economic shock in the West.
- Having said that, when it does rise to $1400-$1420, I expect a massive bull run to occur in the miners.
- The logic for this outlook is that most analysts have underestimated the profits that miners will make at $1400+, and global stock markets are likely to swoon again in the Aug-Oct crash season.
- In Sept 2018, gold was in the $1200 range. If it is in the $1400 area in Sept 2019 with stock markets swooning, institutional money managers could engage in a gold stock buying frenzy!
- A September rate cut from the Fed to calm the panic would likely enhance the frenzy.
- Please click here now. Double-click to enlarge this silver stock ETF chart.
- Note the recent rise of the key TRIX indicator above the zero line. That’s the sign of a technically healthy market. A sustained bull run for silver stocks would be signalled by a Friday SIL-NYSE close above $30!
Special Offer For Website Readers: Please send me an Email to freereports4@gracelandupdates.com and I’ll send you my free “Barrick & Agnico Lead The Juniors Higher!” report. I highlight money making tactics for Barrick, Agnico, and key juniors that are joining the upside fun!
Thanks!!
Cheers
Stewart Thomson
Email:
Graceland Updates daily between 4am-7am. They are sent out around 8am-9am. The newsletter is attractively priced and the format is a unique numbered point form. Giving clarity of each point and saving valuable reading time.
Risks, Disclaimers, Legal
Stewart Thomson is no longer an investment advisor. The information provided by Stewart and Graceland Updates is for general information purposes only. Before taking any action on any investment, it is imperative that you consult with multiple properly licensed, experienced and qualified investment advisors and get numerous opinions before taking any action. Your minimum risk on any investment in the world is: 100% loss of all your money. You may be taking or preparing to take leveraged positions in investments and not know it, exposing yourself to unlimited risks. This is highly concerning if you are an investor in any derivatives products. There is an approx $700 trillion OTC Derivatives Iceberg with a tiny portion written off officially. The bottom line:
Are You Prepared?
Since last spring we’ve written over and over again about a Fed rate cut being the catalyst for a bull move in gold stocks.
The history is almost bulletproof. Many lows in gold stocks over the past 60 years coincided with the end of rate hikes.
At present the Federal Reserve is in pause mode and the market is on the cusp of pricing in a rate cut. Friday, Fed funds futures showed a 56% chance of a rate cut by January 2020.
However, precious metals have yet to make new 52-week highs. The gold stocks (GDX & GDXJ) are much closer to doing so than the metals.
Simply waiting for the Fed to cut rates risks missing out on some upside. As market timers, we have to anticipate it.
Is there a leading indicator for the Fed moving from a pause to a cut?
Take a look at the chart below in which we plot data from the last two instances of new rate cut cycles: 2001 and 2007. The vertical lines highlight the Fed’s first cut in those two cycles.
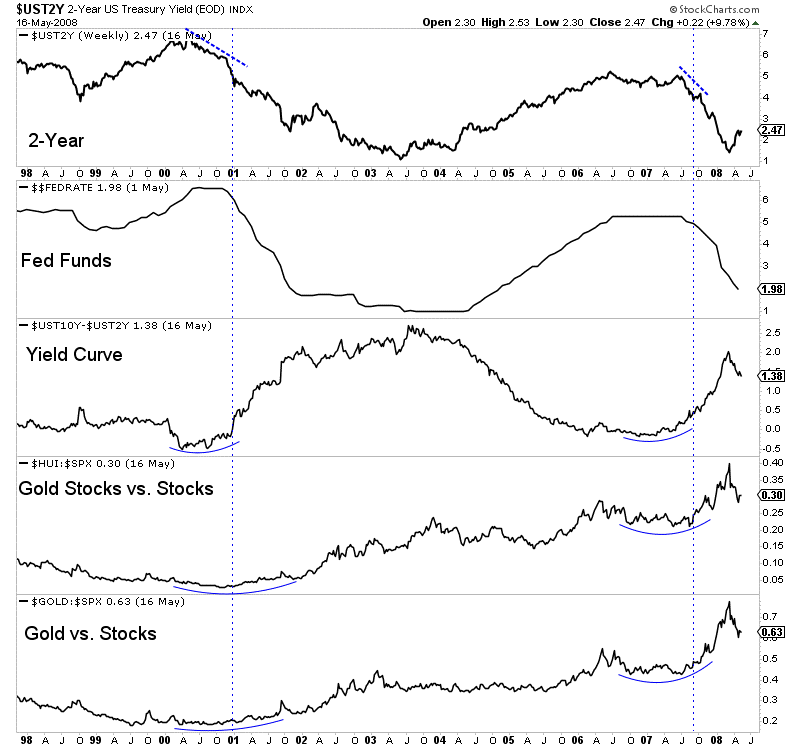
There are several observations to make.
First, Gold and gold stock relative performance accelerated after the rate hikes.
Second, the 10-year and 2-year yield spread began to steepen prior to that outperformance and prior to the rate cuts. And that’s because the 2-year yield, which is a proxy for the Fed funds rate, was trending lower in advance of the first cut.
In short, the sharp decline in the 2-year yield preceded the Fed moving from a pause to a cut. Prior to both the 2001 and 2007 cuts, the 2-year yield had declined by over 1%.
How does this compare to today?
The yield curve has yet to steepen and precious metals have not begun or confirmed outperformance against the stock market.
However, the positive sign for precious metals is the 2-year yield has already declined from nearly 3% down to 2.24% as we pen this.
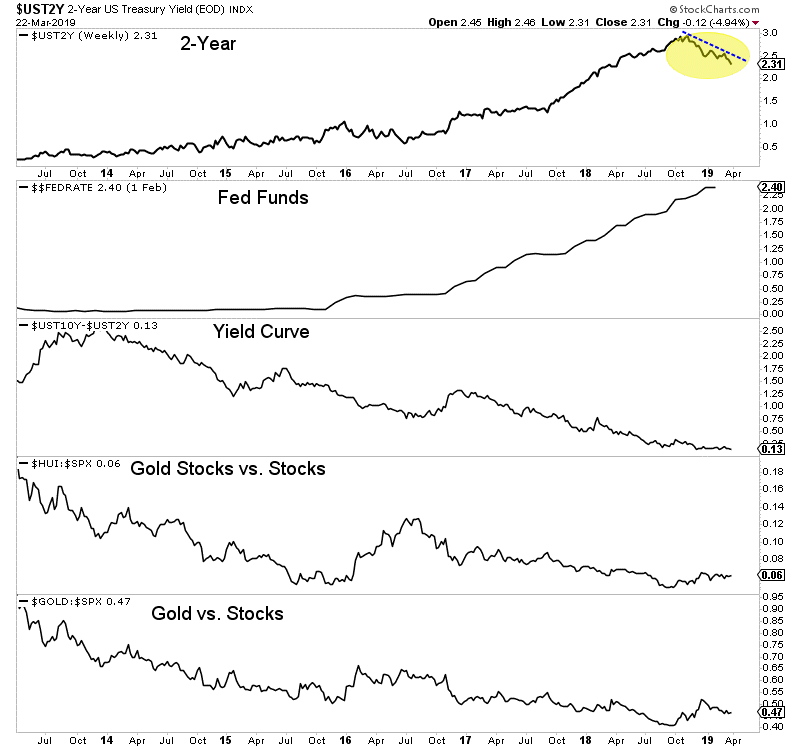
Every cycle is different and each has its own nuances but we cannot ignore the current decline in the 2-year yield. The closer it gets to 2.00%, the more the market will price in a rate cut.
With its decline to 2.24% today (Monday) the market has now priced in a 73% chance of a rate cut by January 2020. Not surprisingly, precious metals are trading higher.
If the 2-year yield continues to decline then precious metals (and gold stocks especially) should build more and more evidence that they are in a new bull market. To learn what stocks we are buying and think have 3x to 5x potential, consider learning more about our premium service.
Here are today’s videos and charts (double-click to enlarge):
SFS Key Charts, Signals, & Video Analysis
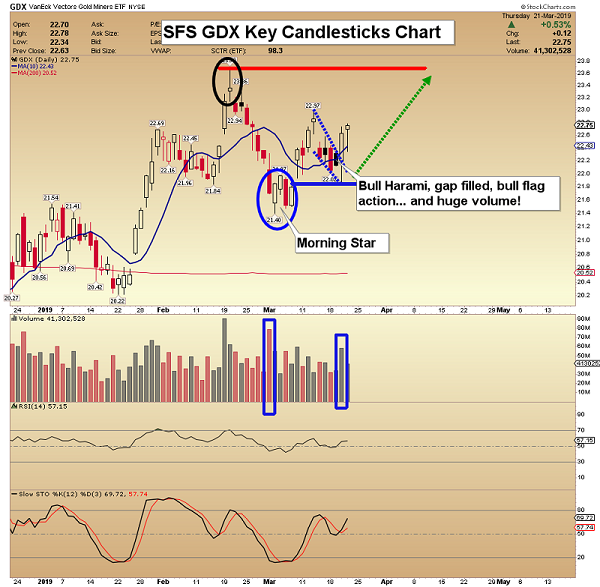
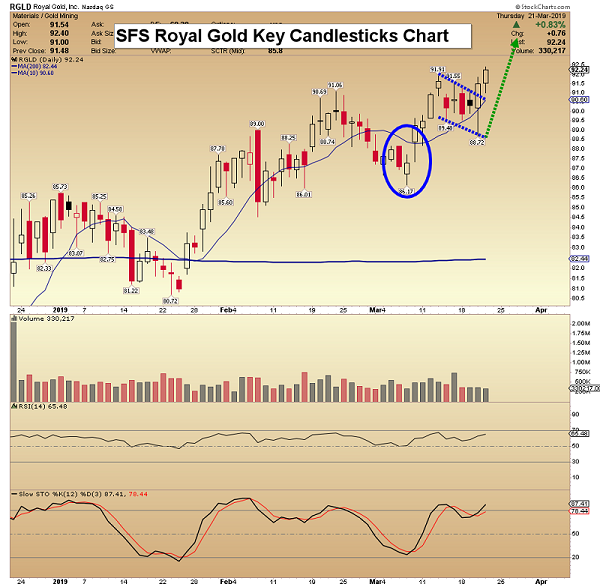
SF60 Key Charts, Signals, & Video Analysis
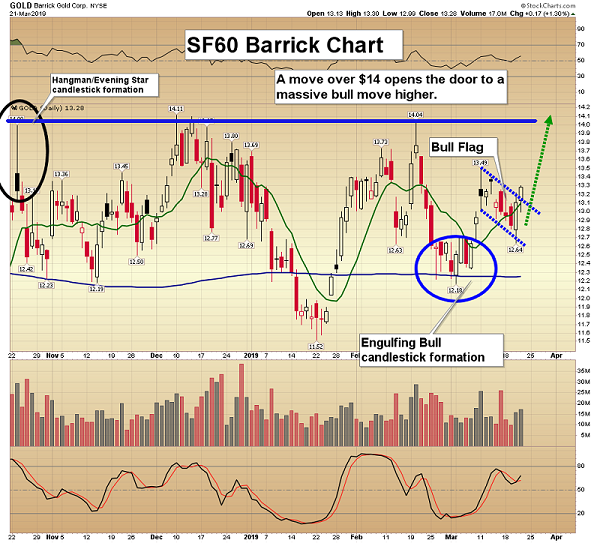
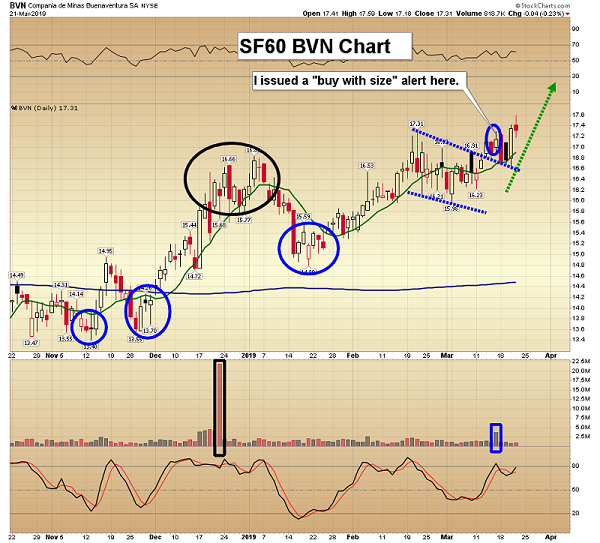
SF Trader Key Charts, Signals, & Video Analysis
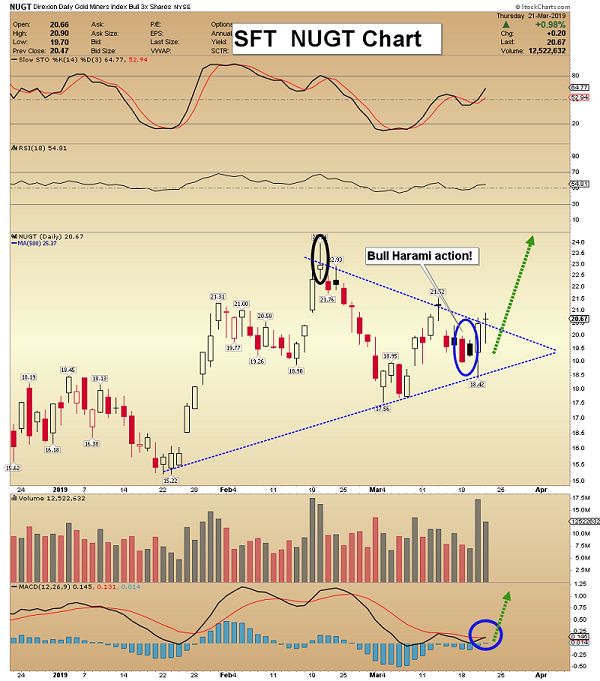
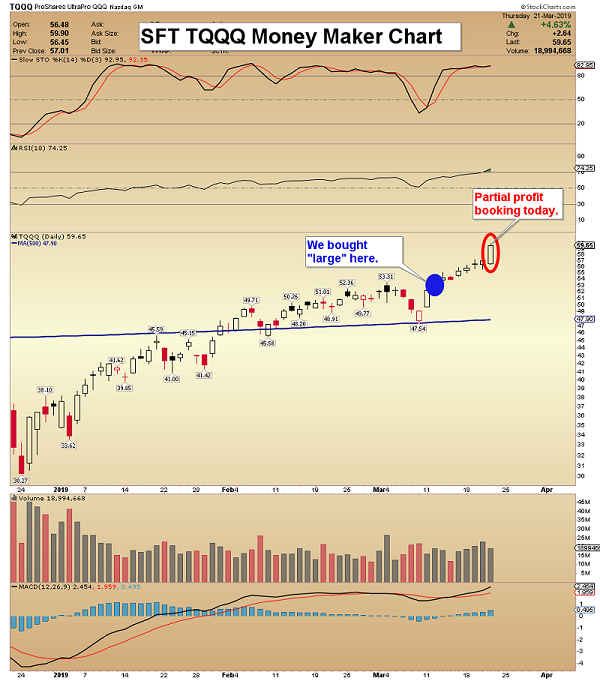
SFJ Key Charts, Signals, & Video Analysis
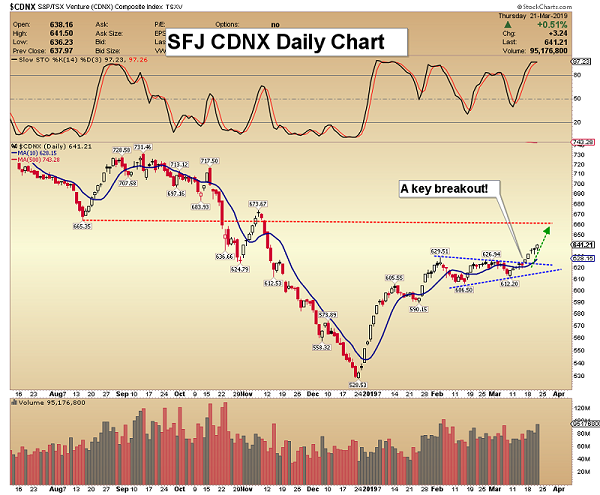
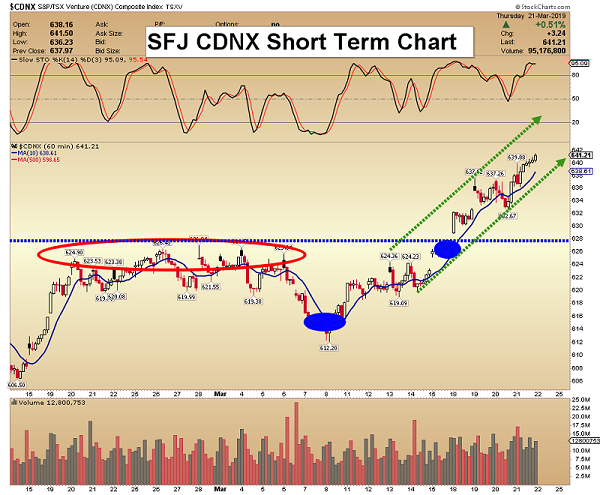
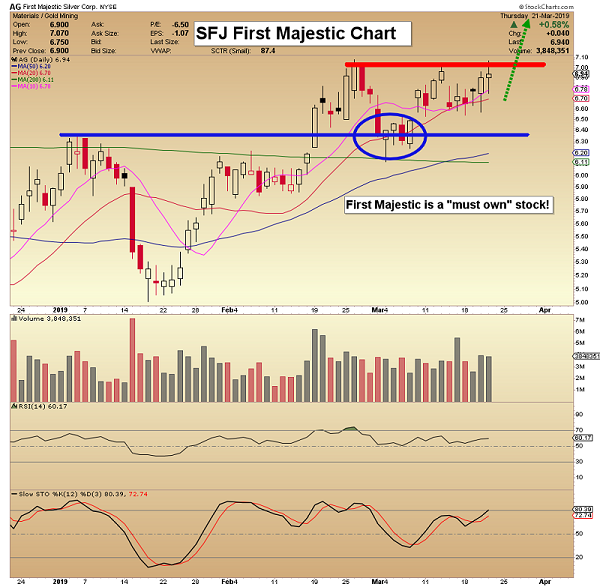
March 26, 2019
Morris Hubbartt
Unique Introduction For Website Readers: Send me an email to signals@superforcesignals.com and I’ll send you my free “Candlesticks Of Thunder!” junior gold stocks video report. I’ll also include 3 of my next Super Force Surge Signals free of charge, as I send them to paid subscribers. Thank you!
Stay alert for our Super Force alerts, sent by email to subscribers, for both the daily charts on Super Force Signals at www.superforcesignals.com and for the 60 minute charts at www.superforce60.com
About Super Force Signals:
Our Super Force signals are created thru our proprietary blend of the highest quality technical analysis and many years of successful business building. We are two business owners with excellent synergy. We understand risk and reward. Our subscribers are generally successful business owners, people like yourself with speculative funds, looking for serious management of your risk and reward in the market.
Frank Johnson: Executive Editor, Macro Risk Manager.
Morris Hubbartt: Chief Market Analyst, Trading Risk Specialist.
Email:
The mid-tier gold miners’ stocks have been rallying on balance in recent months, carving a solid young upleg. They’ve mostly finished reporting their latest fourth-quarter results, revealing how they are faring fundamentally. Their operating and financial performance is very important for investors, as the mid-tier realm is where most of the gold-stock sector’s gains accrue. They fared really well in a challenging quarter.
Four times a year publicly-traded companies release treasure troves of valuable information in the form of quarterly reports. Required by the U.S. Securities and Exchange Commission, these 10-Qs and 10-Ks contain the best fundamental data available to traders. They dispel all the sentiment distortions inevitably surrounding prevailing stock-price levels, revealing corporations’ underlying hard fundamental realities.
While 10-Qs with filing deadlines of 40 days after quarter-ends are required for normal quarters, 10-K annual reports are instead mandated after quarters ending fiscal years. Most gold miners logically run their accounting on calendar years, so they issue 10-Ks after Q4s. Since these annual reports are larger and must be audited by independent CPAs, their filing deadlines are extended to 60 days after quarter-ends.
The global nature of the gold-mining industry complicates efforts to gather this all-important fundamental data. Many mid-tier gold miners trade in Australia, South Africa, Canada, the United Kingdom, and other countries with quite-different reporting requirements. These include half-year reporting rather than quarterly, long 90-day filing deadlines after year-ends, and dissimilar presentations of operating and financial results.
The definitive list of mid-tier gold miners to analyze comes from the GDXJ VanEck Vectors Junior Gold Miners ETF. Despite its misleading name, GDXJ is largely dominated by mid-tier gold miners and not juniors. GDXJ is the world’s second-largest gold-stock ETF, with $4.1b of net assets this week. That is only behind its big-brother GDX VanEck Vectors Gold Miners ETF that includes the major gold miners.
Major gold miners are those that produce over 1m ounces of gold annually. The mid-tier gold miners are smaller, producing between 300k to 1m ounces each year. Below 300k is the junior realm. Translated into quarterly terms, majors mine 250k+ ounces, mid-tiers 75k to 250k, and juniors less than 75k. GDXJ was originally launched as a real junior-gold-stock ETF as its name implies, but it was forced to change its mission.
Gold stocks soared in price and popularity in the first half of 2016, ignited by a new bull market in gold. The metal itself awoke from deep secular lows and surged 29.9% higher in just 6.7 months. GDXJ and GDX skyrocketed 202.5% and 151.2% higher in roughly that same span, greatly leveraging gold’s gains. As capital flooded into GDXJ to own junior gold stocks, this ETF risked running afoul of Canadian securities laws.
Canada is the center of the junior-gold universe, where most juniors trade. Once any investor including an ETF buys up a 20%+ stake in a Canadian stock, it is legally deemed a takeover offer. This may have been relevant to a single corporate buyer amassing 20%+, but GDXJ’s legions of investors certainly weren’t trying to take over small gold miners. GDXJ diversified away from juniors to comply with that archaic rule.
Smaller juniors by market capitalization were abandoned entirely, cutting them off from the sizable flows of ETF capital. Larger juniors were kept, but with their weightings within GDXJ greatly demoted. Most of its ranks were filled with mid-tier gold miners, as well as a handful of smaller majors. That was frustrating, but ultimately beneficial. Mid-tier gold miners are in the sweet spot for stock-price-appreciation potential!
Major gold miners are increasingly struggling with declining production, they can’t find or buy enough new gold to offset their depletion. And the stock-price inertia from their large market capitalizations is hard to overcome. The mid-tiers can and are boosting their gold output, fueling big growth in operating cash flows and profitability. With much-lower market caps, capital inflows drive their stock prices higher much faster.
Every quarter I dive into the latest results from the top 34 GDXJ components. That’s simply an arbitrary number that fits neatly into the tables below, but a commanding sample. These companies represented 82.1% of GDXJ’s total weighting this week, even though it contained a whopping 71 stocks! 6 of the top 34 were majors mining 250k+ ounces, 17 mid-tiers at 75k to 250k, 8 “juniors” under 75k, and 3 explorers with zero.
These majors accounted for 19.8% of GDXJ’s total weighting, and really have no place in a “Junior Gold Miners ETF” when they could instead be exclusively in GDX. These mid-tiers weighed in at 44.3% of GDXJ. The “juniors” among the top 34 represented just 14.8% of GDXJ’s total. But only 4 of them at a mere 6.1% of GDXJ are true junior golds, meaning they derive over half their revenues from actually mining gold.
The rest are primary silver miners, gold-royalty companies, and gold streamers. GDXJ is overwhelmingly a mid-tier gold miners ETF, with sizable small-major exposure. Investors and speculators need to realize it is not a junior-gold investment vehicle as advertised. GDXJ also has major overlap with GDX. Fully 28 of these top 34 GDXJ gold miners are included in GDX too, with 23 of them also among GDX’s top 34 stocks.
The GDXJ top 34 accounting for 82.1% of its total weighting also represent 36.6% of GDX’s own total weighting! The GDXJ top 34 clustered between the 11th- to 40th-highest weightings in GDX. Thus over 4/5ths of GDXJ is made up by almost 3/8ths of GDX. But GDXJ is far superior, excluding the large gold majors struggling with production growth. GDXJ gives much-higher weightings to better mid-tier miners.
The average Q4’18 gold production among GDXJ’s top 34 was 164k ounces, just over half as big as the GDX top 34’s 302k average. Despite these two ETFs’ extensive common holdings, GDXJ is increasingly outperforming GDX. GDXJ holds many of the world’s best mid-tier gold miners with big upside potential as gold’s own bull gradually powers higher. Thus it is important to analyze GDXJ miners’ latest results.
So after every quarterly earnings season I wade through all available operational and financial results and dump key data into a big spreadsheet for analysis. Some highlights make it into these tables. Any blank fields mean a company hadn’t reported that data as of this Wednesday. The first couple columns show each GDXJ component’s symbol and weighting within this ETF as of this week. Not all are US symbols.
19 of the GDXJ top 34 primarily trade in the US, 5 in Australia, 8 in Canada, and 2 in the U.K. So some symbols are listings from companies’ main foreign stock exchanges. That’s followed by each gold miner’s Q4’18 production in ounces, which is mostly in pure-gold terms excluding byproducts often found in gold ore like silver and base metals. Then production’s absolute year-over-year change from Q4’17 is shown.
Next comes gold miners’ most-important fundamental data for investors, cash costs and all-in sustaining costs per ounce mined. The latter directly drives profitability which ultimately determines stock prices. These key costs are also followed by YoY changes. Last but not least the annual changes are shown in operating cash flows generated, hard GAAP earnings, revenues, and cash on hand with a couple exceptions.
Percentage changes aren’t relevant or meaningful if data shifted from positive to negative or vice versa, or if derived from two negative numbers. So in those cases I included raw underlying data rather than weird or misleading percentage changes. In cases where foreign GDXJ components only released half-year data, I used that and split it in half where appropriate. That offers a decent approximation of Q4’18 results.
Symbols highlighted in light blue newly climbed into the ranks of GDXJ’s top 34 over this past year. And symbols highlighted in yellow show the rare GDXJ-top-34 components that aren’t also in GDX. If both conditions are true blue-yellow checkerboarding is used. Finally production bold-faced in blue shows the handful of junior gold miners in GDXJ’s higher ranks, under 75k ounces quarterly with over half of sales from gold.
This whole dataset together compared with past quarters offers a fantastic high-level read on how mid-tier gold miners as an industry are faring fundamentally. While Q4’18 proved challenging with lower average gold prices, the GDXJ miners generally weathered it well. These elite mid-tier miners did much better last quarter than the major-dominated GDX elites. Their profits and stock prices are ready to soar with higher gold.
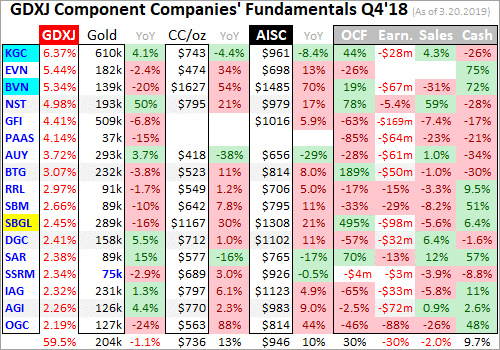
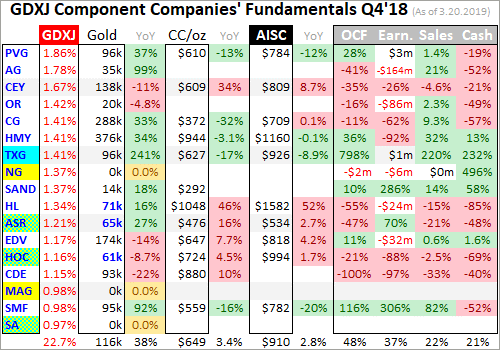
GDXJ’s managers have continued to fine-tune its ranks over this past year, making some good changes. For some inexplicable reason, one of the world’s largest gold miners AngloGold Ashanti was one of this ETF’s top holdings as discussed last quarter. AU was finally kicked out and replaced with a smaller major gold miner Kinross Gold and a mid-tier Buenaventura. Together they now account for 11.7% of GDXJ’s weighting.
Reshuffling at the top makes year-over-year changes less comparable, particularly given KGC’s larger size relative to most of the rest of the GDXJ top 34. Neither it nor BVN were included in GDXJ a year ago, and are new additions since Q3’18 results. Both are sizable GDX components, probably added to GDXJ to keep the weightings down in its smaller Canadian components. 4 other stocks climbed into the top 34.
Torex, Alacer, Hochschild, and Seabridge were already in GDXJ a year ago but weighted below the top 34. GDXJ is largely-but-not-entirely market-cap weighted, so it’s normal for components to rise into or fall out of the top 34 as their stock prices move higher or lower. All the following comparisons between Q4’18 and Q4’17 are across the two slightly-different GDXJ-top-34 sets, not the exact companies shown above.
Production has always been the lifeblood of the gold-mining industry. Gold miners have no control over prevailing gold prices, their product sells for whatever the markets offer. Thus growing production is the only manageable way to boost revenues, leading to amplified gains in operating cash flows and profits. Higher production generates more capital to invest in expanding existing mines and building or buying new ones.
Gold-stock investors have long prized production growth above everything else, as it is inexorably linked to company growth and thus stock-price-appreciation potential. The top 34 GDXJ gold miners excelled in that department, growing their aggregate output by a big 12.8% YoY to 5.1m ounces! That’s really impressive, trouncing both the major gold miners dominating GDX as well as the entire world’s gold-mining industry.
Last week I analyzed the GDX majors’ Q4’18 results, which revealed they are still struggling with serious challenges. The GDX top 34’s total production fell 3.9% YoY when adjusted for a mega-merger. That was worse than total global output slumping 0.9% YoY according to the World Gold Council. So GDXJ’s mostly-mid-tier gold miners really stand out. They are bucking the industry trend with strong production growth.
Again GDXJ’s top 34 components start at the 11th-highest weighting within GDX. Most of the production problems occurred above that threshold, in GDX’s top 10 components which include the world’s largest major gold miners. Their immense average production of 630k ounces in Q4’18 was nearly 4x the 164k average among GDXJ’s top 34! Those GDX top 10 also accounted for a dominant 59.1% of its total weighting.
GDXJ excluding these depleting giants and reallocating their heavy weightings across smaller majors and mid-tier gold miners makes all the difference. The big majors’ waning production and large market caps act as an anchor retarding GDX’s upside. GDXJ doesn’t share that burden, which helped its top 34 show such strong production growth. There’s no reason to own the large majors with their serious challenges.
Also interesting on the GDXJ production front last quarter was silver. This “Junior Gold Miners ETF” also includes major silver miners, both primary and byproduct ones. The GDXJ top 34’s silver mined rocketed 53.8% higher YoY to 31.2m ounces! For comparison the GDX top 34’s total reported output of 28.8m ounces actually slumped 1.5% YoY. The smaller GDXJ mid-tiers are way better than majors at growing their outputs.
The mid-tier gold miners continue to prove all-important production growth is doable off smaller bases. With a handful of mines or less to operate, mid-tiers can focus on expanding them or building a new mine to boost their output beyond depletion. But the majors are increasingly failing to do this with the super-high production bases they operate at. As long as the majors are struggling, it’s prudent to avoid them.
GDXJ investors would be better served if this ETF contained no major gold miners producing over 250k ounces a quarter on average. They still command nearly 1/5th of its weighting, which could be far better reallocated in mid-tiers and juniors. If VanEck kept the major gold miners in GDX where they should be, it could give GDXJ much-better upside potential. That would make this ETF more popular and successful.
In gold mining, production and costs are generally inversely related. Gold-mining costs are largely fixed quarter after quarter, with actual mining requiring about the same levels of infrastructure, equipment, and employees. So the higher production, the more ounces to spread mining’s big fixed costs across. Thus with sharply-higher YoY production in Q4’18, the GDXJ top 34 should’ve seen proportionally-lower costs.
There are two major ways to measure gold-mining costs, classic cash costs per ounce and the superior all-in sustaining costs per ounce. Both are useful metrics. Cash costs are the acid test of gold-miner survivability in lower-gold-price environments, revealing the worst-case gold levels necessary to keep the mines running. All-in sustaining costs show where gold needs to trade to maintain current mining tempos indefinitely.
Cash costs naturally encompass all cash expenses necessary to produce each ounce of gold, including all direct production costs, mine-level administration, smelting, refining, transport, regulatory, royalty, and tax expenses. In Q4’18 these top-34-GDXJ-component gold miners that reported cash costs averaged $698 per ounce. That was up a sharp 10.8% YoY, and considerably worse than the GDX top 34’s $655 average.
Those were the highest GDXJ cash costs seen since at least Q2’16, when I started this research thread. But even $698 is far lower than prevailing gold prices, showing the mid-tier gold miners face no existential threat. And GDXJ’s high cash costs last quarter aren’t righteous anyway, as they were skewed higher by an extreme outlier. One of the new GDXJ companies Buenaventura reported crazy cash costs of $1627 per ounce!
Excluding that wild anomaly, the rest of the GDXJ top 34 averaged cash costs of $662 which was right in line with Q3’18’s $663. They’d be even lower without Sibanye-Stillwater, a troubled South-African major gold miner that saw cash costs soar 30.1% YoY to an ugly $1167. If that too is excluded the overall average falls to $642. So for the most part the mid-tier gold miners’ cash costs remain really low relative to gold.
Way more important than cash costs are the far-superior all-in sustaining costs. They were introduced by the World Gold Council in June 2013 to give investors a much-better understanding of what it really costs to maintain gold mines as ongoing concerns. AISCs include all direct cash costs, but then add on everything else that is necessary to maintain and replenish operations at current gold-production levels.
These additional expenses include exploration for new gold to mine to replace depleting deposits, mine-development and construction expenses, remediation, and mine reclamation. They also include the corporate-level administration expenses necessary to oversee gold mines. All-in sustaining costs are the most-important gold-mining cost metric by far for investors, revealing gold miners’ true operating profitability.
The GDXJ top 34 reporting AISCs averaged $932 per ounce in Q4’18, which was also up a sizable 7.1% YoY. That was also barely the highest seen since at least Q2’16, contradicting the big production growth these miners achieved. But once again this was heavily skewed by extreme outliers, including both BVN and SBGL. Hecla also reported a stunning 52.3% YoY surge in its gold AISCs to a nosebleed $1582 per ounce!
Both BVN and SBGL reported sharply-lower YoY production, helping explain their huge cost surges. HL’s is more temporary, as it expects 2019 gold AISCs to average a still-high-but-much-lower $1250. Without these abnormal situations, the rest of the GDXJ top 34 averaged excellent AISCs of just $863 per ounce. That would be down 0.8% YoY, and is close to the GDX majors’ $837 average also excluding BVN and HL.
Yet even at that skewed artificially-high $932 per ounce, the elite GDXJ gold miners have great potential to enjoy surging profits and hence stock prices. Gold was relatively weak last quarter, averaging $1228 which was 3.8% lower YoY. That implied the mid-tier gold miners as an industry were earning $296 per ounce. That’s still a 24% profit margin, proving Q4’18’s major GDXJ lows weren’t fundamentally righteous.
Gold is faring much better in this almost-over Q1’19, averaging $1303 which is up a big 6.1% quarter-on-quarter. Assuming GDXJ-top-34 AISCs are flat, these elite mid-tier gold miners are earning around $371 per ounce this quarter. That implies enormous 25.3% QoQ profits growth! We won’t know for sure until after Q1’s earnings season, near mid-May. But the mid-tiers’ fundamentals should’ve greatly improved.
Bigger profits driven by higher gold prices are sure to attract investors back to the still-beaten-down gold-stock sector in a big way. The gold miners will stand out even more with earnings growth expected to be scarce in the general stock markets this year. If gold continues marching higher on balance as it ought to, and GDXJ average AISCs retreat as BVN and HL get anomalous costs under control, GDXJ profits will soar.
The GDXJ top 34’s hard accounting results in Q4’18 were mixed, but way better than GDX on all fronts. These elite mid-tier gold miners reported total sales of $7.4b last quarter, up a strong 12.1% YoY. That is right in line with their 12.8% YoY total gold production growth. That huge 53.8% YoY surge in their silver output helped offset the 3.8% YoY decline in average gold prices. The mid-tier gold miners’ revenues are strong.
Compare that to the GDX top 34, which saw sales plunge 10.3% YoY in Q4 due to 3.9%-lower merger-adjusted gold output. Those strong GDXJ-top-34 revenues kept operating-cash-flow generation solid, totaling $2.2b which was down 9.2% YoY. That again crushed the majors in the GDX top 34, which saw OCFs plummet 30.4% YoY. The divergence between how mid-tiers and majors are faring these days is gaping.
The elite GDXJ mid-tier gold miners also invested in growing their production, so their collective total cash on hand slid 14.3% YoY to $5.9b. The GDX majors saw a similar 14.6% YoY decline in their cash, yet they certainly didn’t spend enough to offset their depleting mines. The only real blemish on the GDXJ top 34’s Q4 results came in hard GAAP profits. Their aggregate bottom line collapsed to a $732m loss last quarter!
That was far worse than Q4’17’s $26m loss. Much of this was due to big non-cash impairment charges, writedowns of the carrying value of gold mines and deposits due to lower gold prices and forecasts. If gold miners expect lower gold prices going forward, they have to flush the resulting expected economic losses through current-quarter results when those impairments are perceived. That hammered overall results.
Honestly the Q4’18 impairments seemed pretty unnecessary, with average gold prices merely down 3.8% YoY. 2018’s full-year average gold price actually rose 0.8% YoY. Major impairments usually happen in years gold plunges sharply, like 2013’s brutal 27.9% plummeting. Something like that really changes the economic assumptions underlying gold mines. But gold only slumped 1.6% last year, which is utterly trivial.
Some of the bigger impairment charges came from First Majestic Silver and Osisko Gold, which wrote off $168m and $166m. This primary silver miner and gold-royalty company aren’t even mid-tier gold miners. And the perpetually-troubled South African majors Gold Fields and Sibanye-Stillwater which have long tainted GDXJ reported big half-year losses implying $169m and $98m in Q4. These alone total $601m of losses.
That accounted for nearly 5/6ths of the GDXJ top 34’s total GAAP losses last quarter. While many of the elite mid-tier gold miners reported small losses, the great majority of the surge in losses came from a handful of stocks. Overall the GDXJ GAAP profits looked relatively decent compared to the majors. GDX’s top 34 reported a staggering $6.0b in accounting losses in Q4’18! The mid-tiers are thrashing the majors.
GDXJ’s mostly-mid-tier component list of great gold miners is really faring well, especially compared to the struggling large gold miners. Investors looking to ride this gold-stock bull should avoid the world’s biggest gold producers and instead deploy their capital in the mid-tier realm. The best gains will be won in individual smaller gold miners with superior fundamentals, plenty of which are included within GDXJ.
Despite being the world’s leading gold-stock ETF, GDX needs to be avoided. The major gold miners that dominate its weightings are struggling too much fundamentally, unable to grow their production. Capital will instead flow into the mid-tiers, juniors, and maybe a few smaller majors still able to boost their output and thus earnings going forward. None of this is new, but the major and mid-tier disconnect continues to worsen.
Again back in essentially the first half of 2016, GDXJ skyrocketed 202.5% higher on a 29.9% gold upleg in roughly the same span! While GDX somewhat kept pace then at +151.2%, it is lagging GDXJ more and more as its weightings are more concentrated in stagnant gold mega-miners. The recent big mergers are going to worsen that investor-hostile trend. Investors should buy better individual gold stocks, or GDXJ.
One of my core missions at Zeal is relentlessly studying the gold-stock world to uncover the stocks with superior fundamentals and upside potential. The trading books in both our popular weekly and monthly newsletters are currently full of these better gold and silver miners. Mostly added in recent months as gold stocks recovered from deep lows, our unrealized gains are already running as high as 74% this week!
If you want to multiply your capital in the markets, you have to stay informed. Our newsletters are a great way, easy to read and affordable. They draw on my vast experience, knowledge, wisdom, and ongoing research to explain what’s going on in the markets, why, and how to trade them with specific stocks. As of Q4 we’ve recommended and realized 1076 newsletter stock trades since 2001, averaging annualized realized gains of +16.1%! That’s nearly double the long-term stock-market average. Subscribe today for just $12 per issue!
The bottom line is the mid-tier gold miners are thriving fundamentally. They are still rapidly growing their production while majors suffer sharp output declines. The mid-tiers are holding the line on costs, which portends strong leveraged profits growth as gold continues grinding higher on balance. The performance gap between the smaller mid-tier and junior gold miners and larger major ones is big and still mounting.
Investors and speculators really need to pay attention to this intra-sector disconnect. Gold and its miners’ stocks should power far higher in coming years as the lofty general stock markets roll over. But the vast majority of the gains will be concentrated in growing gold miners, not shrinking ones. This means the mid-tier and junior gold miners will far outperform the majors. The smaller miners have superior fundamentals.
Adam Hamilton, CPA
March 25, 2019
Copyright 2000 – 2019 Zeal LLC (www.ZealLLC.com)
The battle for Cornerstone Capital Resources Inc. (TSXV-CGP, OTC-CTNXF) is heating up following a preliminary takeover bid from joint venture partner SolGold. However, Cornerstone is likely to reject the overture, based on its latest press release on the matter and on comments by Glen McKay, a co-founder and former president and CEO of the junior mining exploration company.
Cornerstone has a joint venture agreement with SolGold on the Cascabel project in Ecuador, which is believed to be one of the world’s largest gold-copper deposits. SolGold is the operator of the Cascabel project and owns a majority stake. Larger gold players are also involved, with both BHP Billiton and Newcrest Mining holding minority positions in SolGold.
In a February 8 press release, Cornerstone noted that SolGold had issued a press release of its own on January 31, announcing its intention to commence an offer to acquire all of the issued and outstanding common shares of Cornerstone in an all-stock transaction, providing 0.55 of a SolGold share for every one Cornerstone share tendered.
“As previously announced by Cornerstone, shareholders of the company that collectively own over 50% of the company’s outstanding shares have notified Cornerstone that they will not support the terms announced by SolGold,” the Cornerstone release stated. “As a result, if SolGold proceeds to make a formal offer on these terms, the company believes that SolGold’s offer would be incapable of being successfully completed.”
The Board of Directors of Cornerstone said it had assessed the SolGold proposal with its financial advisor and believes that the proposal significantly undervalues Cornerstone. The Cascabel Project is owned by SolGold’s 85% owned Ecuador subsidiary Exploraciones Novomining S.A. (ENSA). The remaining 15% of ENSA is currently held by Cornerstone. In addition, Cornerstone owns approximately 9.2% of the outstanding shares of SolGold. In effect, Cornerstone has a combined direct and indirect 23% interest in the Cascabel concession.
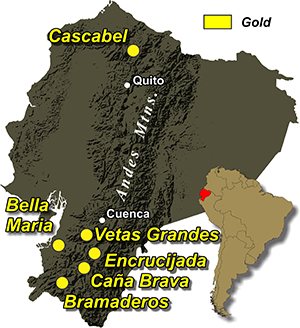
Cornerstone said it was disappointed by SolGold’s latest press release, stating that it contains “numerous inaccurate and misleading statements and baseless innuendo.” Still, Cornerstone said it remains open to constructively discussing with SolGold and other potential bidders any value enhancing transaction that would garner the support of Cornerstone’s shareholders.
In an interview, Cornerstone co-founder and former chief executive Glen McKay called the SolGold preliminary offer a poor bid, or an offer so far below the current value that under most circumstances it will be rejected. McKay is a major shareholder and a special advisor to Cornerstone. “I know that we can identify 60% of shareholders who have been surveyed and unanimously we are going to reject the offer, if SolGold comes with it,” McKay said. “They may still come with an offer, but it will be a waste of their money to do so and will be really embarrassing for SolGold.” An additional factor is that SolGold is mostly an illiquid stock so that even if Cornerstone accepted the deal there would be little chance of current CGP shareholders being able to monetize their new shares of SolGold in the short term.
The price SolGold is offering is not based on the fair value of the Cascabel project, McKay said. In addition, he says there are a number of issues with the joint venture agreement between SolGold and Cornerstone that have not been fulfilled.
This may not be an issue in the future, if BHP Billiton or Newcrest or some other suitor comes in with an offer for both companies and consolidates them. But for now, McKay says SolGold is not in a position of strength and the deal as it stands is “not going to happen.”
Stressing that he can’t predict the future, McKay nonetheless believes that another bid for Cornerstone will take place, perhaps as soon as this year. Although BHP Billiton has signed a deal which rules out a takeover bid until November, Newcrest Mining is under no such restriction.
Newcrest has signed two major joint venture agreements with Cornerstone in the last couple of months, McKay notes, including an agreement on the Cana Brava project in Ecuador and the Miocene property in Chile.
McKay sees the two deals as an indication that Newcrest is positioning itself for a bid so that they are in a good place in terms of their relationship with Cornerstone. “If I had to make a bet, I would say that Newcrest is the front runner and it may be that they will do it as a partnership,” he says. “I think something will happen before the end of 2019. We’re hoping that another interested player comes in and starts a bidding war.”
With consolidation on the rise in the metals sector, a SolGold-Cornerstone merger perhaps makes sense, although SolGold may have to sweeten its offer to cement the deal. But Cornerstone’s initial negative response suggests even that won’t be enough. For now, interested observers will have to be content to wait for another missive from SolGold to see if the offer changes or is simply shelved.
Whatever the outcome, McKay believes that Cornerstone will spin off its other assets before a sale of its interest in Cascabel due to the potential of other properties that are under other JVs such as the Bramaderos project in Ecuador. Malcolm Norris, the CEO of Cornerstone partner (Sunstone) on the project was the CEO of SolGold in 2012 when Cornerstone completed a JV deal on Cascabel. Norris and Cornerstone VP Exploration Yvan Crepeau are due the credit for the discovery of Cascabel, McKay says. They are hoping to replicate that success on Bramaderos.
- The biggest driver of major markets right now is the possibility of a U.S.-China trade deal.
- On that note, please click here now. The U.S. government’s wild launch of tariff taxes caused global markets to swoon in the first half of 2018. Gold and the Chinese stock market were hurt more than a lot of other markets.
- Gold has done well with QE, QT, falling rates, and rising rates, but tariff taxes hurt the Chinese economy. That put a damper on the growth of Chinese gold demand.
- The Chinese stock market is now rallying in anticipation of a trade deal, but even if there is no deal (unlikely), the Chinese government has embarked on a significant stimulus program.
- U.S. money managers are getting more interested in the Chinese stock market because of that stimulus. A trade deal that includes more intellectual property protection would create a huge U.S. stock market rally. More importantly, it would create a huge rally in the Chinese market and that would increase gold demand significantly.
- If the Fed hikes or signals that QT is going back to auto pilot mode, institutional money managers will buy gold because of growing concerns about the U.S. government’s ability to finance itself, and because the Fed’s move would hurt low interest rate loans for U.S. stock market buybacks. A situation like September 2018 would occur, with gold rallying and stock markets tanking.
- On the other hand, a pause in hikes and an earlier-than-expected end to QT is also viewed as good news for gold.
- Additionally, even without a trade deal, China’s economy is becoming consumer-oriented, and that means more imports and less exports. In turn, that means less need for the purchase of U.S. government debt.
- A trade deal would speed up this process.
- The U.S. government’s ability to finance itself without foreign government purchases of its bonds is becoming a significant concern for powerful money managers like Larry Fink of Blackrock.
- The bottom line: A trade deal is good for stock markets and gold, but it likely flips the U.S. government’s financial situation out of the fry pan… and into the fire!
- Clearly, the current global-macro situation is extremely positive for gold. What about the technical situation? For the answer to that question, please click here now. Double-click to enlarge this daily gold chart.
- It really doesn’t matter whether gold makes a beeline for my new $1400 target immediately, or whether there’s a “pitstop” in the $1300-$1280 support zone.
- It doesn’t matter because the big picture fundamentals and technicals are outrageously positive, so there’s no need for fear amongst investors.
- Please click here now. Double-click to enlarge. The higher-price implications of the technical action on this weekly gold chart are obvious. The $1000/ounce price zone is major support, $2000 is resistance, and $3000 is the target price!
- The world’s need for dollars is declining, for a multitude of reasons. Please click here now. Whether it’s caused by the simple but gargantuan growth of the Chinese and Indian economies, or the U.S. government’s “My way or the highway” approach to sanctioning Russia, bank and government entities around the world are steadily distancing themselves from the dollar.
- Gold is the best way for individuals, banks, and governments to do that. The buy programs of emerging central banks are only in their infancy, and the tonnage being bought is consistently rising.
- As somebody who aggressively bought the U.S. stock market right into the October 2008-March 2009 lows, I can assure the Western gold community that there is no event to fear in the current gold market. The market is rock-solid.
- The rise of the Eastern economies is a titanic force that is creating both de-dollarization and demand growth for gold. Citizens of the East view gold as the best investment asset from both a risk and reward perspective. Their view is now being adopted by more and more Western money managers. In time (and not much time), this positive view of gold will also be the view of the average American citizen. Gold bashers like Warren Buffett prospered in the fiat era, but that era is waning fast. A new bull era is being born and all roads lead to gold.
- Please click here now. Double-click to enlarge this interesting GDX chart. Merger-mania is underway in the gold and silver mining stocks and there’s “bull flag mania” on the daily GDX chart!
- Larger gold mining entities are required to service the global demand growth for gold. I’ve predicted that Chinese miners, banks, and industrial companies will ultimately be involved in mergers with Western mining companies.
- In the coming years, gold miners could become as important as the giant base metal miners.
- Please click here now. Double-click to enlarge. That’s another look at the GDX daily chart, with the support zones highlighted. Mining stock enthusiasts should be buyers of their favourite miners any time GDX trades at a support zone.
- Gold stock investors should understand that the current market is not like the early 2000s, 2007, or 2016. This is a market like the 1970s, and the upside fun… has only just begun!
Special Offer For Website Readers: Please send me an Email to freereports4@gracelandupdates.com and I’ll send you my free “Gold Stocks Merger Mania!” report. I highlight ten fabulous gold miners that are ripe to be taken over, with key buy and sell points for each stock! Email me today, and I’ll send it to you today!
Stewart Thomson
Graceland Updates
Email:
Stewart Thomson is a retired Merrill Lynch broker. Stewart writes the Graceland Updates daily between 4am-7am. They are sent out around 8am-9am. The newsletter is attractively priced and the format is a unique numbered point form. Giving clarity of each point and saving valuable reading time.
Risks, Disclaimers, Legal
Stewart Thomson is no longer an investment advisor. The information provided by Stewart and Graceland Updates is for general information purposes only. Before taking any action on any investment, it is imperative that you consult with multiple properly licensed, experienced and qualified investment advisors and get numerous opinions before taking any action. Your minimum risk on any investment in the world is: 100% loss of all your money. You may be taking or preparing to take leveraged positions in investments and not know it, exposing yourself to unlimited risks. This is highly concerning if you are an investor in any derivatives products. There is an approx $700 trillion OTC Derivatives Iceberg with a tiny portion written off officially. The bottom line:
Are You Prepared?
by Morris Hubbartt
February 5, 2019
Here are today’s videos and charts (double-click to enlarge):
SFS Key Charts, Signals, & Video Analysis
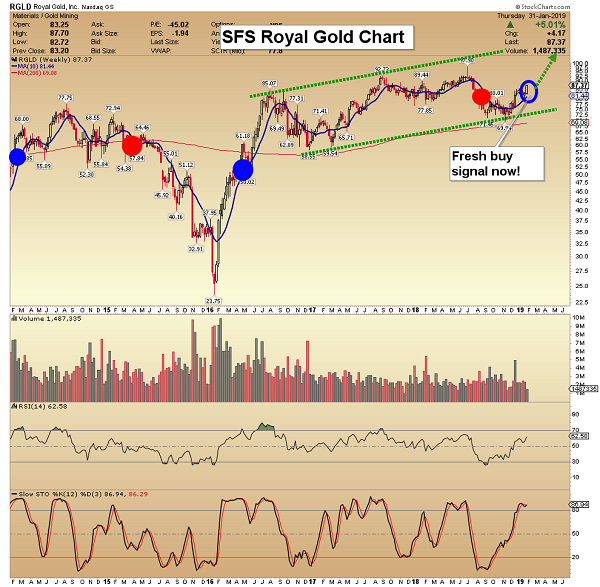
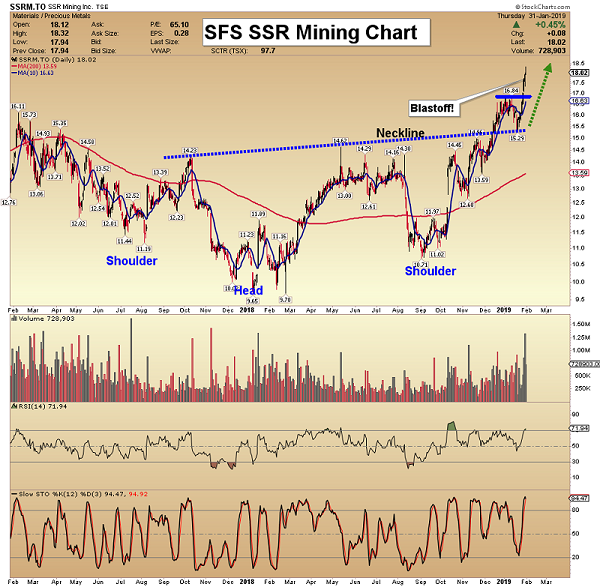

SF60 Key Charts, Signals, & Video Analysis

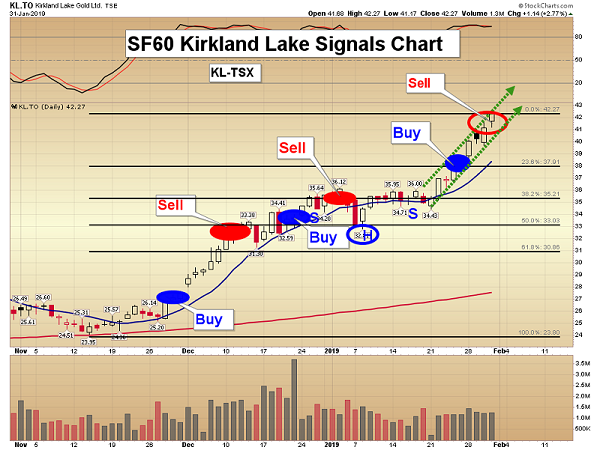
SF Trader Key Charts, Signals, & Video Analysis
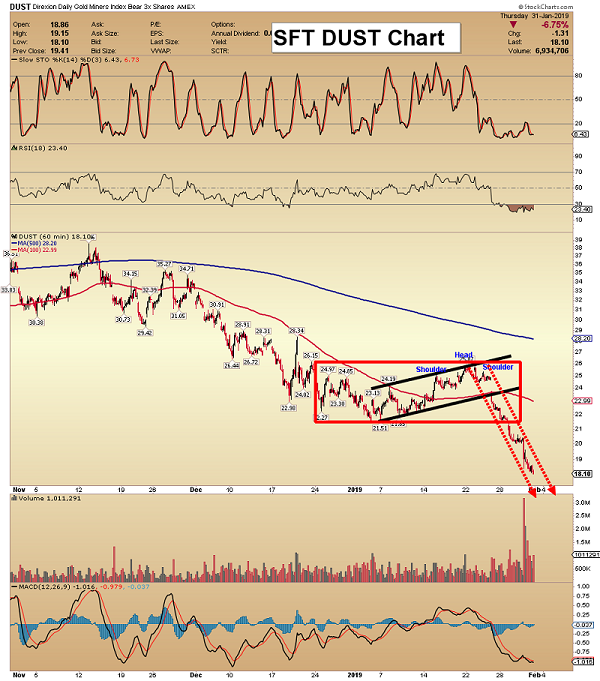
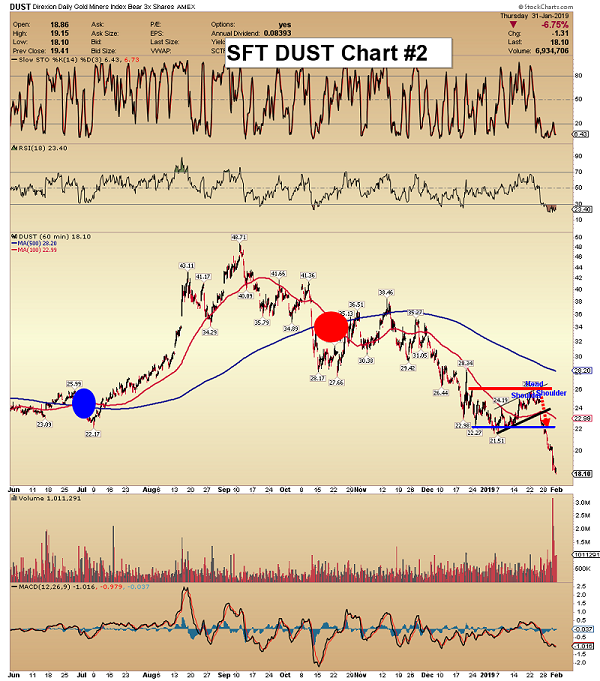
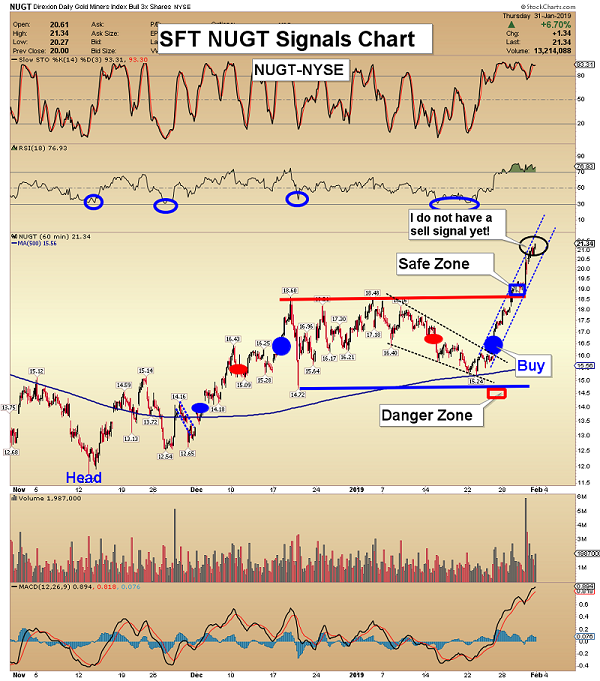
SFJ Key Charts, Signals, & Video Analysis
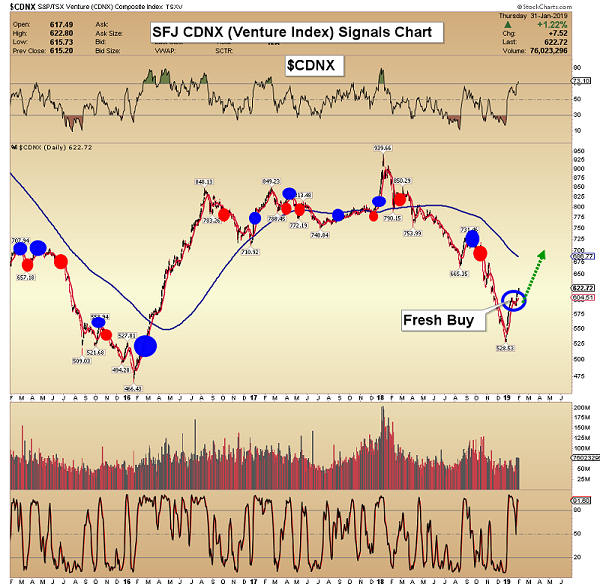
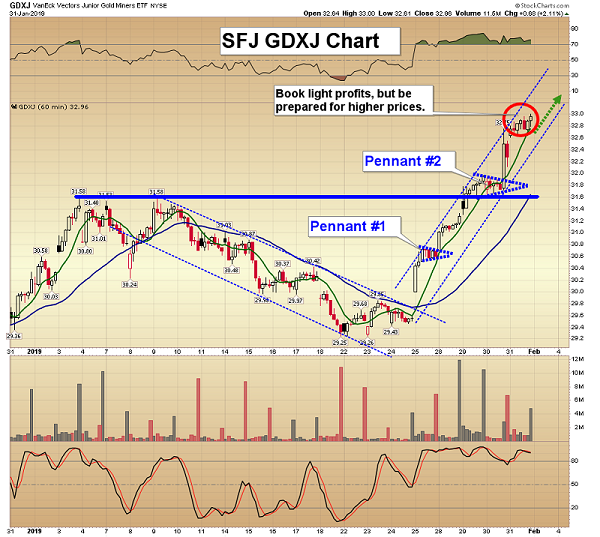
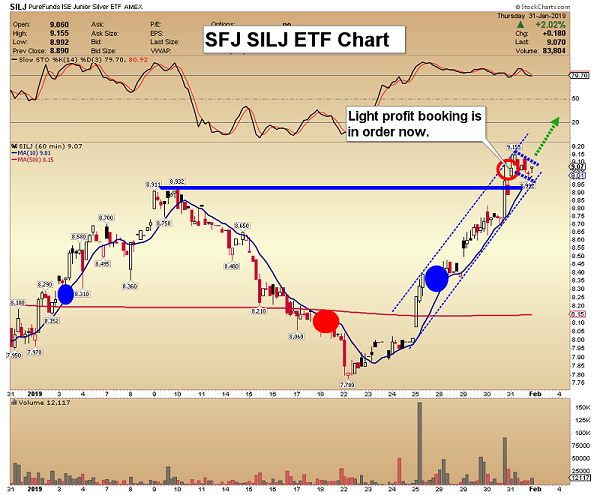
Thanks,
Morris Hubbartt
Unique Introduction For Website Readers: Send me an email to signals@superforcesignals.com and I’ll send you 3 of my next Super Force Surge Signals free of charge, as I send them to paid subscribers. I’ll also send you a video on three of the hottest junior gold stocks! Thank you!
Stay alert for our Super Force alerts, sent by email to subscribers, for both the daily charts on Super Force Signals at www.superforcesignals.com and for the 60 minute charts at www.superforce60.com
About Super Force Signals:
Our Super Force signals are created thru our proprietary blend of the highest quality technical analysis and many years of successful business building. We are two business owners with excellent synergy. We understand risk and reward. Our subscribers are generally successful business owners, people like yourself with speculative funds, looking for serious management of your risk and reward in the market.
Frank Johnson: Executive Editor, Macro Risk Manager.
Morris Hubbartt: Chief Market Analyst, Trading Risk Specialist.
Email:
- The magnificent gold price rally has paused in the $1300 area for the past few weeks. Monday was COMEX option expiry day.
- With that now out of the way, gold is already staging more upside action!
- Please click here now. Double-click to enlarge this daily gold chart. A bullish upside channel breakout is in play and the consolidation was a flag-like pattern.
- Also, note my key 14,7,7 series Stochastics oscillator at the bottom of the chart. A buy signal that occurs in the 40-60 area is a momentum-oriented signal, as opposed to a value-oriented signal that occurs in the 0-20 area.
- These are technical signs of a tremendously healthy market.
- Please click here now. Double-click to enlarge this spectacular long term gold chart.
- The technical excellence being showcased on the daily gold chart is typical during rallies from the final right shoulder low in this type of enormous inverse H&S bull continuation pattern.
- I’ve been almost alone amongst gold analysts in suggesting that the brief five-year decline from 2011-2016 was a typical “ho hum” correction in a bull market rather than a “vicious bear market”.
- There’s no question that junior gold stocks experienced a bear market then, but they have experienced a myriad of bear markets since the gold bullion bull market began in 1999-2002.
- Gold bullion bull and bear cycles last a long time. Twenty years is a short period of time for a gold bull or bear market, and many last a century or longer.
- I’ve predicted that this bull market will last a minimum of a hundred years, and more likely two hundred, and I stand by that prediction without wavering.
- Most of the world has been in a deflationary cycle since 1980. That’s when global bond yields peaked. Gold stocks tend to crash repeatedly in a deflationary cycle along with stock markets.
- In an inflationary cycle, gold stocks rally when stock markets rally… and they rally when stock markets fall. In August of 2018 I told investors to get ready for a sea change event; I predicted global stocks would crash in September-October, and gold stocks would surge higher as the stock markets crashed.
- That’s exactly what happened then, and I’ll calmly predict that it’s going to keep happening for the next decade of time.
- Please click here now. Double-click to enlarge. Silver bullion’s daily chart looks fabulous.
- There’s a double bottom pattern in play with a solid breakout. Note how the pullback stopped well above the $15 support zone. That’s another sign of a very healthy precious metals market.
- Key bank analysts are tuning into the solid fundamentals picture for silver. “Supply growth has started to slow, more than for any other precious metal.” – John LaForge, Wells Fargo Bank, Jan 28, 2019.
- Unlike America, China has tremendous “wiggle room” to stimulate its economy. GDP growth can likely be sustained at 4%-6% for many years, while it’s likely to be sub 2% in America for a long time. That bodes well for industrial silver demand, and Bloomberg analysts predict that demand will rise by 50% over the next 4-5 years!
- India is in an even stronger position than China, and vastly stronger than America. GDP growth is almost 8% now. It could rise above 10% and it probably needs to, to provide jobs for all the young citizens entering the workforce every day.
- Please click here now. Double-click to enlarge this silver stocks ETF chart. SIL is lagging GDX right now, and that’s technically positive; silver tends to lead as intermediate trends end, and lag as they begin and accelerate.
- Goldman’s analysts feel the global GDP and earnings decline in play now will hurt silver demand, but I think they are underestimating the ability of the Chinese government to stimulate.
- They are also underestimating the anger of American blue-collar workers who were essentially deflated (and arguably conned) by the central bank with its QE program. QE benefitted the banks, the stock market, and government.
- Blue-collar Americans wanted tax cuts. Corporations got a tax cut and the workers got nothing. Now they want their own version of QE handouts, in the form of wage hikes. Those hikes are going to happen as America enters a long period of GDP and corporate earnings stagnation. That’s phenomenal news for silver stock and bullion investors!
- Please click here now. Double-click to enlarge this GDX daily chart. Volume is positive, and the month-long consolidation appears to be ending. A gold-positive statement from the Fed today should move GDX like a shooting star towards my next $23 target price!
Special Offer For Website Readers: Please send me an Email to freereports4@gracelandupdates.com and I’ll send you my free “GDXJ Stars In The Sky!” report. I highlight key intermediate producers in the GDXJ ETF, with historical and current buy and sell points for eager traders and investors!
Stewart Thomson
Graceland Updates
Email:
Stewart Thomson is a retired Merrill Lynch broker. Stewart writes the Graceland Updates daily between 4am-7am. They are sent out around 8am-9am. The newsletter is attractively priced and the format is a unique numbered point form. Giving clarity of each point and saving valuable reading time.
Risks, Disclaimers, Legal
Stewart Thomson is no longer an investment advisor. The information provided by Stewart and Graceland Updates is for general information purposes only. Before taking any action on any investment, it is imperative that you consult with multiple properly licensed, experienced and qualified investment advisors and get numerous opinions before taking any action. Your minimum risk on any investment in the world is: 100% loss of all your money. You may be taking or preparing to take leveraged positions in investments and not know it, exposing yourself to unlimited risks. This is highly concerning if you are an investor in any derivatives products. There is an approx $700 trillion OTC Derivatives Iceberg with a tiny portion written off officially. The bottom line:
Are You Prepared?
- Is the price correction in gold already over?
- Please click here now. Double-click to enlarge. I told investors to prepare for a modest and healthy correction from the $1300 area, and that’s happened.
- Gold hasn’t even reached the first Fibonacci retracement line after staging a magnificent rally from the $1173 area. That’s a sign of immense technical strength.
- Please click here now. Double-click to enlarge. Silver has carved out a beautiful double bottom pattern. It’s now staging a textbook pullback to the neckline of that pattern.
- Whether the precious metals market correction is over or has a bit further to go is not important. What matters is the fundamental picture. That picture is healthy, and it’s about to get exponentially healthier.
- Please click here now. The odds of an import tax cut in the world’s most important gold market are higher now than at any point since the taxes were ramped up in 2012-2013.
- “You need the Indians to buy oil or gold.” – Jeff Currie, Global Head of Commodities Research, Goldman Sachs, Jan 16, 2019. Jeff says, “Buy commodities.”
- While senior citizens in the Western gold community may long for what is essentially a remake of the 1970s fear trade oriented gold market, today’s gold market is mainly about the rise of gold as a respected asset class. That’s being created by the ongoing rise of China and India as economic titans.
- Today’s Western fear trade for gold is more like icing on that cake than the centre stage price driver that it was in the 1970s.
- In a nutshell, a “goldaholic army” of three billion Chindian citizens is becoming wealthier at a very fast pace. That’s creating annual gold demand growth of 6%-8% that is essentially relentless. Mine supply can’t seem to grow more than 2%.
- It’s becoming a “no-brainer” that the gold price will rise consistently for decades to come, and probably for the next two centuries.
- The current price correction in gold is likely almost entirely due to the actions of Indian dealers operating on both China’s SGE and in Mumbai. They are in “quiet mode” ahead of the February budget that is expected to bring a significant cut in the import tax.
- In their eyes, there’s simply no point buying gold now when they can likely get it 5% cheaper in just a few weeks. Also, a duty cut would create a positive vibe amongst Indian citizens similar to the vibe created by Donald Trump’s MAGA program.
- The “minor” difference, of course, is that India is an gold-oriented emerging empire with the best citizen demographics and strongest GDP growth in the world. The bottom line: The current price correction in gold is probably the healthiest and most stable since the price corrections of 2003-2004.
- While today’s gold cake is Chindian, the icing is pretty tasty too. On that note, please click here now. Only 37% of America’s business leaders are optimistic. Top bank economists almost universally predict U.S. corporate earnings growth will fade from the 20%+ level to single digits and GDP will slide towards 1% by year-end.
- My recommendation for stock market investors is to focus on my short term guswinger.com signals for UDOW and SDOW while waiting for a major US business cycle trough. Once the trough happens (years from now) investors can begin accumulating big name US stocks using my unique pyramid generator to gracefully tranche into the market.
- US politicians promise citizens and corporations that enormous tariff taxes will “Make ‘Em Great”. This, while US blue collar workers are struggling with wages that are still below 1968 levels in real terms. These workers don’t need walls around an entitlements-themed ecosystem. They need serious tax cuts (all the way to zero) and they are just not happening.
- A single corporate tax cut to only the 20% level is not enough to make America great again, especially when there’s no corresponding chop in the size of government. Income tax, property tax, and capital gains tax need to be eliminated and replaced with a goods/service and financial transaction tax. That would reduce the size of the government dramatically and bring trillions of investment dollars roaring into the country.
- America could easily become a super-sized version of Switzerland, but in the eyes of its biggest hedge fund manager Ray Dalio, the country is instead staging an almost macabre debt-obsessed dance that ends with: Inflationary depression!
- America’s terrible population demographics and entitlements-oriented society are a giant drag on long term GDP growth. Business leaders know they can’t supply the government and the entitlements-obsessed citizens with anywhere near the amount of capital required to maintain this bizarre system.
- That’s spurring U.S. institutional interest in gold, and it’s happening as India’s government is about to follow China’s lead and endorse gold as a respected asset class.
- Gold is becoming an asset class like stocks and real estate that is not owned as a market “hedge” but for long term capital appreciation.
- Please click here now. Western institutional money has flowed into the key SPDR gold bullion ETF as the price has softly corrected from the $1300. That’s another sign of a very healthy market.
- Please click here now. Double-click to enlarge. As with gold, the correction in most gold stocks could be over! Note the bull wedge in play and the soft volume on the recent price decline. Now there’s a spike in volume and that could mark the end of price softness. A sell-off in the US stock market seems imminent, and I told gold stock enthusiasts in August to expect solid action from GDX in a stock market meltdown. That’s exactly what transpired… and the same thing is likely about to happen again!
Special Offer For Website Readers: Please send me an Email to freereports4@gracelandupdates.com and I’ll send you my free “Senior Gold Stock Superstars!” report. I highlight ten senior gold stocks that are poised to benefit from even a small gold price rally. I include key buy and sell tactics for both traders and investors!
Stewart Thomson
Graceland Updates
Email:
Risks, Disclaimers, Legal
Stewart Thomson is no longer an investment advisor. The information provided by Stewart and Graceland Updates is for general information purposes only. Before taking any action on any investment, it is imperative that you consult with multiple properly licensed, experienced and qualified investment advisors and get numerous opinions before taking any action. Your minimum risk on any investment in the world is: 100% loss of all your money. You may be taking or preparing to take leveraged positions in investments and not know it, exposing yourself to unlimited risks. This is highly concerning if you are an investor in any derivatives products. There is an approx $700 trillion OTC Derivatives Iceberg with a tiny portion written off officially. The bottom line:
Are You Prepared?
If you would like to receive our free newsletter via email, simply enter your email address below & click subscribe.
 Follow us on Twitter
 Become our facebook fan
CONNECT WITH US
Tweets
Tweet with hash tag #miningfeeds or @miningfeeds and your tweets will be displayed across this site.
MOST ACTIVE MINING STOCKS
Daily Gainers
 CMC Metals Ltd. CMC Metals Ltd. |
CMB.V | +900.00% |
 Eden Energy Ltd Eden Energy Ltd |
EDE.AX | +200.00% |
| GoviEx Uranium Inc. |
GXU.V | +42.86% |
| Eagle Nickel Ltd. |
ENL.AX | +41.67% |
| Citigold Corp. Limited |
CTO.AX | +33.33% |
| Mount Burgess Mining NL |
MTB.AX | +33.33% |
| Exalt Resources Limited |
ERD.AX | +31.94% |
| Casa Minerals Inc. |
CASA.V | +30.00% |
| Cariboo Rose Resources Ltd |
CRB.V | +28.57% |
| Belmont Resources Inc. |
BEA.V | +28.57% |


