A few weeks ago we wrote that it may not be Gold’s time yet but a few recent developments suggest its time could be sooner than we anticipated. Although Gold failed to breakout last week, we should note the positive action in the miners. Over the past seven trading days the miners have strongly outperformed Gold. That includes the juniors, which appear very close to breaking out of the downtrend that has been in effect for over 12 months.
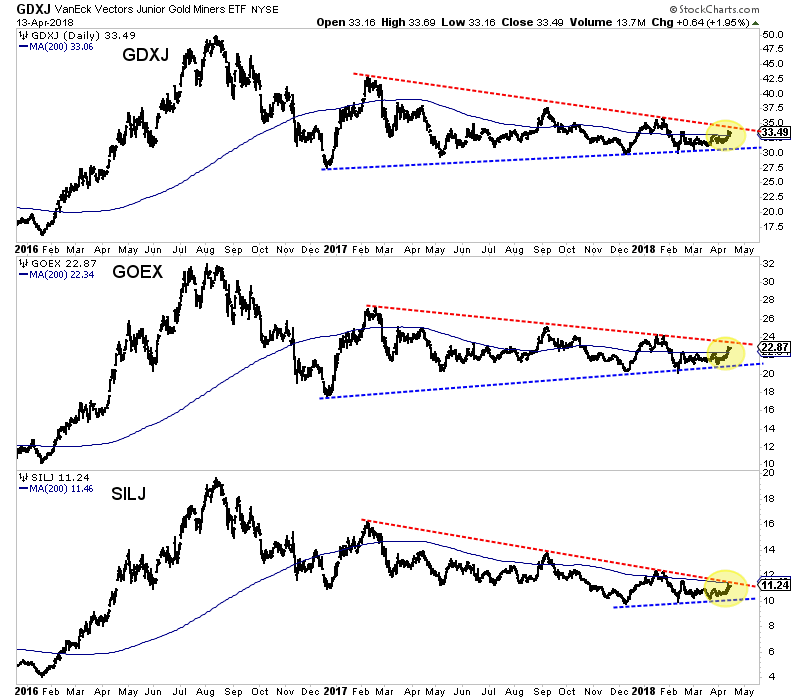
In the chart below we plot the three major junior ETFs: GDXJ, GOEX (explorers) and SILJ (silver juniors). The juniors have trended lower since February 2017 but are now threatening to break trendline resistance. Since December 2017 the juniors have traded in an increasingly tighter and tighter range which indicates a break is coming very soon. Also, note how the 200-day moving averages are flat and no longer sloping lower. That reflects a mature correction and the potential for a new uptrend if the juniors break above resistance in a strong fashion.
GDXJ, GOEX, SILJ Daily Bar Charts
There are a few other things worth mentioning.
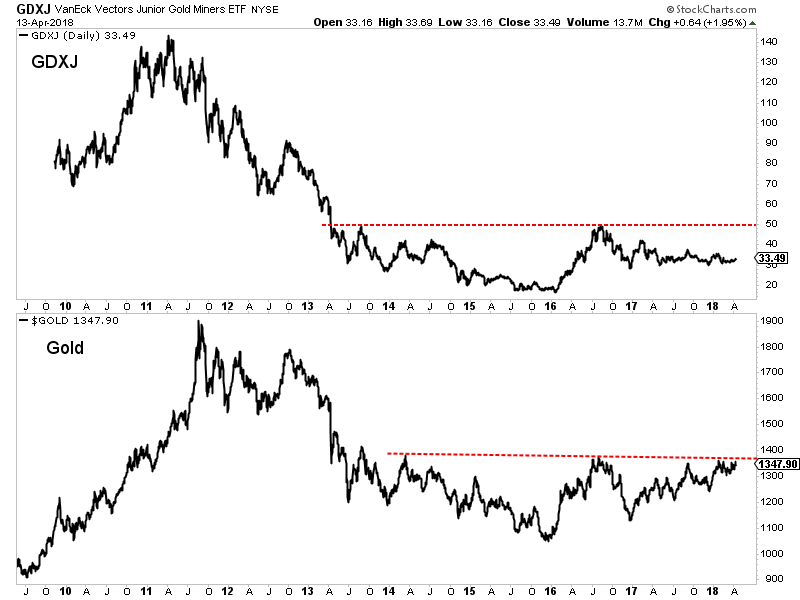
First, as we alluded to, GDXJ has strongly outperformed Gold over the past seven trading days. The GDXJ to Gold ratio has reached its highest mark since the start of February. That sudden relative strength is significant considering Gold is within spitting distance of a major breakout.
Second, one custom breadth indicator we track is the percentage of juniors (a basket of 50 stocks) trading above the 200-day moving average. This figure (currently 42%) has not exceeded 51% since February 2017. A strong push above 51% could confirm a renewed uptrend in the juniors.
If juniors are going to break out of their downtrends, it could mark the start of potentially a very large move. Gold, upon a breakout through $1375, will have a measured upside target of roughly $1700/oz. Although the juniors aren’t very close to breaking their 2016 high, they, upon a breakout would have similar upside potential. GDXJ, upon a breakout through $50 would have a measured upside target of $83.
GDXJ & Gold Necklines
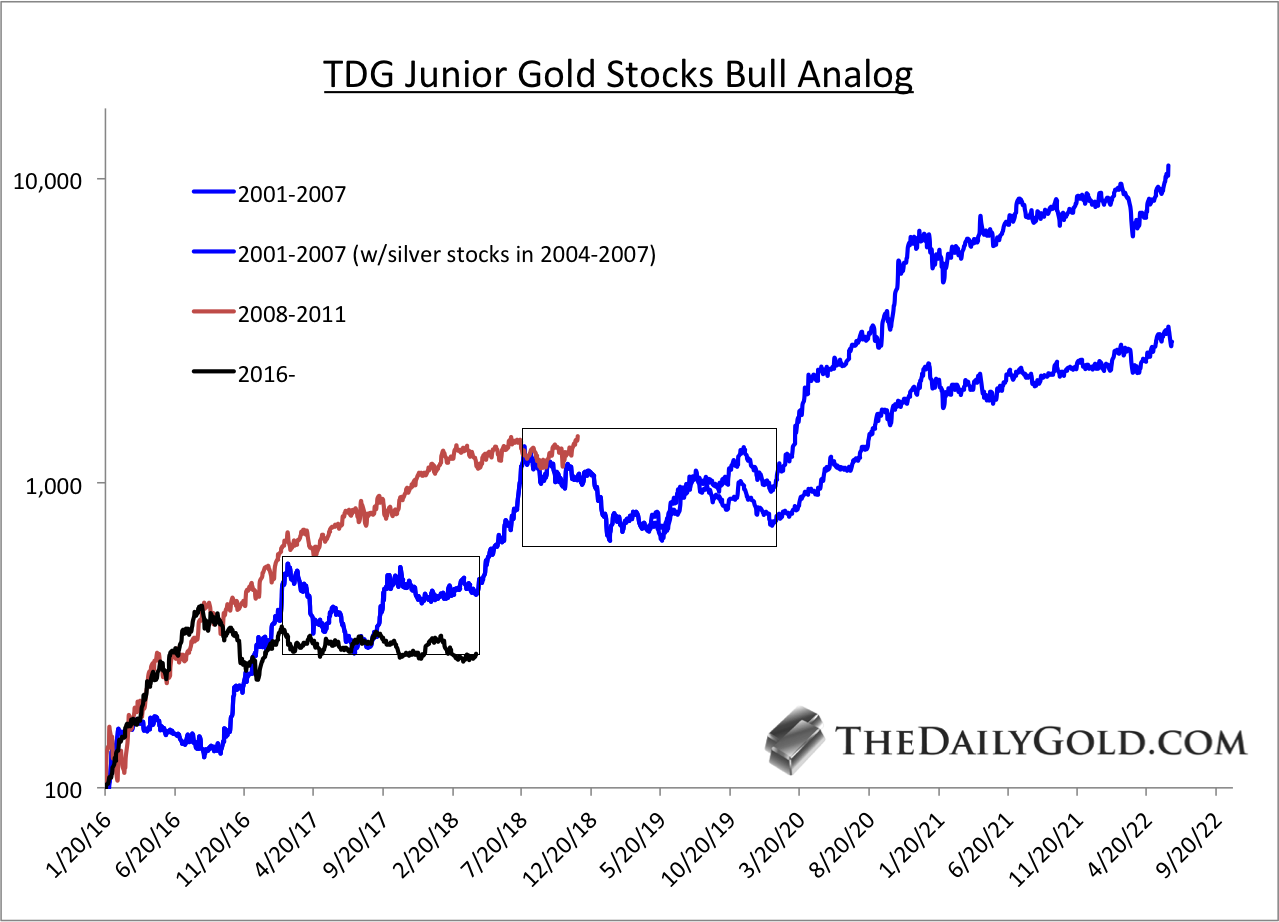
That potential measured upside target for GDXJ may seem extreme but for juniors its par for the course. Below we show an updated chart of our Junior Gold Stocks Bull Analog. By my data, juniors are well below where they were during the 2001-2007 and 2008-2011 bull markets. So if Gold breaks higher and is going to reach $1700/oz then juniors are likely to catch up to historical performance.
TDG Junior Gold Stocks Bull Analog
Although Gold failed to breakout (again) last week, the performance in the gold stocks did not confirm that failure. The newfound relative strength, if sustained over the next few weeks could signal that a sector breakout is much closer than previously anticipated. The juniors are very close to breaking their downtrend and that break could only be the start of a potentially massive move. In anticipation of that potential move, we have been accumulating the juniors that have 300% to 500% upside potential over the next 18-24 months. To follow our guidance and learn our favorite juniors, consider learning more about our premium service.
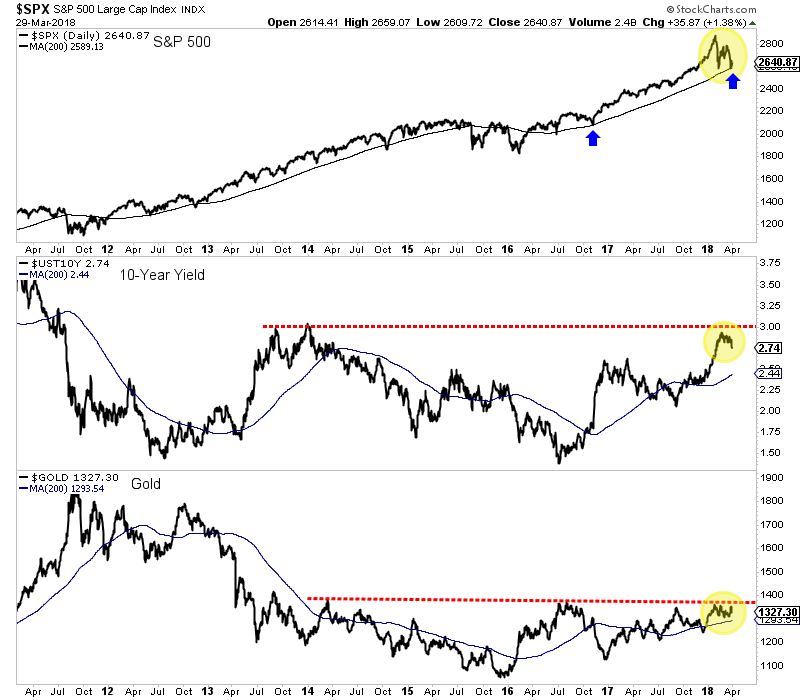
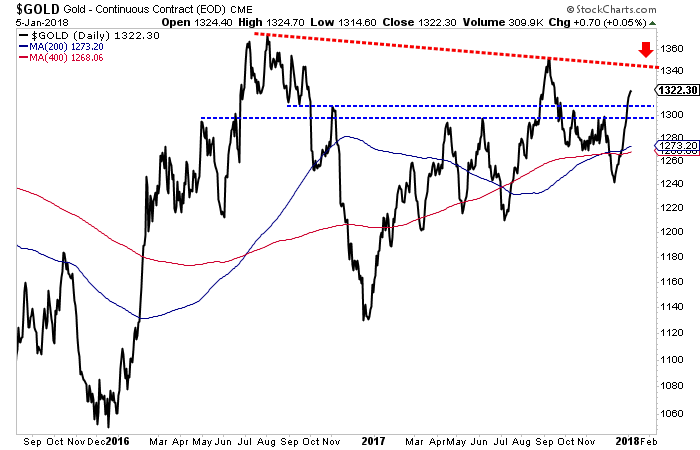
Last week we noted that Gold’s quarterly close would be a key marker for Gold’s immediate breakout potential. Gold was seemingly on course for its highest quarterly close since 2012 until it reversed back below quarterly resistance at $1330/oz. Hence, an imminent break to the upside is unlikely and gold watchers will have to remain patient. It’s not yet Gold’s time. It will be soon enough.
One catalyst for the most recent strength in Gold (the correction in equities) appears to have faded as the S&P 500 has held its 200-day moving average. A sustained rebound in equities while bond yields correct would not be particularly bullish for Gold. The obvious reason is capital is flowing into equities and not Gold. A rebound in equities amid a temporary reduction in inflation expectations would equate to stable or rising real yields.
Essentially, there are two ways Gold can break to the upside. The first is Gold senses a breakout in long-term bond yields and a sustained rise in inflation expectations. Those developments would soon negatively impact the economy and stock market which would lead to easier Fed policy and ultimately falling real yields.
The other scenario is bond yields do not break to the upside, there is a slowdown, the stock market declines and the Fed has to reverse course all together. As we predicted in past editorials, long-term yields are trending lower and that could continue. In the meantime, Gold will not break to the upside unless the stock market experiences more turmoil.
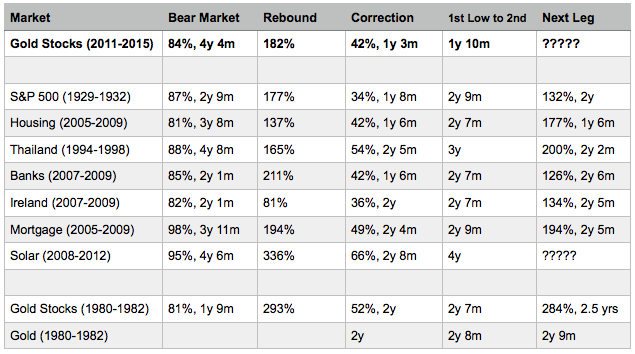
Take a look at those examples and note the time between the end of the bear market and the next significant low (from which the bull resumed). In most cases the time between those lows is two years and seven to nine months. For the gold stocks it has only been two years and two months since that epic January 2016 low.
Assuming stocks rebound and long-term bond yields continue to moderate, then Gold is unlikely to breakout this spring. However, that is perfectly okay as our historical study suggests the miners (while facing little downside) may not begin a real bull move for several months. Gold Investors should not be discouraged as they could panic at the absolute worst time (I’m already seeing it anecdotally). Regardless of whether the bull move begins in a few months, five months or whenever, we continue to remain patient while accumulating the juniors we think have 500% return potential over the next 18-24 months. To follow our guidance and learn our favorite juniors for the next 12-18 months, consider learning more about our service.
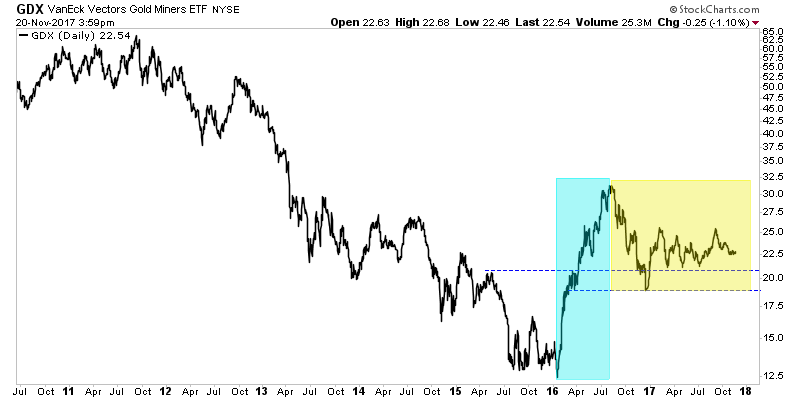
The rally in Gold and gold mining stocks easily surpassed our expectations and targets. The strength has been far more than we anticipated. The gold stocks blew past their 200-day moving averages while Gold blew past $1300/oz. Now it is time to take a technical look and focus on the key support and resistance targets.
The strength of the rebound pushed the miners well beyond their 200-day moving averages and to their June and October highs. GDX is consolidating just below $24 while GDXJ is consolidating just below $35. If this consolidation turns into a correction then GDX and GDXJ could find support at their 200-day moving averages which are at $22.71 and $33.37 respectively. As you can see, should GDX and GDXJ be able to exceed recent peaks then they could rally towards important resistance levels. Those are $25.50 for GDX and $38 for GDXJ.
The rally has been just as strong in Gold as it surpassed resistance in the $1300-$1310/oz zone. Gold closed the week at $1322/oz. Should Gold pause or correct here then the sellers could push the market down to previous resistance but now current support at $1300-$1310/oz. Trendline resistance will come into play near $1340/oz while the 2016 and 2017 peaks would provide resistance in the $1350-$1370/oz zone.
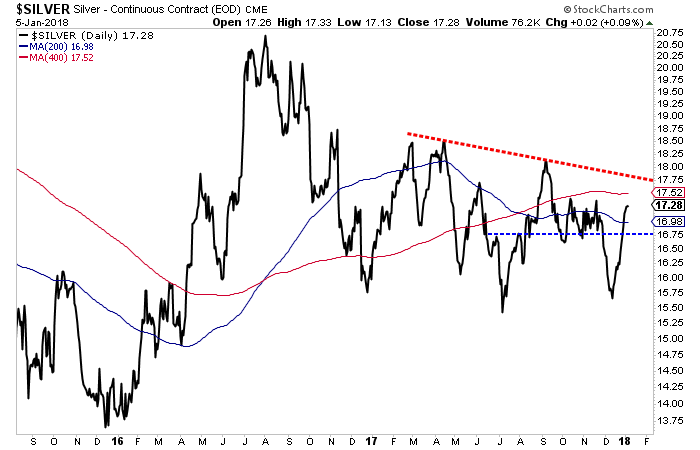
While we are at it, let us take a look at Silver which exploded past resistance in the mid $16s. Silver will face resistance first at $17.75 then at $18.50. A break above $17.75 and the red trendline is the first step for Silver. The second would be reaching $18.50, a new 52-week high. Next week Silver will face immediate resistance around $17.30 (the October and November highs) but it will have strong support in the mid to upper $16s.
The precious metals complex has made important progress in recent weeks. Markets have broken key resistance levels and have showed no signs of slipping anytime soon. Gold is holding above previous resistance at $1300-$1310/oz while not being far from multi-year resistance in the mid to upper $1300s. The gold mining stocks have reclaimed their 200-day moving averages while consolidating tightly beneath the June and October highs. If and when GDX and GDXJ break those levels then they will be only one step away from a full blown bull market. That step is breaking above the September highs.
It has been a while since we’ve applied historical analysis to the precious metals sector. It is something we really enjoy as history can help define and contextualize current trends and help us spot opportunities. Back in March of this year we noted that the gold stocks could be following the path of recovery of housing stocks since their 2009 bottom. Recently, James Flanagan of Gann Global Financial has produced some excellent videos discussing some historical comparisons that are quite relevant to the gold stocks at present. We saw his videos, remembered our housing analog and wanted to take it a step further. What was the path of recovery of markets following mega bear markets?
We define a mega bear market as at least an 80% decline that lasted roughly three to four years. The image below highlights the data we’ve compiled. Some of the bears are only two years long but they follow the general recovery path. That consists of a very strong initial rebound that lasts six to twelve months which is followed by a correction and consolidation which usually lasts 18 months to two years. Then, the market begins its next impulsive advance.
Next we will look at the three best fits to the gold stocks at present.
The housing stocks may be the best analog. They lost 81% during a bear market which lasted nearly four years. Then they recovered 137% before correcting 42% over 18 months. Over the next 18 months (from the 2011 low to 2013), the housing stocks gained 177%.
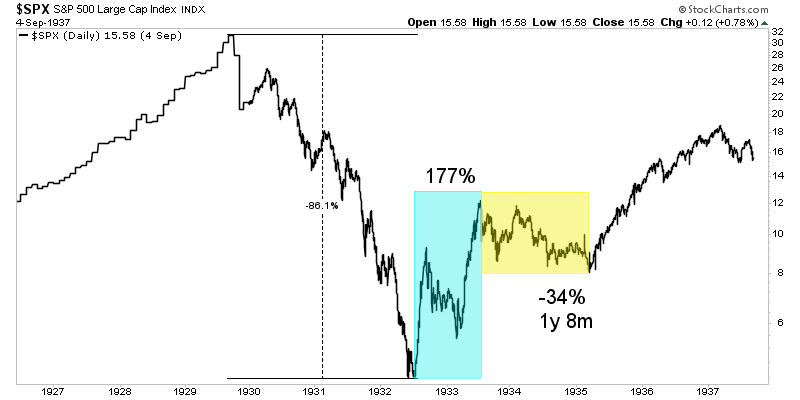
The S&P 500 during the Great Depression is also a good fit. The market lost 86% over nearly three years. That led to a 177% rebound which was followed by a 34% correction over one year and eight months. The market then rebounded 132% over the next two years.
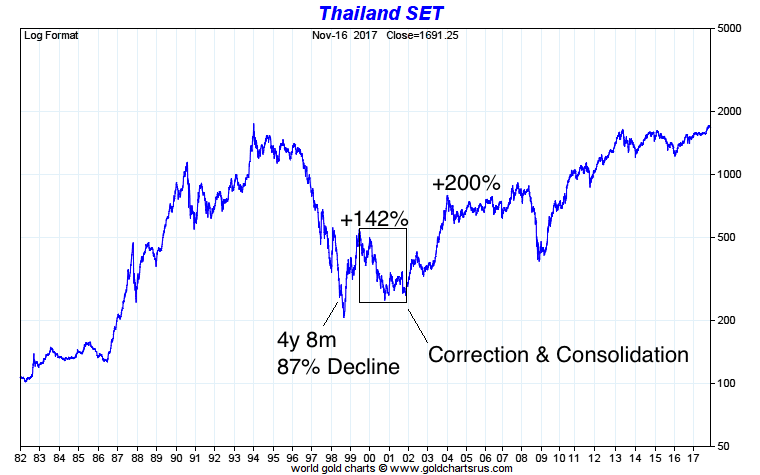
Finally, Thailand is an interesting example. It lost 87% over a greater than four year bear market. Both time and price were similar to the bear market in gold stocks. After rebounding 142%, Thai stocks lost 54% over the next year and four months. While that low in late 2000 marked the corrective low in price, the market did not begin an impulsive advance for another year. However, it was worth the wait as the market gained 200% over the following two years.
The gold stocks have followed the recovery path of these markets but there are some slight differences. The corrections and consolidations in Housing and the S&P 500 were less severe as those markets tested or at least came close to testing their initial rebound peaks. The correction in Thailand was more severe as that market shed 54% in 16 months. At present, gold stocks are in the 16th month of their correction and are down roughly 30%-35%. In any case, we expect the current correction and consolidation to continue into 2018.
There is no guarantee of a future breakout move in precious metals but the gold stocks are following a specific history of recoveries following mega bear markets and that history implies a major move higher should begin sometime in 2018. When we consider the time of the corrections and time between the two bottoms along with the slight weakness in gold stocks as compared to some of the examples, we expect the next significant low to be in Q2 or Q3 2018. The low does not necessarily have to be an absolute price low. It would mark the point from which the gold stocks would begin an impulsive advance. In the meantime, the key for traders and investors is to find the best companies and seek oversold situations with value and catalysts that will drive buying. To follow our guidance and learn our favorite juniors for 2018, consider learning more about our premium service.


 Follow us on Twitter
 Become our facebook fan


