It was an interesting week in the precious metals complex. There appeared to be the start of a short squeeze in Silver (hedge funds were heavily short) but it ceased at an important resistance. Meanwhile, Gold closed the week on a weak note, losing $1340-$1350. The gold stocks, like silver closed the week below technical resistance. The price action in the complex continues to suggest that a breakout in Gold is the key to unleashing strong outperformance from Silver and the gold stocks.
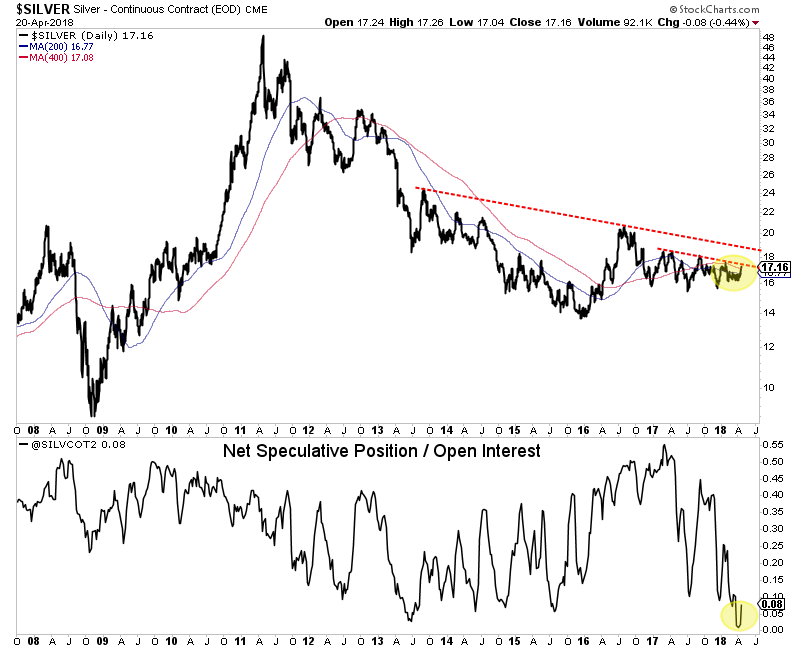
While Silver has very supportive sentiment, it has not broken out from its downtrend yet. The net speculative position was at 1.1% a few weeks ago, an all time low. That won’t spring Silver by itself unless Silver can surpass critical resistance in the mid $18s. And that may not happen until Gold breaks $1360-$1370. Silver has strong support in the low to mid $16s.
Silver & Silver Net Speculative Position
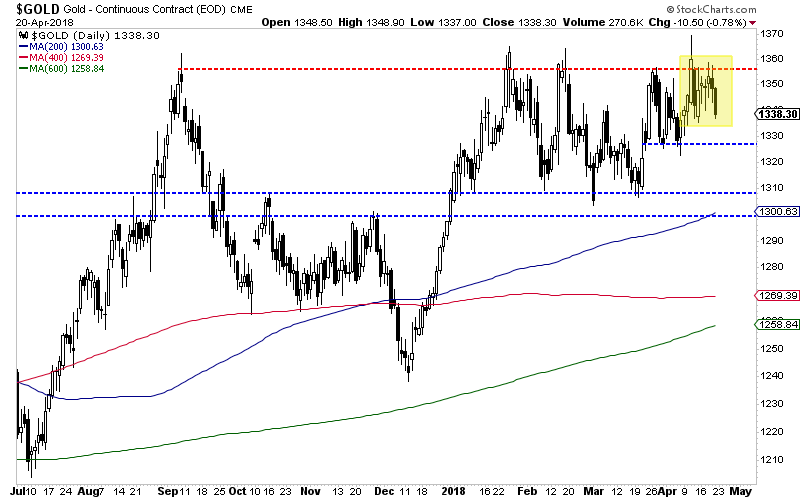
Moving to Gold, the daily chart below shows Gold losing $1340-$1350 after rejection again at $1360. Immediate support for Gold lies at $1325 which if broken would lead to a test of $1300-$1310 and the 200-day moving average.
Gold Daily Candles
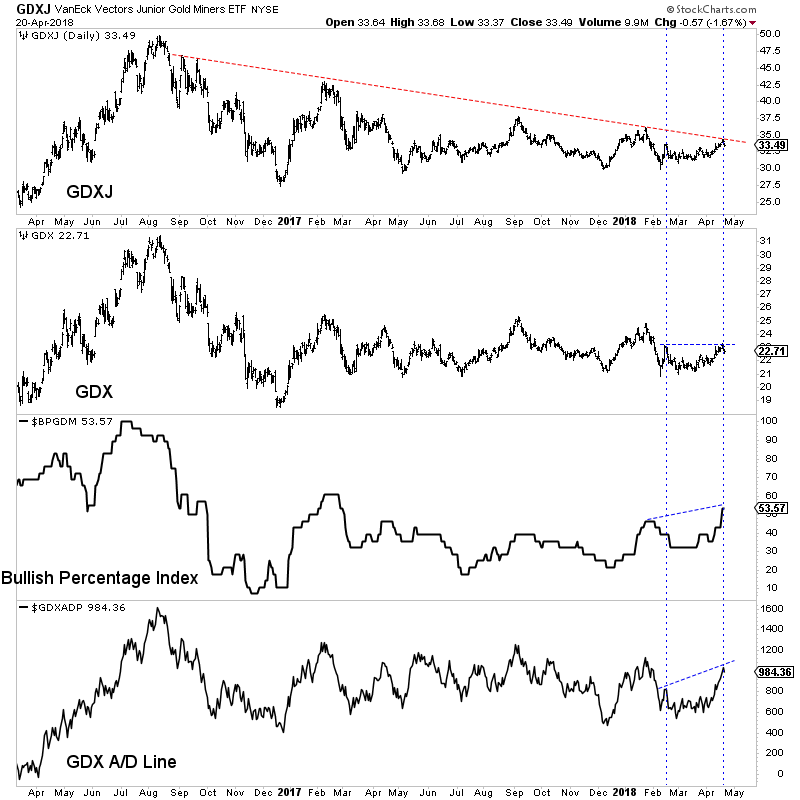
We have a few observations to share with respect to the gold stocks. First, GDXJ has pulled back from trendline resistance around $34. Second, breadth indicators for GDX such as the advance decline line (A/D) and the bullish percentage index (BPI) are showing a positive divergence. The BPI has reached a 52-week high while the A/D line is not far from its January peak when GDX nearly hit $25. So while GDX has been relatively weak, its internals are showing more strength.
Silver and the gold stocks have yet to break important resistance as Gold once again was turned back at major resistance. If the US Dollar, which closed at 90.07, rallies up to its 200-day moving average at 92, Gold would likely test $1300-$1310. Should Silver and the gold stocks hold up well in that scenario (which could be suggested by current breadth) then it would imply a good rebound from the sector back to resistance points. Lower prices in the juniors would be a welcome sign and another opportunity to accumulate ahead of a major breakout in the not too distant future. In anticipation of that breakout, we have been accumulating the juniors with 300% to 500% upside potential over the next 18-24 months. To follow our guidance and learn our favorite juniors, consider learning more about our premium service.
The past 18 months have been difficult for precious metals investors. If you had known Donald Trump would be elected and the US Dollar would soon begin a nearly 15% decline, you would have expected Gold to blow past its 2016 high. You would have been shocked to see the gold miners and junior gold stocks trading lower. Gold has fared okay but the gold stocks and Silver have lagged. As US equities have continued to power higher, precious metals have struggled to perform while volatility in the space has dwindled. Precious metals volatility has reached extremely low levels and this is a sign that a major move, while not necessarily imminent is surely on the horizon.
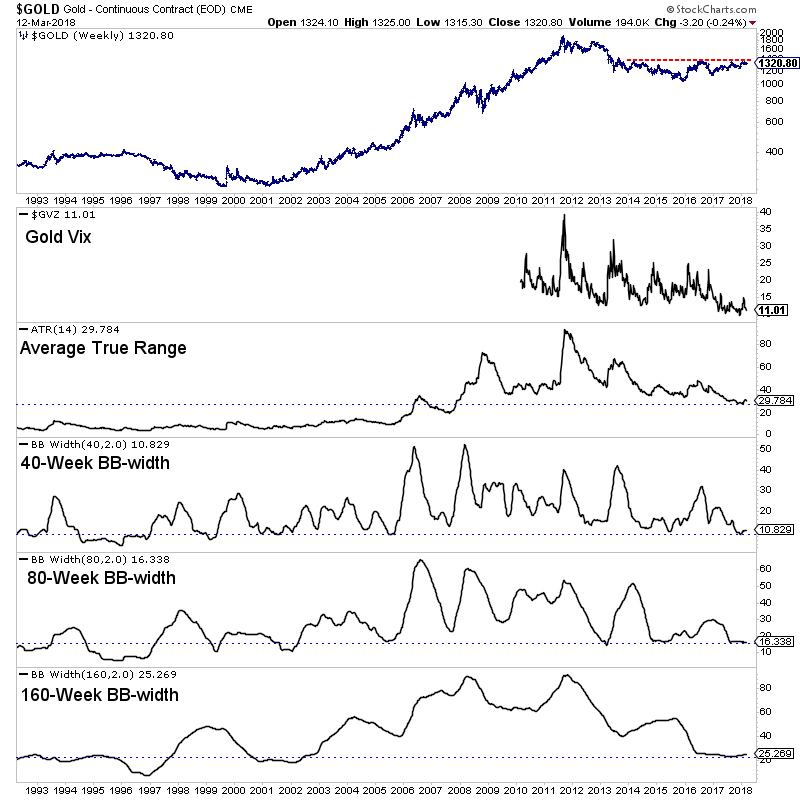
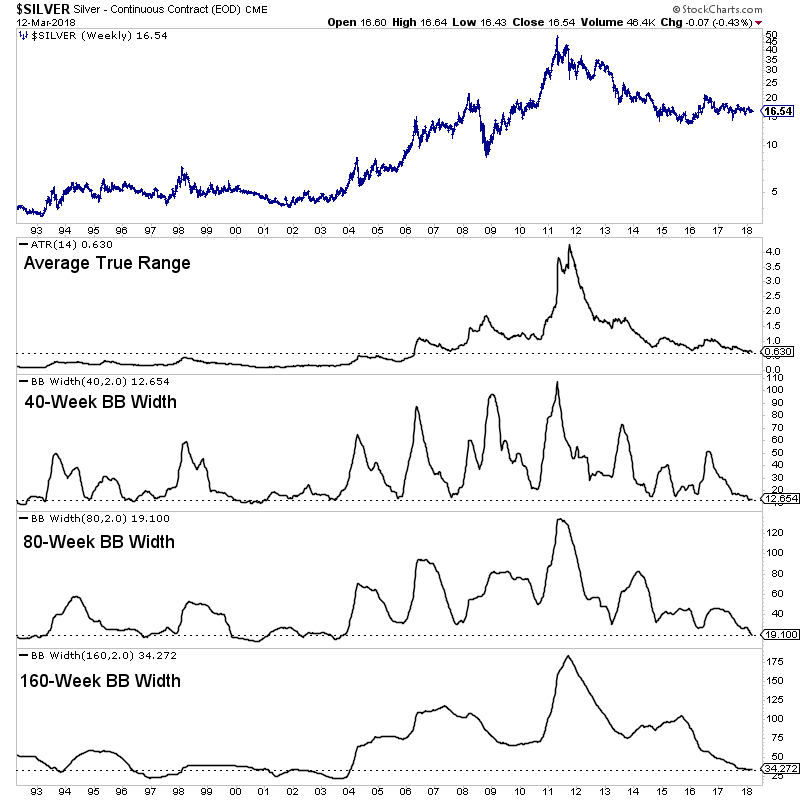
We plot a weekly bar chart of Gold that includes a handful of volatility indicators such as the Gold Vix (GVZ), Average True Range (ATR) and several bollinger band widths (BBw). These indicators have touched major lows in recent months. The Gold Vix which began trading in 2010 recently touched its lowest level ever at 9. ATR recently touched its lowest level since 2007. The 40-week and 80-week BBw’s recently hit their lowest levels since 2005 while the 160-week BBw recently touched its lowest level since 2002.
Like Gold, Silver is showing significantly low levels of long-term volatility. Its ATR recently touched its lowest point since 2006. The BBw for three time frames (40 week, 80-week and 160-week) recently touched 14 year lows.
Although the gold stocks are one of the most naturally volatile markets, they too are showing significantly low long-term volatility. Below we plot the NYSE Gold Miners Index, which is the parent index of GDX along with similar volatility indicators. The ATR indicator recently touched a 15 year low. Interestingly, both the 40-week and 80-week BBw’s recently hit some of the lowest points of the past 25 years. The 40-week BBw recently tied 2007 for the lowest point in the past 25 years while the 80-week BBw recently touched a 6-year low and its 3rd lowest point of the past 25 years.
The major markets within the precious metals sector are showing extremely low levels of long-term volatility. At somepoint this will change but we cannot know exactly when. Given our long-term bullish bias, our thinking is volatility could increase as Gold approaches resistance and then accelerate upon a break-out in Gold. Note that low volatility can last for a while and will not suddenly change overnight. It may slowly start to increase at first. While we cannot know when, we do know that extremely low volatility is present and can facilitate a major move over the next 12 to 24 months. With more time ahead before an increase in volatility and a potential break-out we continue to remain patient and accumulate the juniors we think have 500% return potential over the next 18-24 months. To follow our guidance and learn our favorite juniors for the next 12-18 months, consider learning more about our service.
Gold was well bid during the equity correction but it could not breakout then and has retreated as equities have roared back. As a result, the Gold to stocks ratio has retraced most of its recent surge. Meanwhile, the US Dollar has rebounded and the oversold and overhated bond market could be starting a rally. The recent rise in long-term bond yields which has benefitted Gold appears due for a pause or correction. Meanwhile, Gold could also correct and consolidate as it waits for a breakout in long-term bond yields which should in turn benefit Gold.
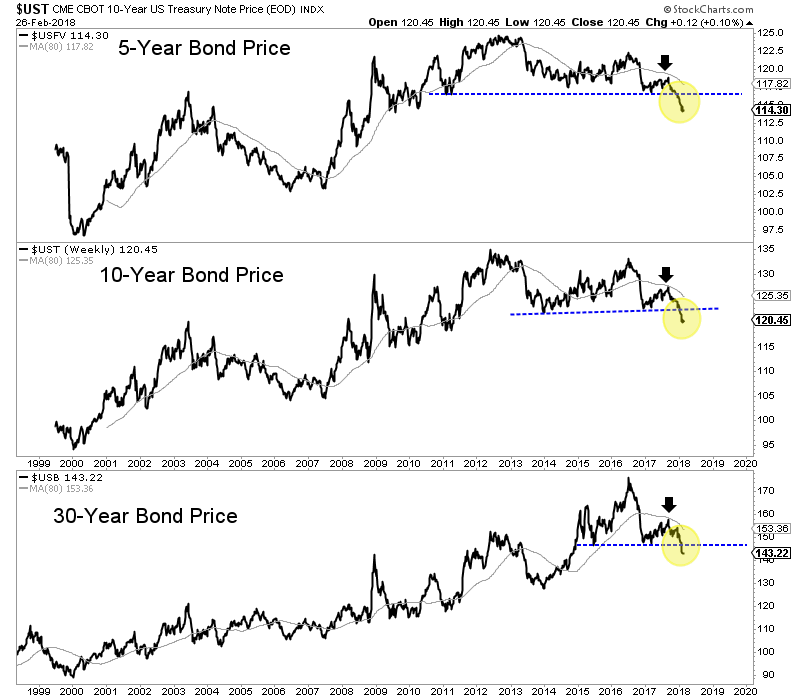
As we noted in One Big, Potential Catalyst for Gold in 2018, Gold is no longer trading with bonds and therefore could benefit from a big breakdown in bonds. As the chart below shows, the bond market has experienced a major breakdown. In recent days, the 5-year, 10-year and 30-year bonds all touched multi-year lows.
The breakdown in the bond market has helped Gold rally but why hasn’t Gold reached the corresponding multi-year highs?
First, we should remember that the correlation between Gold and bonds was positive until November 2017. The market has begun to sense inflation only recently.
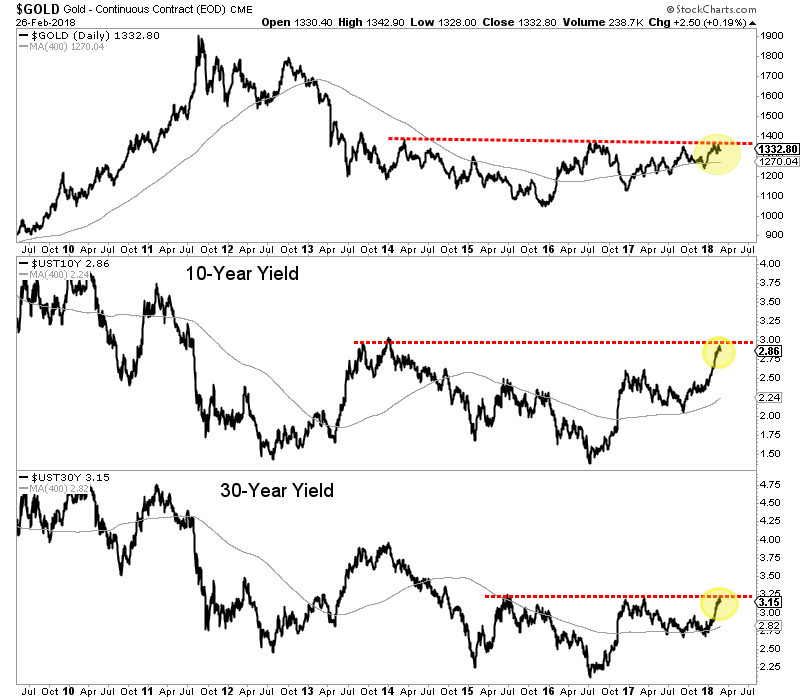
Second, while bond prices have broken down to multi-year lows, bond yields (and specifically long-term yields) have yet to breakout to multi-year highs.
The chart below shows long-term yields are testing multi-year resistance. For the 10-year yield, a strong push above 3.00% would mark more than a 6-year and almost 7-year high. A break above 3.25% in the 30-year yield would mark a 4-year high.
We have argued that Gold was unlikely to breakout immediately due to its lack of relative strength as well as the lack of strength from Silver and the gold shares.
If that remains the case then we would also expect bond yields to correct and digest their recent advance rather than breakout. We should also note that the daily sentiment index for bonds hit an 18-day average of 15% bulls. That is a bearish extreme and suggests the probability that bonds will rebound and yields will decline.
Gold could be waiting for a major breakout in bond yields, which would be a reflection of increasing inflation and inflation expectations. It would also result in more pressure on the economy and therefore the stock market. That would benefit Gold in both nominal and real terms. We expect a counter-trend move in Gold and bond yields before a breakout. This will allow us a bit more time to position in the juniors that should deliver fantastic returns. To follow our guidance and learn our favorite juniors for the next 12-18 months, consider learning more about our service.
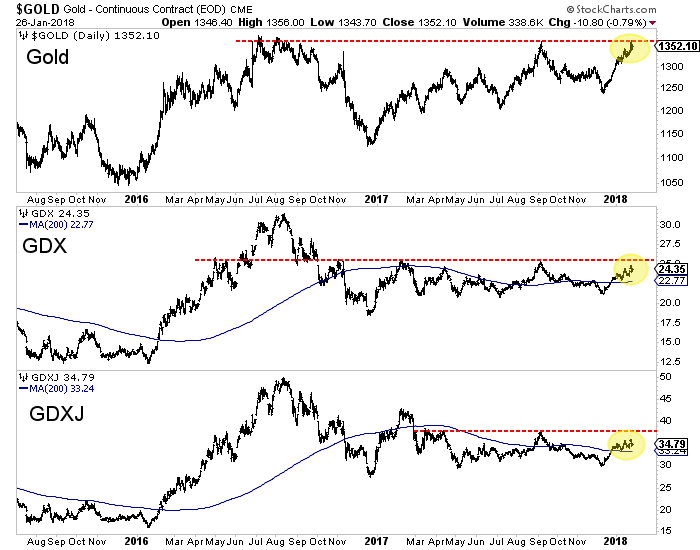
Gold and gold stocks have enjoyed an excellent rebound since their December lows. Over the past six weeks Gold rebounded from a low of $1238 all the way to $1365 in recent days. The miners meanwhile rebounded nearly 18% (GDX) and 21% (GDXJ). However, these markets are approaching important resistance levels and at a time when sentiment is becoming stretched and the US Dollar has become very oversold.
Take a look at the charts of Gold, GDX and GDXJ. Gold has reached the September 2017 highs while GDX came within 2%-3%. GDXJ is lagging but came within less than 5%. Another round of buying over a few days should be enough to push the miners to resistance.
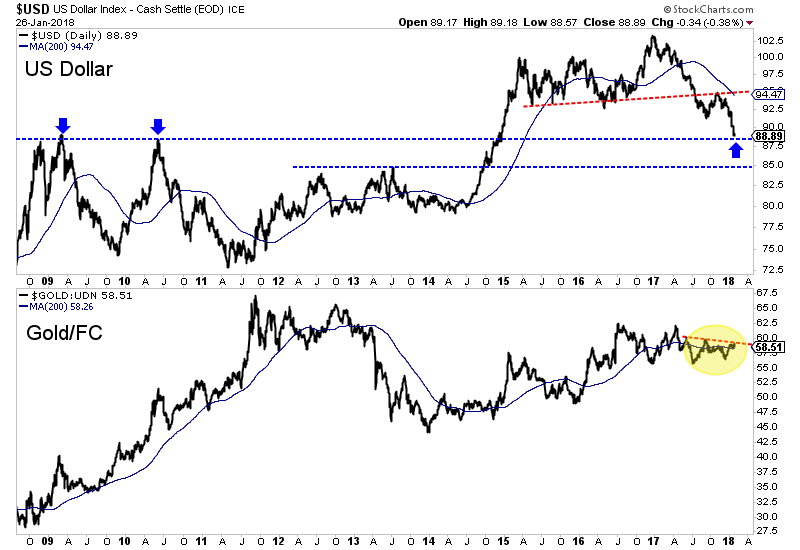
Recent strength in Gold and gold stocks is mostly due to weakness in the US Dollar which is very oversold and approaching important support. On Friday, the US Dollar Index touched 88, which marks the 2009 and 2010 peaks and is the only real support between the low 80s and the low 90s. We also plot Gold against foreign currencies (Gold/FC) which tells if Gold is rising in real terms or if its rising due to the US Dollar weakness. Gold/FC failed to break above key resistance. That signals that over the short-term, Gold would be vulnerable to a bounce in the US Dollar.
Some sentiment indicators suggest the rebound in precious metals could be in its later innings. Thursday the daily sentiment index for Gold hit 91% bulls. Friday, the daily sentiment index for the greenback hit 10% bulls. The CoT’s are not as extreme. Gold’s net speculative position (relative to open interest) is 40% bulls. The 2011, 2012 and 2016 peaks were around 55% bulls. Meanwhile, Silver’s net speculative position is at 26% bulls.
Gold and gold stocks have enjoyed a great rebound since the Fed rate hike but technicals and sentiment suggest they are due for a pause or correction. The miners and Gold are very close to the resistance levels we noted in a recent editorial. Recent strength has been driven mostly by weakness in the US Dollar which is very oversold and testing support. Meanwhile, the daily sentiment index has reached short-term extremes for Gold and the greenback. The odds appear to favor a pause in this rebound or a short-term correction. That is great news for anyone who missed the rally as it would setup a decent buying opportunity before a major breakout. We continue to seek the juniors that are trading at reasonable values but have fundamental and technical catalysts that will drive increased buying. To follow our guidance and learn our favorite juniors for 2018, consider learning more about our premium service.


 Follow us on Twitter
 Become our facebook fan


