I continue to receive questions regarding the direction of the market, to which I can only reply “I don’t know.” I certainly have thoughts about the factors affecting metals markets, but am not under the illusion that I KNOW where the market is headed.
What I do know is that my money is best invested, in tranches, in the best companies in the sector. The best companies are led by the best management teams and, besides the pure exploration companies, are the owners of the highest quality projects.
By high quality, I’m referring to their economics. The best projects have robust economics at today’s metal prices.
It’s my opinion that when market sentiment does eventually change, the bull portion of the next cycle will be HUGE. Along with the supply shortages that I see in the fundamentals of most of the metals, the demand side of the equation looks particularly strong as, globally, the world begins to push toward electrification.
With the short-term direction of the market hard to gauge, one avenue for investors who want to give themselves the potential to profit in the relative immediate future, is to look at exploration companies with a program happening now or in the near future.
Like development companies, the best exploration companies are headed by the best management teams, who have chosen their exploration projects by a set of criteria which gives them the best possible chance at success.
I highly encourage investors to meet, or at the very least call, the people who are running the companies with which they are going to place their money. One of the questions that I think needs to be asked is how the company came to the conclusion that the project they are going to be exploring gives them the best chance at finding a mineral deposit of value.
A company which has been one of my favourites for some time now is Adventus Zinc Corporation (ADZN:TSXV). They are developing their Curipamba project in Ecuador. While I’m looking forward to an updated PEA on Curipamba in the new year, it’s Adventus’ exploration potential with their Pijili and Santiago projects that has my full attention – and excitement – at the moment.
Let’s take a look!
Determining Potential Value in Exploration
Determining the upside potential or value of an exploration company isn’t easy, as much of the criteria is subjective in nature. Here are, in my opinion, a few of the most important points to ponder when it comes to evaluating investment in an exploration company:
#1 – Quality of the Management Team – Take a good look at the management team and any advisors or consultants associated with the company. Past success is a very good indicator of future potential. A good CEO should be able to clearly define the details, mainly the why and how of their upcoming exploration program.
#2 – Jurisdiction –Typically, the regions with the highest potential for uncovering a high value mineral deposit are those which have the most associated risk. It’s imperative to do your due diligence and understand where you are putting your money. Know your risk tolerance – buyer beware.
#3 – A Project’s Historical Work – Answer the following questions:
In what stage of exploration is the project?
Has surface work been completed? Grab samples, soil samples, geophysics?
Is the project drill ready? How were the targets chosen?
Historical work on the project?
Has the project already been explored by multiple companies?
If yes, what were their results? Why should you expect anything different?
NOTE: If a company is looking at exploring or developing a project that has already had a lot of work or exploration completed on it, the company needs to clearly outline how their exploration approach is different from the previous operators, and why it has a chance to be successful.
#4 – Cash – Cash is especially important in the current market. Does the company have enough money to execute on the exploration program that they have planned?
#5 – If unsuccessful, will I be able to sell? – This is an important question to answer and is partially overlapped with the previous point regarding cash. For me, I want to speculate in a company that will have cash remaining after their exploration program is complete in both positive and negative scenarios. An even better situation is to speculate in a company that will have cash remaining and an additional project(s) further down the development path, to which the market can assign value. In my opinion, you don’t want to be invested in a company that doesn’t have any money at this point in the market cycle, let alone own one with a recent unsuccessful exploration program.
Adventus’ Exploration Potential
Let’s use the criteria I just outlined to look at Adventus.
#1 –Quality of the Management Team – In my opinion, the Adventus team is as good as they come in the junior resource sector. The company is led by CEO, Christian Kargl-Simard, who has over 14 years of experience in both technical and finance roles in the mining industry. Additionally, and core to the team, is VP Corporate Development, Sam Leung. Leung has over 10 years of experience in the mining industry, having worked for Lundin Mining Corporation prior to joining Adventus. Finally, and key to Adventus’ exploration efforts in Ecuador, is VP Exploration Jason Dunning. Dunning has over 20 years experience in the mining industry and has worked in a similar role for Alamos Gold Inc., Selwyn Resources Ltd. and Yukon Zinc Corporation.
In addition to the main team, a major strength of the company, in my opinion, is in their association and close connection with Altius Minerals. For those who are unaware, Altius is both a diversified mining royalty company and mineral exploration project generator. Altius is headed by CEO, Brian Dalton, who is also Chairman of Adventus’ Board of Directors.
Also, Dr. Lawrence Winter, Altius’ VP Exploration, is an advisor to Adventus and, in my experience, has a top notch reputation throughout the resource sector.
People are key to the success of any company and, in the case of Adventus, I’m confident that this team will make 2019 a pivotal year in the company’s development.
#2 –Jurisdiction – Adventus’ project exploration and development focus is in Ecuador. For those who are unaware, Ecuador has a rocky past when it comes to mining investment. In my opinion, however, it’s changing in a direction that is attractive to mining investment and is a place where I have invested my cash. Earlier this year, I wrote an article regarding Ecuador’s mining investment attractiveness; for those considering investment in Ecuador, I believe it’s a must-read.
#3 –Historical Work
Adventus is in, what I consider to be, a highly advantageous position when it comes to exploration and development in Ecuador; they are partnered with Salazar Resources, a junior resource company led by a senior Ecuadorian management team.
The Curipamba project was the first deal on which the two companies partnered, giving Adventus the opportunity to earn-in on 75% of the project, given development and payment requirements over a 5-year period.
Since this initial deal, Adventus and Salazar have expanded their relationship into an Ecuador-wide exploration Alliance. The Alliance ownership is 80% Adventus and 20% Salazar, and allows the Alliance Board, which is made up of Sam Leung and Jason Dunning of Adventus, and Fredy Salazar, to pick and choose what they feel are the highest potential projects, and bring them into the Alliance for exploration and development.
Pijili Project
The first project to be brought into the Alliance is the Pijili project, which was granted to Salazar by the Republic of Ecuador.
The Pijili project consists of 3 concessions totalling 3,246 hectares, and is located in the Ecuadorian province of Azuay. Its potential has been revealed only through the legally permitted artisanal mining which is currently taking place – exploration through modern techniques has yet to take place.
Artisanal miners are mining precious metals bearing structures via several small open pits and underground tunnels. Also, Salazar notes that there is visible evidence of copper mineralization along the walls of the small open pits.
In their most recent news release, Adventus announced the commencement of an airborne MobileMT geological survey of the Pijili and Santiago projects. As VP of Exploration, Jason Dunning, cites in the news release,
“MobileMT will greatly enhance drill hole targeting by defining high-priority targets for follow-up in early 2019. This is the first time there will be a deep penetrating, uniform dataset for Pijilí and Santiago projects that will allow us to more accurately visualize the geological and structural framework in 3D to define potentially prospective host rocks for intrusion-related mineralization.”
Pijili presents a blank slate for exploration, one that I believe holds a ton of mineral potential.
Santiago Project
The second project brought into the Alliance is the Santiago project, which is roughly 110 km west of Lundin’s Forte del Norte gold deposit. Santiago consists of a single concession, which covers an area of 2,350 hectares.
Unlike Pijili, Santiago has seen the use of modern exploration techniques, which has exposed a series of vein occurrences. The occurrences have yielded good reconnaissance chip sampling results. Here are a few highlights, which can be found on Salazar’s website and SEDAR.
Espanola Vein
2.0 m @ 28.1g/t Au and 231 g/t Ag
1.0 m @ 26.0 g/t Au and 242 g/t Ag
Quartz-Tourmaline Vein
1.9 m @1.19 g/t Au, 14.3 g/t Ag and 296 ppm Mo
3.3 m @ 0.59g/t Au, 36.6 g/t Ag and 390 ppm Mo
Ribs Zone and Ancha Vein
1 m @ 1.29 g/t Au and > 100 g/t Ag
1 m @1.65 g/t Au and > 100 g/t Ag
F.U. Structure
1.40 m @ 4.8 g/t Au and 378 g/t Ag
1.20 m @ 6.4 g/t Au and 136 g/t Ag
In addition to the chip samples, Santiago has seen historical drilling on the project by a previous operator, Newmont Mining Corporation.
The historical results are very intriguing as they exhibit characteristics of a Cu-Au porphyry system. I must, however, caution anyone from drawing any conclusions from these results as they are not confirmable – the drill core is unavailable.
Here are a few of the highlights, which can be found on SEDAR:
Hole FU 01 – Interval 0 to 323 m, 0.37 g/t Au, 0.23% Cu – 0.47% CuEq
Hole FU 02 – Interval 129 to 300 m, 0.5 g/t Au, 0.33% Cu – 0.66% CuEq
Hole FU 08 – Interval 0 to 300 m, 0.24 g/t Au, 0.11% Cu – 0.27% CuEq
As mentioned earlier, Adventus has announced an airborne MobileMT geological survey of Santiago, which will assist the exploration team in identifying the highest potential drill targets.
Personally, I will be watching for news from the airborne work and the targets that Adventus decides to pursue. In my opinion, there’s a lot of potential here.
#4 –Cash – In Adventus’ current corporate presentation, the company lists their cash position as $10 million, as of October 30th 2018. Given the current market dynamics, this is a great position to be in. Additionally, I might add, Adventus has enjoyed the uncanny ability to raise money through this bear market portion of the resource cycle, which I expect will continue in the future.
#5 – Downside Risk – Currently, as an investor of Adventus, I believe the biggest risk to my capital comes from the jurisdiction – Ecuador, for reasons I outlined in my article. While there’s risk of failure in exploration at Pijili and Santiago, I don’t see the stock price taking a big hit for failure. Given the MCAP and the value I assign to Adventus’ assets, I see little to no value assigned to exploration upside at Pijili or Santiago.
Furthermore, given Adventus’ cash position, their access to funds and the assets they hold under management, I believe the risk to reward potential presented by the exploration is fantastic.
Conclusion
The end of the year is upon us and with it typically comes a great opportunity to buy the best junior resource companies at a discount. While no one can predict the direction of a market with any consistency, buying the highest quality companies, with catalysts for share price appreciation, puts us, in my opinion, in the best possible position to profit.
To me, Adventus is one of those high quality companies that give the investor multiple avenues for success. First, you have their flagship Curipamba project, which should have an updated PEA early in the new year. Second, you have their high potential exploration projects, Pijili and Santiago, whose upside potential, in my opinion, hasn’t been factored into Adventus’ MCAP as of yet. Third, you have Adventus’ portfolio of Irish projects, for which they are actively looking to find a JV partner. Finally, you have Adventus’ large stake in Canstar Resources, who will be beginning their inaugural exploration program on their Newfoundland based projects next year.
I’m looking forward to 2019!
Don’t want to miss a new investment idea, interview or financial product review? Become a Junior Stock Review VIP now – it’s FREE!
Until next time,
Brian Leni P.Eng
Founder – Junior Stock Review
Disclaimer: The following is not an investment recommendation, it is an investment idea. I am not a certified investment professional, nor do I know you and your individual investment needs. Please perform your own due diligence to decide whether this is a company and sector that is best suited for your personal investment criteria. I do own shares in Adventus Zinc Corporation. All Adventus Zinc Corporation analytics were taken from their website and press release. I have NO business relationship with Adventus Zinc Corporation.
The junior gold miners’ stocks have been thrashed in August, plummeting to brutal multi-year lows. Such carnage naturally left sentiment far more bearish than usual in this forsaken contrarian sector. But these extremely-battered gold-stock prices certainly aren’t justified fundamentally. Junior gold miners’ collective results from their just-completed Q2’18 earnings season prove their stock prices need to mean revert way higher.
Four times a year publicly-traded companies release treasure troves of valuable information in the form of quarterly reports. Companies trading in the States are required to file 10-Qs with the US Securities and Exchange Commission by 45 calendar days after quarter-ends. Canadian companies have similar requirements. In other countries with half-year reporting, many companies still partially report quarterly.
The definitive list of elite “junior” gold stocks to analyze comes from the world’s most-popular junior-gold-stock investment vehicle. This week the GDXJ VanEck Vectors Junior Gold Miners ETF reported $4.5b in net assets. Among all gold-stock ETFs, that was second only to GDX’s $8.4b. That is GDXJ’s big-brother ETF that includes larger major gold miners. GDXJ’s popularity testifies to the great allure of juniors.
Unfortunately this fame created serious problems for GDXJ a couple years ago, resulting in a stealthy major mission change. This ETF is quite literally the victim of its own success. GDXJ grew so large in the first half of 2016 as gold stocks soared in a massive upleg that it risked running afoul of Canadian securities laws. And most of the world’s smaller gold miners and explorers trade on Canadian stock exchanges.
Since Canada is the center of the junior-gold universe, any ETF seeking to own this sector will have to be heavily invested there. But once any investor including an ETF buys up a 20%+ stake in any Canadian stock, it is legally deemed to be a takeover offer that must be extended to all shareholders! As capital flooded into GDXJ in 2016 to gain junior-gold exposure, its ownership in smaller components soared near 20%.
Obviously hundreds of thousands of investors buying shares in an ETF have no intention of taking over gold-mining companies, no matter how big their collective stakes. That’s a totally-different scenario than a single corporate investor buying 20%+. GDXJ’s managers should’ve lobbied Canadian regulators and lawmakers to exempt ETFs from that 20% takeover rule. But instead they chose an inferior, easier fix.
Since GDXJ’s issuer controls the junior-gold-stock index underlying its ETF, it simply chose to unilaterally redefine what junior gold miners are. It rejiggered its index to fill GDXJ’s ranks with larger mid-tier gold miners, while greatly demoting true smaller junior gold miners in terms of their ETF weightings. This controversial move defying long decades of convention was done quietly behind the scenes to avoid backlash.
There’s no formal definition of a junior gold miner, which gives cover to GDXJ’s managers pushing the limits. Major gold miners are generally those that produce over 1m ounces of gold annually. For decades juniors were considered to be sub-200k-ounce producers. So 300k ounces per year is a very-generous threshold. Anything between 300k to 1m ounces annually is in the mid-tier realm, where GDXJ now traffics.
That high 300k-ounce-per-year junior cutoff translates into 75k ounces per quarter. Following the end of the gold miners’ Q2’18 earnings season in mid-August, I dug into the top 34 GDXJ components’ results. That’s simply an arbitrary number that fits neatly into the tables below. Although GDXJ included a staggering 71 component stocks this week, the top 34 accounted for a commanding 81.1% of its total weighting.
Out of these top 34 GDXJ companies, only 4 primary gold miners met that sub-75k-ounce-per-quarter qualification to be a junior gold miner! Their quarterly production is rendered in blue below, and they collectively accounted for just 8.9% of GDXJ’s total weighting. But even that is really overstated, as 3 of these are long-time traditional major silver miners that are increasingly diversifying into gold in recent years.
GDXJ is inarguably now a pure mid-tier gold-miner ETF, and really ought to be advertised as such. While its holdings include some of the world’s best gold miners with huge upside potential, the great majority definitely aren’t classic junior gold miners. At least this ETF’s big composition changes are stabilizing, as Q2’18 was the first quarter since mid-2016 where GDXJ’s components didn’t radically change year-over-year.
I’ve been doing these deep quarterly dives into GDXJ’s top components for years now. In Q2’18, fully 32 of the top 34 GDXJ components were also GDX components! These are separate and distinct ETFs, a “Gold Miners ETF” and a “Junior Gold Miners ETF”. So they shouldn’t have to own many of the same companies. In the tables below I highlighted the symbols of rare GDXJ components not also in GDX in yellow.
These 32 GDX components accounted for 78.4% of GDXJ’s total weighting, not just its top 34. They also represented 38.0% of GDX’s total weighting. Thus nearly 4/5ths of this “Junior Gold Miners ETF” is made up by over 3/8ths of the major “Gold Miners ETF”! These GDXJ components also in GDX start at the 10th-highest weighting in that latter larger ETF and extend down to 47th. GDXJ is mostly smaller GDX stocks.
In a welcome change from GDXJ’s vast component turmoil of recent years, only 2 of its top 34 stocks are new since Q2’17. Their symbols are highlighted in light blue below. Thus the top GDXJ components’ collective results are finally getting comparable again in year-over-year terms. Analyzing ETFs is much easier if their larger components aren’t constantly in flux. Hopefully changes going forward are relatively minor.
Despite all this, GDXJ remains the leading “junior-gold” benchmark. So every quarter I wade through tons of data from its top components’ latest results, and dump it into a big spreadsheet for analysis. The highlights make it into these tables. Most of these top 34 GDXJ gold miners trade in the US and Canada, where comprehensive quarterly reporting is required by regulators. But others trade in Australia and the UK.
In these countries and most of the rest of the world, regulators only mandate that companies report their results in half-year increments. Some do still issue quarterly production reports, but don’t release financial statements. There are wide variations in reporting styles, data presented, and release timing. So blank fields in these tables mean a company hadn’t reported that particular data for Q2’18 as of this Wednesday.
The first couple columns of these tables show each GDXJ component’s symbol and weighting within this ETF as of this week. While most of these stocks trade on US exchanges, some symbols are listings from companies’ primary foreign stock exchanges. That’s followed by each gold miner’s Q2’18 production in ounces, which is mostly in pure-gold terms. That excludes byproduct metals often present in gold ore.
Those are usually silver and base metals like copper, which are valuable. They are sold to offset some of the considerable costs of gold mining, lowering per-ounce costs and thus raising overall profitability. In cases where companies didn’t separate out gold and lumped all production into gold-equivalent ounces, those GEOs are included instead. Then production’s absolute year-over-year change from Q2’17 is shown.
Next comes gold miners’ most-important fundamental data for investors, cash costs and all-in sustaining costs per ounce mined. The latter directly drives profitability which ultimately determines stock prices. These key costs are also followed by YoY changes. Last but not least the annual changes are shown in operating cash flows generated, hard GAAP earnings, sales, and cash on hand with a couple exceptions.
Percentage changes aren’t relevant or meaningful if data shifted from positive to negative or vice versa, or if derived from two negative numbers. So in those cases I included raw underlying data rather than weird or misleading percentage changes. This whole dataset together offers a fantastic high-level read on how the mid-tier gold miners are faring fundamentally as an industry. August’s plunge wasn’t righteous.
It was great to see GDXJ’s top 34 components almost unchanged from Q2’17, with only two new stocks in those ranks. My previous essays on GDXJ components’ quarterly results had been a sea of light blue since 2016. But one of the new components in Q2’18 is inexplicably the giant largely-African miner AngloGold Ashanti. It produced an enormous 805k ounces of gold last quarter, the largest in GDXJ by far.
Remember that major-gold-miner threshold has long been 1m+ ounces per year. AU’s production is annualizing to over 3x that, making this company the world’s 3rd-largest gold miner last quarter. Why on earth would managers running a “Junior Gold Miners ETF” even consider AngloGold Ashanti? It is as far from junior-dom as gold miners get. Having so many of the same stocks in both GDXJ and GDX is a big problem.
Such massive overlap between these two ETFs is a huge lost opportunity for VanEck. It owns and manages GDX, GDXJ, and even the MVIS indexing company that decides exactly which gold stocks are included in each. With one company in total control, there’s no need for any overlap in the underlying companies of what should be two very-different gold-stock ETFs. Inclusion ought to be mutually-exclusive.
VanEck could greatly increase the utility of its gold-stock ETFs and thus their ultimate success by starting with one big combined list of the world’s better gold miners. Then it could take the top 20 or 25 in terms of annual gold production and assign them to GDX. Based on Q2’18 production, that would run down near 127k or 92k ounces per quarter. Then the next-largest 30 or 40 gold miners could be assigned to GDXJ.
Getting smaller gold miners back into GDXJ would be a huge boon for the junior-gold-mining industry. Most investors naturally assume this “Junior Gold Miners ETF” owns junior gold miners, which is where they are trying to allocate their capital. But since most of GDXJ’s funds are instead diverted into much-larger mid-tiers and even some majors, the juniors are effectively being starved of capital intended for them.
That’s one of the big reasons smaller gold miners’ stock prices are so darned low. They aren’t getting enough capital inflows from gold-stock-ETF investing. So their share prices aren’t bid higher. They rely on issuing shares to finance their exploration projects and mine builds. But when their stock prices are down in the dumps, that is heavily dilutive. So GDXJ is strangling the very industry its investors want to own!
Back to these mid-tier gold miners’ Q2’18 results, production is the best place to start since that is the lifeblood of the entire gold-mining industry. These top 34 GDXJ gold miners that had specifically reported Q2 production as of the middle of this week produced 4467k ounces. That surged a massive 24.7% YoY, implying these miners are thriving. But that’s almost all driven by that huge 805k-ounce boost from AU’s inclusion.
Without AngloGold Ashanti which wasn’t there in Q2’17, the rest of the top 34 GDXJ gold miners saw their total production climb 2.2% YoY to 3662k ounces. That’s a little behind the 3.0% annual growth in overall global mine production in Q2’18 according to the World Gold Council’s latest Gold Demand Trends report. But these mid-tier miners are still faring far better than the majors that dominate that other GDX ETF.
As discussed last week in my essay on the GDX gold miners’ Q2’18 results, their production adjusted for quarterly data availability plunged a sharp 7.7% YoY! With big economically-viable gold deposits getting increasingly hard to discover, the majors are really struggling to replace depleting production. So much of the growth is coming from the mid-tiers and juniors, which will help their stock prices outperform the majors.
Starting from far-lower production bases, most of the smaller gold miners can ramp production by adding single new mines. These are often modest in scale and cost compared to the giant mines the majors need to target. Since growing production greatly boosts profits, investment capital will increasingly flow into mid-tier gold miners in coming years. So GDXJ’s upside should well outpace the major-dominated GDX’s.
For all GDXJ’s faults, it does still offer investors exposure to much-smaller gold miners. The average quarterly production of all the top 34 GDXJ miners reporting it in Q2 was 144.1k ounces. That is 44% smaller than the 258.3k averaged by the top 34 GDX miners last quarter. And again AU’s crazy inclusion really skews this. Ex-AU, the GDXJ average falls to 122.1k. That annualizes to 488k, solidly in the mid-tier realm.
With today’s set of top-34 GDXJ gold miners achieving relatively-good production growth, their costs per ounce should’ve declined proportionally. Higher production yields more gold to spread mining’s big fixed costs across. And lower per-ounce costs naturally lead to higher profits. So production growth is highly sought after by gold-stock investors, with companies able to achieve it commanding premium prices.
There are two major ways to measure gold-mining costs, classic cash costs per ounce and the superior all-in sustaining costs per ounce. Both are useful metrics. Cash costs are the acid test of gold-miner survivability in lower-gold-price environments, revealing the worst-case gold levels necessary to keep the mines running. All-in sustaining costs show where gold needs to trade to maintain current mining tempos indefinitely.
Cash costs naturally encompass all cash expenses necessary to produce each ounce of gold, including all direct production costs, mine-level administration, smelting, refining, transport, regulatory, royalty, and tax expenses. In Q2’18, these top 34 GDXJ-component gold miners that reported cash costs averaged $631 per ounce. That was actually up a slight 0.5% YoY, contrary to what you’d expect with higher production.
The majority of reporting gold miners saw cash costs rise significantly last quarter. There were plenty of challenges at various individual mines, including unexpected downtimes and lower ore grades. Both of those yield fewer ounces to bear the burden of gold mining’s big fixed costs. General price inflation is also mounting thanks to the trillions of dollars of money central banks conjured out of thin air over the past decade.
$631 per ounce is still very healthy, not much worse than the GDX majors’ average of $610 last quarter. That means these elite mid-tier gold miners could temporarily weather gold prices way down into the mid-$600s and still keep their mines running! At worst in mid-August, gold plunged to $1174 on close driven by epic all-time-record gold-futures short selling. Gold had fallen 4.1% month-to-date by that point, a big loss.
But the GDXJ gold miners suffered disproportionally, with this ETF’s price plummeting 15.5% MTD in sympathy with gold! That 3.8x downside leverage was excessive, the result of irrational herd sentiment. GDXJ’s share price was crushed to a brutal 2.4-year low, implying these miners are in fundamental peril. But with gold still trading a whopping 86% above their cash costs even at recent lows, that clearly wasn’t the case.
Way more important than cash costs are the far-superior all-in sustaining costs. They were introduced by the World Gold Council in June 2013 to give investors a much-better understanding of what it really costs to maintain gold mines as ongoing concerns. AISCs include all direct cash costs, but then add on everything else that is necessary to maintain and replenish operations at current gold-production levels.
These additional expenses include exploration for new gold to mine to replace depleting deposits, mine-development and construction expenses, remediation, and mine reclamation. They also include the corporate-level administration expenses necessary to oversee gold mines. All-in sustaining costs are the most-important gold-mining cost metric by far for investors, revealing gold miners’ true operating profitability.
These top 34 GDXJ gold miners reporting AISCs saw them average $886 per ounce in Q2’18. That was also up a modest 0.9% YoY, so costs didn’t decline proportionally with rising production. Still $886 is an excellent level compared to prevailing gold prices, and competitive with the GDX majors which averaged $856 last quarter. $886 is right in line with the past four quarters’ trend of $879, $877, $855, and $923 too.
The fundamental implications of this are very bullish, proving that this month’s gold-stock capitulation was purely an overdone herd-sentiment thing. Gold averaged $1306 in Q2’18, up 3.9% YoY. That means the top GDXJ gold miners were earning average profits just under $420 per ounce. Thanks to AISCs mostly holding the line and modestly-higher gold prices, those earnings rose a solid 10.7% YoY from $379 in Q2’17.
With gold mining considerably more profitable last quarter than a year earlier, you’d think the gold-stock prices would’ve been proportionally higher. Yet GDXJ’s average price in Q2 still slipped 1.1% lower YoY, which makes no sense fundamentally. And even if August’s capitulation-grade $1175 gold was able to magically persist as if those crazy-record gold-futures shorts were never covered, gold mining is still very profitable.
At Q2’18’s average AISCs which are again right in line with recent years’ levels, $1175 gold would still yield hefty $289-per-ounce profits for the mid-tier gold miners. Those don’t justify deep multi-year lows in gold-stock prices. And these profits will balloon dramatically as gold inevitably mean reverts much higher. Extreme gold-futures short-covering buying is imminent, and will be proportional to August’s record shorting.
The impact of higher gold prices on mid-tier-gold-miner profitability is easy to model. Assuming flat all-in sustaining costs at Q2’s $886 per ounce, 10%, 20%, and 30% gold rallies from mid-August’s lows would lead to collective gold-mining profits surging 40%, 81%, and 122%! And another 30% gold upleg isn’t a stretch at all. In the first half of 2016 alone after the first stock-market corrections in years, gold soared 29.9%.
GDXJ skyrocketed 202.5% higher in 7.0 months in largely that same span! Gold-mining profits and thus gold-stock prices surge dramatically when gold is powering higher. Years of neglect from investors have forced the gold miners to get lean and efficient, which will really amplify their fundamental upside during the next major gold upleg. The investors and speculators who buy in early and cheap could earn fortunes.
As long as the gold miners can produce gold at all-in sustaining costs way below prevailing gold prices, they will generate big profits for investors. Eventually their stock-price levels have to reflect their true underlying profitability. With $1175+ gold and $886 AISCs, the mid-tier gold miners’ stocks must mean revert way higher. Their extreme low levels today are fundamentally absurd, they can’t and won’t last for long.
With GDXJ’s radical composition changes finally settling down, the rest of its top 34 components’ core fundamentals are finally comparable year-over-year again. It’s nice to have that massive rejiggering in GDXJ’s underlying index past us. These elite mid-tier miners’ total revenues climbed 9.3% YoY to $5558m, well outpacing gold’s 3.9% YoY gain. That 2.2% higher production excluding AngloGold Ashanti also helped.
Those sales helped generate cash flows from operations of $1384m. While 5.1% lower YoY, that is still massively positive for this small contrarian sector. As long as gold mines are yielding far more cash than they cost to run, the mid-tier gold miners remain fundamentally healthy. Positive cash flows build capital necessary to expand operations, and helped drive these miners’ cash war chests up 9.3% YoY to $6784m in Q2.
But their hard GAAP profits as reported to regulators collectively looked terrible, collapsing from a strong $751m in Q2’17 to a big $146m loss in Q2’18! Is that the fundamental monkey wrench justifying these wretched stock-price levels? Not at all, as big unusual items flushed through bottom lines can make profits comparisons very misleading. There were two huge non-recurring items that mostly drove this big swing.
A year ago in Q2’17, elite mid-tier miner IAMGOLD reported a colossal $524m one-time non-cash gain from the reversal of mine-impairment charges. That accounted for nearly 70% of the top 34 GDXJ gold miners’ overall profits that quarter! Without that unusual item, their total Q2’17 profits were just $227m. Another unusual item heavily skewed last quarter’s latest profits, coming from mid-tier gold miner New Gold.
Gold mining is very challenging and risky, with many problems not evident until mining is well underway. New Gold’s serious troubles illustrate why diversifying capital across multiple gold miners is essential for all contrarian investors. NGD’s young Rainy River gold mine isn’t living up to potential due to variability in ore grades and processing. So in late July NGD slashed Rainy River’s 2018 production outlook by a huge 30%!
Not only did NGD’s stock crater, but this Rainy River situation is so bad New Gold recorded a $282m impairment charge on that mine! Such unusual non-recurring items flow directly into profits. Without that New Gold disaster, the top 34 GDJX gold miners’ total GAAP earnings in Q2’18 were $136m. While still down a major 40.2% YoY, that $91m drop is a fraction the size of the $897m including those unusual items.
The mid-tier gold miners’ recently-reported solid-to-strong Q2’18 results prove that their brutal plunge in August wasn’t fundamentally righteous. Like all capitulations fueled by cascading stop-loss selling, it was merely a sentimental and technical thing. As gold surges on the record futures short-covering buying that is imminent, the battered gold stocks will mean revert dramatically higher. And the mid-tiers will lead the way.
While GDXJ should certainly no longer be advertised as a “Junior Gold Miners ETF”, it offers exposure to some of the best mid-tier gold miners on the planet. It’s really growing on me, I like this new GDXJ way better than GDX. That being said, GDXJ is still burdened by overdiversification and way too many gold miners that shouldn’t be in there. They are either too large, are saddled with inferior fundamentals, or both.
So the best way to play the gold miners’ coming massive mean-reversion bull is in individual stocks with superior fundamentals. Their gains will ultimately trounce the major ETFs like GDXJ and GDX. There’s no doubt carefully-handpicked portfolios of elite gold and silver miners will generate much-greater wealth creation. GDXJ’s component list is a great starting point, but pruning it way down offers far-bigger upside.
At Zeal we’ve literally spent tens of thousands of hours researching individual gold stocks and markets, so we can better decide what to trade and when. As of the end of Q2, this has resulted in 1012 stock trades recommended in real-time to our newsletter subscribers since 2001. Fighting the crowd to buy low and sell high is very profitable, as all these trades averaged stellar annualized realized gains of +19.3%!
The key to this success is staying informed and being contrarian. That means buying low when others are scared, before undervalued gold stocks soar much higher. An easy way to keep abreast is through our acclaimed weekly and monthly newsletters. They draw on my vast experience, knowledge, wisdom, and ongoing research to explain what’s going on in the markets, why, and how to trade them with specific stocks. Subscribe today and take advantage of our 20%-off summer-doldrums sale! We’re redeploying stopped capital in new gold-stock trades at extreme fire-sale prices.
The bottom line is the mid-tier gold miners reported solid-to-strong fundamentals in their recent Q2’18 results. They were able to modestly grow their production despite the majors’ falling rather sharply. More gold mined combined with essentially-flat costs and higher average gold prices fueled solid profits growth. The mid-tiers’ production costs were far below prevailing gold prices even at mid-August’s deep capitulation lows.
That gold plunge that dragged gold stocks sharply lower was driven by crazy-all-time-record gold-futures short selling. Those extreme positions must soon be closed with proportional buying, which will catapult gold sharply higher. With gold-stock prices trading at such fundamentally-absurd levels today, they ought to soar and really leverage gold’s coming mean-reversion gains. Their post-capitulation upside is huge.
A few weeks ago we wrote that it may not be Gold’s time yet but a few recent developments suggest its time could be sooner than we anticipated. Although Gold failed to breakout last week, we should note the positive action in the miners. Over the past seven trading days the miners have strongly outperformed Gold. That includes the juniors, which appear very close to breaking out of the downtrend that has been in effect for over 12 months.
In the chart below we plot the three major junior ETFs: GDXJ, GOEX (explorers) and SILJ (silver juniors). The juniors have trended lower since February 2017 but are now threatening to break trendline resistance. Since December 2017 the juniors have traded in an increasingly tighter and tighter range which indicates a break is coming very soon. Also, note how the 200-day moving averages are flat and no longer sloping lower. That reflects a mature correction and the potential for a new uptrend if the juniors break above resistance in a strong fashion.
GDXJ, GOEX, SILJ Daily Bar Charts
There are a few other things worth mentioning.
First, as we alluded to, GDXJ has strongly outperformed Gold over the past seven trading days. The GDXJ to Gold ratio has reached its highest mark since the start of February. That sudden relative strength is significant considering Gold is within spitting distance of a major breakout.
Second, one custom breadth indicator we track is the percentage of juniors (a basket of 50 stocks) trading above the 200-day moving average. This figure (currently 42%) has not exceeded 51% since February 2017. A strong push above 51% could confirm a renewed uptrend in the juniors.
If juniors are going to break out of their downtrends, it could mark the start of potentially a very large move. Gold, upon a breakout through $1375, will have a measured upside target of roughly $1700/oz. Although the juniors aren’t very close to breaking their 2016 high, they, upon a breakout would have similar upside potential. GDXJ, upon a breakout through $50 would have a measured upside target of $83.
GDXJ & Gold Necklines
That potential measured upside target for GDXJ may seem extreme but for juniors its par for the course. Below we show an updated chart of our Junior Gold Stocks Bull Analog. By my data, juniors are well below where they were during the 2001-2007 and 2008-2011 bull markets. So if Gold breaks higher and is going to reach $1700/oz then juniors are likely to catch up to historical performance.
TDG Junior Gold Stocks Bull Analog
Although Gold failed to breakout (again) last week, the performance in the gold stocks did not confirm that failure. The newfound relative strength, if sustained over the next few weeks could signal that a sector breakout is much closer than previously anticipated. The juniors are very close to breaking their downtrend and that break could only be the start of a potentially massive move. In anticipation of that potential move, we have been accumulating the juniors that have 300% to 500% upside potential over the next 18-24 months. To follow our guidance and learn our favorite juniors, consider learning more about our premium service.
Sitting in one of the most prolific mining camps, there is a company that has been aggressively expanding its resources through good times and bad. Now with renewed interest in gold mining projects, it is time to look at teams and resources that have weathered the storm and learned discipline to advance their project with current drilling underway.
Bonterra Resources Inc. (BTR: TSX-V) ( BONXF: US) (9BR:FSE) is one such company that exemplifies determination and dedication to their deposit. Bonterra is a Canadian gold exploration company focused on expanding its NI 43-101 compliant gold resource on its properties in the Abitibi Greenstone Belt in the mining-friendly jurisdiction of Quebec.
The company is currently drilling at its 10,541-hectare Gladiator Project. The drill program comprises over 50,000 meters utilizing a minimum of four drill rigs. Using a 4 g/t Au cut-off grade, the project currently contains an inferred resource of 905,000 tonnes, grading 9.37 g/t Au for 273,000 ounces of gold according to a Mineral Resource Estimate and technical report filed July 27, 2012, prepared by Snowden Mining Consultants. The company plans on completing 70,000 metres of drilling this year. With this drilling, expect the resource to expand when the company puts out its updated NI 43-101 Mineral Resource Estimate in mid-2018
Recent drilling from Gladiator has impressed the market by reaching a year high of 72 cents. On Dec. 12, 2017, the company released drill results of 18.5 g/t Au over 4.0 m and 11.9 g/t Au over 3.2 m in the south zone which increased and further defined the size of the high-grade core area. Holes BA-17-42A and BA-17-48 improved the definition of the high-grade core of the footwall zone, with significant grade and width in hole BA-17-48, which intersected 10.1 g/t Au over 6.3 m. Holes BA-17-42, BA-17-43B and BA-17-46 confirmed the eastern continuity of the north zone, with an intersection of 9.6 g/t Au over 3.0 m. This recent drilling also extends the north zone down plunge to the east. Results from these seven recent drill holes have expanded the size and demonstrate the continuity of the north, footwall and south zones.
According to Dale Ginn, vice-president of exploration: “Drill results from Gladiator continue to demonstrate superior widths and grades in all five of our defined zones to date. These mineralized zones are not only visible with sharp contacts, but are continuous and highly predictable. Stand-alone high-grade gold deposits in Canada, especially with extensive infrastructure and easy access, are extremely rare and valuable and we look forward to demonstrating that Gladiator is among that class.”
The company can follow up on these results year round and access some of the more difficult ground with the recent upgrade to its camp to an all-season exploration camp at the Gladiator gold project. The expansion to a larger year-round exploration camp will help advance the company during at time when most explorers are taking time off and their share prices are dropping due to lack of activity. Furthermore, drilling in the winter firms up the ground and allows for improved access and drilling.
Ginn stated, “The expansion and construction of a year-round camp provides the key infrastructure required to ensure we execute our resource development program at the Gladiator gold project on budget and on time to meet the market’s expectations of a mineral resource update in 2018.”
Bonterra plans to mobilize two additional drills (totalling six) in early 2018 for a winter drilling campaign. In an interview with Jay Talyor, President Nav Dhaliwhal stated that they have about $8 to $10 million to spend on the winter campaign.
The Gladiator project has good neighbors with deep pockets and active projects on the go. In addition to good ground and neighbors, the company has a solid shareholder base with Eric Sprott holding 10%, Van Eck Gold Fund with 12% and Kirkland Lake Gold with 9.5%. The company has a cash position of $24,554,809 CAD as of its August 31, 2017 financials. The company has never been in a better cash position.
Ian Telfer once said that he invests in projects that have management who have an unshakable faith in their deposits. Bonterra has demonstrated this faith by weathering one of the longest bear markets for gold; not just weathering the storm, but advancing its project and growing the resource. With depressed gold prices, winter drilling to support share price and prove up the property, and an upcoming resource estimate due in mid-2018, right now presents an attractive entry point for investors to consider acquiring shares.
*Bonterra Resources Inc. is an advertiser with MiningFeeds.com. MiningFeeds was compensated for the creation and distribution of this article. MiningFeeds was paid a fee and does not hold any shares in Bonterra Resources. This is for informational purposes only and should not construed as investment advice.
The junior gold miners’ stocks have spent months grinding sideways near lows, sapping confidence and breeding widespread bearishness. The entire precious-metals sector has been left for dead, eclipsed by the dazzling Trumphoria stock-market rally. But traders need to keep their eyes on the fundamental ball so herd sentiment doesn’t mislead them. The juniors recently reported Q3 earnings, and enjoyed strong results.
Four times a year publicly-traded companies release treasure troves of valuable information in the form of quarterly reports. Companies trading in the States are required to file 10-Qs with the US Securities and Exchange Commission by 45 calendar days after quarter-ends. Canadian companies have similar requirements. In other countries with half-year reporting, many companies still partially report quarterly.
The definitive list of elite junior gold stocks to analyze used to come from the world’s most-popular junior-gold-stock investment vehicle. This week the GDXJ VanEck Vectors Junior Gold Miners ETF reported $4.4b in net assets. Among all gold-stock ETFs, that was only second to GDX’s $8.1b. That is GDXJ’s big-brother ETF that includes larger major gold miners. GDXJ’s popularity testifies to the great allure of juniors.
Unfortunately this fame has recently created major problems severely hobbling the usefulness of GDXJ. This sector ETF has shifted from being beneficial for junior gold miners to outright harming them. GDXJ is literally advertised as a “Junior Gold Miners ETF”. Investors only buy GDXJ shares because they think this ETF gives them direct exposure to junior gold miners’ stocks. But unfortunately that’s no longer true!
GDXJ is quite literally the victim of its own success. This ETF grew so large in the first half of 2016 as gold stocks soared in a massive upleg that it risked running afoul of Canadian securities law. Most of the world’s junior gold miners and explorers trade in Canada. In that country once any investor including an ETF goes over 20% ownership in any stock, it is deemed a takeover offer that must be extended to all shareholders!
Understanding what happened in GDXJ is exceedingly important for junior-gold-stock investors, and I explained it in depth in my past essay on juniors’ Q1’17 results. GDXJ’s managers were forced to reduce their stakes in leading Canadian juniors. So capital that GDXJ investors intended to deploy in junior gold miners was instead diverted into much-larger gold miners. GDXJ’s effective mission stealthily changed.
Not many are more deeply immersed in the gold-stock sector than me, as I’ve spent decades studying, trading, and writing about this contrarian realm. These huge GDXJ changes weren’t advertised, and it took even me months to put the pieces together to understand what was happening. GDXJ’s managers may have had little choice, but their major direction change has been devastating to true junior gold miners.
Investors naturally pour capital into GDXJ, the “Junior Gold Miners ETF”, expecting to own junior gold miners. But instead of buying junior gold miners’ shares and bidding up their prices, GDXJ is instead shunting those critical inflows to the much-larger mid-tier and even major gold miners. That left the junior gold miners starved of capital, as their share prices they rely heavily upon for financing languished in neglect.
GDXJ’s managers should’ve lobbied Canadian regulators and lawmakers to exempt ETFs from that 20% takeover rule. Hundreds of thousands of investors buying an ETF obviously have no intention of taking over gold-mining companies! And higher junior-gold-stock prices boost the Canadian economy, helping these miners create valuable high-paying jobs. But GDXJ’s managers instead skated perilously close to fraud.
This year they rejiggered their own index underlying GDXJ, greatly demoting most of the junior gold miners! Investors buying GDXJ today are getting very-low junior-gold-miner exposure, which makes the name of this ETF a deliberate deception. I’ve championed GDXJ for years, it is a great idea. But in its current sorry state, I wouldn’t touch it with a ten-foot pole. It is no longer anything close to a junior-gold-miners ETF.
There’s no formal definition of a junior gold miner, which gives cover to GDXJ’s managers pushing the limits. Major gold miners are generally those that produce over 1m ounces of gold annually. For years juniors were considered to be sub-200k-ounce producers. So 300k ounces per year is a very-generous threshold. Anything between 300k to 1m ounces annually is in the mid-tier realm, where GDXJ now traffics.
That high 300k-ounce-per-year junior cutoff translates into 75k ounces per quarter. Following the end of the gold miners’ Q3 earnings season in mid-November, I dug into the top 34 GDXJ components. That’s just an arbitrary number that fits neatly into the tables below. While GDXJ included a staggering 73 component stocks in mid-November, the top 34 accounted for a commanding 81.1% of its total weighting.
Out of these top 34 GDXJ companies, only 5 primary gold miners met that sub-75k-ounces-per-quarter qualification to be a junior gold miner! Their quarterly production is highlighted in blue below, and they collectively accounted for just 7.1% of GDXJ’s total weighting. But even that isn’t righteous, as these include a 126-year-old silver miner and a mid-tier gold miner suffering temporary production declines.
GDXJ is inarguably now a pure mid-tier gold-miner ETF. That’s great if GDXJ is advertised as such, but terrible if capital investors explicitly intend for junior gold miners is instead being diverted into mid-tiers without their knowledge or consent. The vast majority of GDXJ shareholders have no idea how radically this ETF has changed since early 2016. It is all but unrecognizable, straying greatly from its original mission.
I’ve been doing these deep quarterly dives into GDXJ’s top components for years now. In Q3’17, fully 32 of the top 34 GDXJ components were also GDX components! These ETFs are separate, a “Gold Miners ETF” and a “Junior Gold Miners ETF”. So why on earth should they own many of the same companies? In the tables below I highlighted the rare GDXJ components not also in GDX in yellow in the weightings column.
These 32 GDX components accounted for 78.7% of GDXJ’s total weighting, not just its top 34. They also represented 31.4% of GDX’s total weighting. So almost 4/5ths of the junior gold miners’ ETF is made up of nearly a third of the major gold miners’ ETF! I’ve talked with many GDXJ investors over the years, and have never heard one wish their capital allocated specifically to junior golds would instead go to much-larger miners.
Fully 10 of GDXJ’s top 17 components weren’t even in this ETF a year ago in Q3’16. They alone now account for 34.5% of its total weighting. 16 of the top 34 are new, or 44.4% of the total. In the tables below, I highlighted the symbols of companies that weren’t in GDXJ a year ago in light blue. Today’s GDXJ is a radical departure from last year. Analyzing Q3’17 results largely devoid of real juniors is frustrating.
Nevertheless, GDXJ remains the leading “junior-gold” benchmark. So every quarter I wade through tons of data from its top components’ 10-Qs, and dump it into a big spreadsheet for analysis. The highlights made it into these tables. A blank field means a company didn’t report that data for Q3’17 as of that mid-November 10-Q deadline. Companies have wide variations in reporting styles, data presented, and report timing.
In these tables the first couple columns show each GDXJ component’s symbol and weighting within this ETF as of mid-November. While most of these gold stocks trade in the States, not all of them do. So if you can’t find one of these symbols, it’s a listing from a company’s primary foreign stock exchange. That’s followed by each company’s Q3’17 gold production in ounces, which is mostly reported in pure-gold terms.
Many gold miners also produce byproduct metals like silver and copper. These are valuable, as they are sold to offset some of the considerable costs of gold mining. Some companies report their quarterly gold production including silver, a construct called gold-equivalent ounces. I only included GEOs if no pure-gold numbers were reported. That’s followed by production’s absolute year-over-year change from Q3’16.
Next comes the most-important fundamental data for gold miners, cash costs and all-in sustaining costs per ounce mined. The latter determines their profitability and hence ultimately stock prices. Those are also followed by YoY changes. Finally the YoY changes in cash flows generated from operations, GAAP profits, revenues, and cash on balance sheets are listed. There’s one key exception to these YoY changes.
Percentage changes aren’t relevant or meaningful if data shifted from negative to positive or vice versa. Plenty of GDXJ gold miners that earned profits in Q3’16 suffered net losses in Q3’17. So in cases where data crossed that zero line, I included the raw numbers instead. This whole dataset offers a fantastic high-level fundamental read on how the mid-tier gold miners are faring today, and they’re actually doing quite well.
After spending days digesting these GDXJ gold miners’ latest quarterly reports, it’s fully apparent their vexing consolidation this year isn’t fundamentally righteous at all! Traders have abandoned this sector since the election because the allure of the levitating general stock markets has eclipsed gold. That has left gold stocks exceedingly undervalued, truly the best fundamental bargains out there in all the stock markets!
Once again the light-blue-highlighted symbols are new GDXJ components that weren’t included a year ago in Q3’16. And the meager yellow-highlighted weightings are the only stocks that were not also GDX components in mid-November! GDXJ is increasingly a GDX clone that offers little if any real exposure to true gold juniors’ epic upside potential during gold bulls. GDXJ has become a shadow of its former self.
VanEck owns and manages GDX, GDXJ, and the MVIS indexing company that decides exactly which gold stocks are included in each. With one company in total control, GDX and GDXJ should have zero overlap in underlying companies! GDX or GDXJ inclusion should be mutually-exclusive based on the size of individual miners. That would make both GDX and GDXJ much more targeted and useful for investors.
Two of GDXJ’s heaviest-weighted component choices are mystifying. Sibanye Gold and Gold Fields are major South African gold miners, way bigger than mid-tier status and about as far from junior-dom as you can get. In Q3’17 they both mined way in excess of that 250k-ounce quarterly threshold that is definitely major status. They are among the world’s largest gold miners, so it’s ludicrous to have them in a juniors ETF.
Since gold miners are in the business of wresting gold from the bowels of the Earth, production is the best place to start. These top 34 GDXJ gold miners collectively produced 4352k ounces in Q3’17. That rocketed 121% higher YoY, but that comparison is meaningless given the radical changes in this ETF’s composition since Q3’16. On the bright side, GDXJ’s miners do still remain significantly smaller than GDX’s.
GDX’s top 34 components, fully 20 of which are also top-34 GDXJ components, collectively produced 9947k ounces of gold in Q3. So GDXJ components’ average quarterly gold production of 136k ounces excluding explorers was 55% lower than GDX components’ 301k average. In spite of GDXJ’s very-misleading “Junior” name, it definitely has smaller gold miners even if they’re well above that 75k junior threshold.
Despite GDXJ’s top 34 components looking way different from a year ago, these current gold miners are faring well on the crucial production front. Fully 22 of these mid-tier gold miners enjoyed big average YoY production growth of 18%! Overall average growth excluding explorers was 8.2% YoY, which is far better than world mine production which slumped 1.3% lower YoY in Q3’17 according to the World Gold Council.
These elite GDXJ mid-tier gold miners are really thriving, with production growth way outpacing their industry. That will richly reward investors as sentiment normalizes. Smaller mid-tier gold miners able to grow production are the sweet spot for stock-price upside potential. With market capitalizations much lower than major gold miners, investment capital inflows are relatively larger which bids up stock prices faster.
With today’s set of top-34 GDXJ gold miners achieving such impressive production growth, their costs per ounce should’ve declined proportionally. Higher production yields more gold to spread mining’s big fixed costs across. And lower per-ounce costs naturally lead to higher profits. So production growth is highly sought after by gold-stock investors, with companies able to achieve it commanding premium prices.
There are two major ways to measure gold-mining costs, classic cash costs per ounce and the superior all-in sustaining costs per ounce. Both are useful metrics. Cash costs are the acid test of gold-miner survivability in lower-gold-price environments, revealing the worst-case gold levels necessary to keep the mines running. All-in sustaining costs show where gold needs to trade to maintain current mining tempos indefinitely.
Cash costs naturally encompass all cash expenses necessary to produce each ounce of gold, including all direct production costs, mine-level administration, smelting, refining, transport, regulatory, royalty, and tax expenses. In Q3’17, these top-34 GDXJ-component gold miners that reported cash costs averaged just $612 per ounce. That indeed plunged a major 6.9% YoY from Q3’16, and even 2.5% QoQ from Q2’17.
This was really quite impressive, as the mid-tier gold miners’ cash costs were only a little higher than the GDX majors’ $591. That’s despite the mid-tiers each operating fewer gold mines and thus having fewer opportunities to realize cost efficiencies. Traders must recognize these mid-sized gold miners are in zero fundamental peril as long as prevailing gold prices remain well above cash costs. And $612 gold ain’t happening!
Way more important than cash costs are the far-superior all-in sustaining costs. They were introduced by the World Gold Council in June 2013 to give investors a much-better understanding of what it really costs to maintain a gold mine as an ongoing concern. AISC include all direct cash costs, but then add on everything else that is necessary to maintain and replenish operations at current gold-production levels.
These additional expenses include exploration for new gold to mine to replace depleting deposits, mine-development and construction expenses, remediation, and mine reclamation. They also include the corporate-level administration expenses necessary to oversee gold mines. All-in sustaining costs are the most-important gold-mining cost metric by far for investors, revealing gold miners’ true operating profitability.
In Q3’17, these top 34 GDXJ components reporting AISC averaged just $877 per ounce. That’s down a sharp 3.7% YoY and 0.2% QoQ. That also compares very favorably with the GDX majors, which saw nearly-identical average AISC at $868 in Q3. The mid-tier gold miners’ low costs prove they are faring far better fundamentally today than traders think based on this year’s vexing sideways-grinding stock-price action.
All-in sustaining costs are effectively this industry’s breakeven level. As long as gold stays above $877 per ounce, it remains profitable to mine. At Q3’s average gold price of $1279, these top GDXJ gold miners were earning big average profits of $402 per ounce last quarter! That equates to hefty profit margins of 31%, levels most industries would kill for. The mid-tier gold miners aren’t getting credit for that today.
Unfortunately given its largely-junior-less composition, GDXJ remains the leading benchmark for junior gold miners. In Q3’17, GDXJ averaged $33.81 per share. That was down a serious 28.6% from Q3’16’s average of $47.38. Investors have largely abandoned gold miners because they are captivated by the extreme Trumphoria stock-market rally since the election. Yet gold-mining profits certainly didn’t justify this.
A year ago in Q3’16, the top 34 GDXJ components at that time reported average all-in sustaining costs of $911 per ounce. With gold averaging $1334 then which was 4.4% higher, that implies the mid-tier gold miners were running operating profits of $423 per ounce. Thus Q3’17’s $402 merely slumped 5.0% YoY, which definitely isn’t worthy of hammering mid-tier gold miners’ stock prices over a quarter lower over the past year.
Gold miners offer such compelling investment opportunities because of their inherent profits leverage to gold. Gold-mining costs are largely fixed during mine-planning stages, when engineers and geologists decide which ore to mine, how to dig to it, and how to process it. The actual mining generally requires the same levels of infrastructure, equipment, and employees quarter after quarter regardless of gold prices.
With gold-mining costs essentially fixed, higher or lower gold prices flow directly through to the bottom line in amplified fashion. That wasn’t really apparent in GDXJ over this past year since its composition changed so radically. Normally a 4.2% drop in average gold prices would lead to much more than a 5.0% YoY operating-profit decline. Gold-stock profits generally leverage gold price moves by several times.
Gold itself is overdue for a major new upleg driven by investment demand returning. As I discussed several weeks ago, investment demand has stalled thanks to the extreme stock-market euphoria. These bubble-valued stock markets are due to roll over imminently as the Fed and European Central Bank both start aggressively choking off liquidity. That will strangle this stock bull, reigniting big gold investment demand.
The impact of higher gold prices on mid-tier-gold-miner profitability is easy to model. Assuming flat all-in sustaining costs at Q3’17’s $877 per ounce, 10%, 20%, and 30% gold rallies from this week’s levels will lead to collective gold-mining profits surging 36%, 68%, and 100%! And another 30% gold upleg isn’t a stretch at all. In essentially the first half of 2016 alone after the last stock-market correction, gold surged 29.9%.
The major gold stocks as measured by the HUI, which closely mirrors GDX, skyrocketed 182.2% higher in roughly that same span! Gold-mining profits and thus gold-stock prices soar when gold is powering higher. So if you believe gold is heading higher in coming quarters as these crazy stock markets falter, the gold stocks are screaming buys today fundamentally. That’s especially true of the best mid-tier gold miners.
Since today’s bastardized GDXJ mostly devoid of juniors changed so radically since last year, the normal year-over-year comparisons in key financial results aren’t comparable. But here they are for reference. These top 34 GDXJ companies’ cashflows generated from operations soared 65% YoY to $1515m. That was driven by sales up 96% YoY to $4130m. That left miners’ collective cash balances $28% higher YoY at $5672m.
Yet top-34-GDXJ-component profits crumbled 38% YoY to $212m. Again don’t read too much into this since it’s an apples-to-oranges comparison. Interestingly a single company that was in GDXJ in both quarters is responsible for over 2/3rds of that drop. Endeavour Mining’s earnings plunged from +$24m a year ago to -$65m in Q3’17, largely due to a $54m impairment charge in its Nzema mine which is being sold.
GDXJ’s component list was much more consistent between Q2’17 and Q3’17. QoQ these top 34 GDXJ gold miners saw operating cash flows rise 3.9%, sales surge 7.5%, cash on hand fall 7.6%, and profits plummet 72%. Again an anomaly in a single company is responsible for nearly 9/10ths of this sequential decline. In Q2 IAMGOLD reported a gigantic $524m non-cash gain on the reversal of an impairment charge!
The massive non-cash gains and losses flushed through net income are one reason why all-in sustaining costs offer a better read on gold-miner health. If GDXJ’s component list and weightings finally stabilize after this past year’s extreme tumult, we’ll have clean comps again next year. For now these mid-tier gold miners are generally doing far better operationally than their neglected super-low stock prices imply.
So overall the mid-tier gold miners’ fundamentals looked quite impressive in Q3’17, a stark contrast to the miserable sentiment plaguing this sector. Gold stocks’ vexing consolidation this year wasn’t the result of operational struggles, but purely bearish psychology. That will soon shift as the stock markets roll over and gold surges, making the beaten-down gold stocks a coiled spring today. They are overdue to soar again!
Though this contrarian sector is widely despised now, it was the best-performing in all the stock markets last year despite that sharp post-election selloff in Q4. The HUI blasted 64.0% higher in 2016, trouncing the S&P 500’s mere 9.5% gain! Similar huge 50%+ gold-stock gains are likely again in 2018, as gold mean reverts higher on the coming stock-market selloff. The gold miners’ strong Q3 fundamentals prove this.
Given GDXJ’s serious problems, leading to diverting most of its capital inflows into larger gold miners that definitely aren’t juniors, you won’t find sufficient junior-gold exposure in this troubled ETF. Instead traders should prudently deploy capital in the better individual mid-tier and junior gold miners’ stocks with superior fundamentals. Their upside is vast, and would trounce GDXJ’s even if it was still working as advertised.
At Zeal we’ve literally spent tens of thousands of hours researching individual gold stocks and markets, so we can better decide what to trade and when. As of the end of Q3, this has resulted in 967 stock trades recommended in real-time to our newsletter subscribers since 2001. Fighting the crowd to buy low and sell high is very profitable, as all these trades averaged stellar annualized realized gains of +19.9%!
The key to this success is staying informed and being contrarian. That means buying low when others are scared, like late in this year’s vexing consolidation. An easy way to keep abreast is through our acclaimed weekly and monthly newsletters. They draw on my vast experience, knowledge, wisdom, and ongoing research to explain what’s going on in the markets, why, and how to trade them with specific stocks. Easy to read and affordable, they’ll help you learn to think, trade, and thrive like contrarians. Subscribe today, and get deployed in the great gold stocks on our trading books before they surge far higher!
The bottom line is the mid-tier gold miners now dominating GDXJ enjoyed strong fundamentals in their recently-reported Q3 results. While GDXJ’s radical composition changes since last year muddy annual comparisons, today’s components mined lots more gold at lower costs. These gold miners continued to earn hefty operating profits while generating strong cash flows. Sooner or later stock prices must reflect fundamentals.
As gold itself continues mean reverting higher, these mid-tier gold miners will see their profits soar due to their big inherent leverage to gold. GDXJ now offers excellent exposure to mid-tier gold miners, which will see gains well outpacing the majors. All it will take to ignite gold stocks’ overdue mean-reversion rally is gold investment demand returning. The resulting higher gold prices will attract investors back to gold miners.
The junior gold miners’ stocks have spent months grinding sideways near lows, sapping confidence and breeding widespread bearishness. The entire precious-metals sector has been left for dead, eclipsed by the dazzling Trumphoria stock-market rally. But traders need to keep their eyes on the fundamental ball so herd sentiment doesn’t mislead them. The juniors recently reported Q2 earnings, and enjoyed strong results.
Four times a year publicly-traded companies release treasure troves of valuable information in the form of quarterly reports. Companies trading in the States are required to file 10-Qs with the US Securities and Exchange Commission by 45 calendar days after quarter-ends. Canadian companies have similar requirements. In other countries with half-year reporting, some companies still partially report quarterly.
The definitive list of elite junior gold stocks to analyze used to come from the world’s most-popular junior-gold-stock investment vehicle. This week the GDXJ VanEck Vectors Junior Gold Miners ETF reported $4.0b in net assets. Among all gold-stock ETFs, that was only second to GDX’s $7.5b. That is GDXJ’s big-brother ETF that includes larger major gold miners. GDXJ’s popularity testifies to the great allure of juniors.
Unfortunately this fame has recently created major problems severely hobbling the usefulness of GDXJ. This sector ETF has shifted from being beneficial for junior gold miners to outright harming them. GDXJ is literally advertised as a “Junior Gold Miners ETF”. Investors only buy GDXJ shares because they think this ETF gives them direct exposure to junior gold miners’ stocks. But unfortunately that’s no longer true!
GDXJ is quite literally the victim of its own success. This ETF grew so large in the first half of 2016 as gold stocks soared in a massive upleg that it risked running afoul of Canadian securities law. Most of the world’s junior gold miners and explorers trade in Canada. In that country once any investor including an ETF goes over 20% ownership in any stock, it is deemed a takeover offer that must be extended to all shareholders!
Understanding what happened in GDXJ is exceedingly important for junior-gold-stock investors, and I explained it in depth in my last essay on juniors’ Q1’17 results. GDXJ’s managers were forced to reduce their stakes in leading Canadian juniors. So last year capital that GDXJ investors intended to deploy in junior gold miners was instead diverted into much-larger gold miners. GDXJ’s effective mission stealthily changed.
Not many are more deeply immersed in the gold-stock sector than me, as I’ve spent decades studying, trading, and writing about this contrarian realm. These huge GDXJ changes weren’t advertised, and it took even me months to put the pieces together to understand what was happening. GDXJ’s managers may have had little choice, but their major direction change has been devastating to the junior gold miners.
Investors naturally poured capital into GDXJ, the “Junior Gold Miners ETF”, expecting to own junior gold miners. But instead of buying junior gold miners’ shares and bidding up their prices, GDXJ was instead shunting those critical inflows to the much-larger mid-tier and even major gold miners. That left the junior gold miners starved of capital, as their share prices they rely heavily upon for financing languished in neglect.
GDXJ’s managers should’ve lobbied Canadian regulators and lawmakers to exempt ETFs from that 20% takeover rule. Hundreds of thousands of investors buying an ETF obviously have no intention of taking over gold-mining companies! And higher junior-gold-stock prices boost the Canadian economy, helping these miners create valuable high-paying jobs. But GDXJ’s managers instead skated perilously close to fraud.
This year they rejiggered their own index underlying GDXJ, greatly demoting most of the junior gold miners! Investors buying GDXJ today are getting very-low junior-gold-miner exposure, which makes the name of this ETF a deliberate deception. I’ve championed GDXJ for years, it is a great idea. But in its current sorry state, I wouldn’t touch it with a ten-foot pole. It is no longer anything close to a junior-gold-miners ETF.
There’s no formal definition of a junior gold miner, which gives cover to GDXJ’s managers pushing the limits. Major gold miners are generally those that produce over 1m ounces of gold annually. For years juniors were considered to be sub-200k-ounce producers. 300k ounces per year is a very generous threshold. Anything between 300k to 1m ounces annually is in the mid-tier realm, where GDXJ now traffics.
That high 300k-ounce-per-year junior cutoff translates into 75k ounces per quarter. Following the end of the gold miners’ Q2 earnings season in mid-August, I dug into the top 34 GDXJ components. That is just an arbitrary number that fits neatly into the tables below. While GDXJ had a whopping 73 component stocks in mid-August, the top 34 accounted for 81.5% of its total weighting. That’s a commanding sample.
Out of these top 34 GDXJ companies, only 4 primary gold miners met that sub-75k-ounces-per-quarter qualification to be a junior gold miner! Their quarterly production is highlighted in blue below, and they collectively accounted for just 7.1% of GDXJ’s total weighting. And that isn’t righteous, as these include a 126-year-old silver miner, a mid-tier miner with temporary production declines, and a ramping mid-tier producer.
GDXJ is inarguably now a pure mid-tier gold-miner ETF. That’s great if GDXJ is advertised as such, but terrible if capital investors explicitly intend for junior gold miners is instead being diverted into mid-tiers without their knowledge or consent. The vast majority of GDXJ shareholders have no idea how radically this ETF has changed since early 2016. It is all but unrecognizable, straying greatly from its original mission.
I’ve been doing these deep quarterly dives into GDXJ’s top components for years now. In Q2’17, fully 29 of the top 34 GDXJ components were also GDX components. These ETFs are separate, a “Gold Miners ETF” and a “Junior Gold Miners ETF”. So why on earth should they own many of the same companies? In the tables below I highlighted GDXJ components also in GDX in yellow in the column showing GDXJ weightings.
These 29 GDX components accounted for 74.6% of GDXJ’s total weighting, not just its top 34. They also represented 30.1% of GDX’s total weighting. So three-quarters of the junior gold miners’ ETF is made up of nearly a third of the major gold miners’ ETF! I’ve talked with many GDXJ investors over the years, and have never heard one wish their capital allocated specifically to junior golds would instead go to much-larger miners.
Fully 12 of GDXJ’s top 17 components weren’t even in this ETF a year ago in Q2’16. They alone now account for 40.6% of its total weighting. 15 of the top 34 are new, or 45.3% of the total. In the tables below, I highlighted the symbols of companies actually in GDXJ a year ago in light blue. Today’s GDXJ is a radical departure from a year ago. Analyzing Q2’17 results largely devoid of real juniors was frustrating.
Nevertheless, GDXJ remains the leading “junior-gold” benchmark. So every quarter I wade through tons of data from its top components’ 10-Qs, and dump it into a big spreadsheet for analysis. The highlights made it into these tables. A blank field means a company didn’t report that data for Q2’17 as of that mid-August 10-Q deadline. Companies have wide variations in reporting styles, data presented, and report timing.
In these tables the first couple columns show each GDXJ component’s symbol and weighting within this ETF as of mid-August. While most of these gold stocks trade in the States, not all of them do. So if you can’t find one of these symbols, it’s a listing from a company’s primary foreign stock exchange. That’s followed by each company’s Q2’17 gold production in ounces, which is mostly reported in pure-gold terms.
Many gold miners also produce byproduct metals like silver and copper. These are valuable, as they are sold to offset some of the considerable costs of gold mining. Some companies report their quarterly gold production including silver, a construct called gold-equivalent ounces. I only included GEOs if no pure-gold numbers were reported. That’s followed by production’s absolute year-over-year change from Q2’16.
Next comes the most-important fundamental data for gold miners, cash costs and all-in sustaining costs per ounce mined. The latter determines their profitability and hence ultimately stock prices. Those are also followed by YoY changes. Finally the YoY changes in cash flows generated from operations, GAAP profits, revenues, and cash on balance sheets are listed. There’s one key exception to these YoY changes.
Percentage changes aren’t relevant or meaningful if data shifted from negative to positive or vice versa. Plenty of major gold miners earning profits in Q2’17 suffered net losses in Q2’16. So in cases where data crossed that zero line, I included the raw numbers instead. This whole dataset offers a fantastic high-level fundamental read on how the mid-tier gold miners are faring today. They’re looking quite impressive.
After spending days digesting these GDXJ gold miners’ latest quarterly reports, it’s fully apparent their vexing consolidation this year isn’t fundamentally righteous at all! Traders have abandoned this sector since the election because the allure of the levitating general stock markets has eclipsed gold. That has left gold stocks exceedingly undervalued, truly the best fundamental bargains out there in all the stock markets!
Once again the light-blue-highlighted symbols are GDXJ components that were there a year ago. The white-backgrounded ones are new additions. And the yellow-highlighted GDXJ weightings are stocks that were also GDX components in mid-August. GDXJ is increasingly a GDX clone that offers little if any real exposure to true gold juniors’ epic upside potential during gold bulls. GDXJ is but a shadow of its former self.
VanEck owns and manages GDX, GDXJ, and the MVIS indexing company that decides exactly which gold stocks are included in each. With one company in total control, GDX and GDXJ should have zero overlap in underlying companies! GDX or GDXJ inclusion should be mutually-exclusive based on the size of individual miners. That would make both GDX and GDXJ much more targeted and useful for investors.
GDXJ’s highest-ranked component choices made by its managers are mystifying. This “Junior Gold Miners ETF” has a major primary silver miner as its largest component. Over half of PAAS’s sales in Q2 came from silver. And the next two biggest are large South African gold miners. That country has one of the most anti-shareholder governments in the world now, forcing unconscionable racial quotas on owners.
Since gold miners are in the business of wresting gold from the bowels of the Earth, production is the best place to start. These top 34 GDXJ gold miners collectively produced 3,583k ounces in Q2’17. That rocketed 74% higher YoY, but that comparison is meaningless given the extreme changes in this ETF’s composition since mid-2016. On the bright side, GDXJ’s miners do remain significantly smaller than GDX’s.
GDX’s top 34 components, fully 20 of which are also top-34 GDXJ components, collectively produced 9854k ounces of gold in Q2. So GDXJ components’ average quarterly gold production of 119k ounces excluding explorers was 61% lower than GDX components’ 308k average. So even if GDXJ’s “Junior” name is very misleading, it definitely has smaller gold miners even if they’re well above that 75k junior threshold.
Despite GDXJ’s top 34 components looking way different from a year ago, these current gold miners are faring well on the crucial production front. Fully 19 of these mid-tier gold miners enjoyed big average YoY production growth of 26%! Overall average growth excluding explorers was 12% YoY, which is nothing to sneeze at given gold’s rough year since mid-2016. These elite GDXJ gold “juniors” are really thriving.
Gold production varies seasonally within calendar years partially due to mining-plan timing. Gold-bearing ore was certainly not created equal, with even individual deposits seeing big internal variations in their metal-to-waste-rock ratios. Miners often have to dig through lower-grade ore to get to the higher-grade zones underneath. This still has economically-valuable amounts of gold, so it is run through the mills.
These mills are essentially giant rock grinders that break ore into smaller pieces, vastly increasing its surface area for chemicals to later leach out the gold. Mill capacity is fixed, with limits on ore tonnage throughput. So when miners are blasting and hauling lower-grade ore, fewer ounces are produced. As they transition into higher-grade zones, the same amount of rock naturally yields more payable ounces.
Regardless of the ore grades being blasted and milled, the overall quarterly costs of mining don’t change much. Operations require the same levels of employees, fuel, maintenance, and electricity no matter how rich the rock being processed. So higher gold production directly leads to lower per-ounce mining costs. The big fixed costs of gold mining are spread across more ounces, making this business more profitable.
There are two major ways to measure gold-mining costs, classic cash costs per ounce and the superior all-in sustaining costs per ounce. Both are useful metrics. Cash costs are the acid test of gold-miner survivability in lower-gold-price environments, revealing the worst-case gold levels necessary to keep the mines running. All-in sustaining costs show where gold needs to trade to maintain current mining tempos indefinitely.
Cash costs naturally encompass all cash expenses necessary to produce each ounce of gold, including all direct production costs, mine-level administration, smelting, refining, transport, regulatory, royalty, and tax expenses. In Q2’17, these top 34 GDXJ-component gold miners that reported cash costs averaged just $628 per ounce. That was indeed down a sizable 1.3% YoY from Q2’16, and 3.0% QoQ from Q1’17.
This was really quite impressive, as the mid-tier gold miners’ cash costs were only a little higher than the GDX majors’ $605. That’s despite the mid-tiers each operating fewer gold mines and thus having fewer opportunities to realize cost efficiencies. Traders must recognize these smaller gold miners are in zero fundamental peril as long as prevailing gold prices remain well above cash costs. And $628 gold ain’t happening!
Way more important than cash costs are the far-superior all-in sustaining costs. They were introduced by the World Gold Council in June 2013 to give investors a much-better understanding of what it really costs to maintain a gold mine as an ongoing concern. AISC include all direct cash costs, but then add on everything else that is necessary to maintain and replenish operations at current gold-production levels.
These additional expenses include exploration for new gold to mine to replace depleting deposits, mine-development and construction expenses, remediation, and mine reclamation. They also include the corporate-level administration expenses necessary to oversee gold mines. All-in sustaining costs are the most-important gold-mining cost metric by far for investors, revealing gold miners’ true operating profitability.
In Q2’17, these top 34 GDXJ components reporting AISC averaged just $879 per ounce. That’s down 0.9% YoY and 4.9% QoQ. That also compares very favorably with the GDX majors, which saw average AISC nearly identical at $867 in Q2. The mid-tier gold miners’ low costs show they are faring far better fundamentally today than everyone thinks based on this year’s largely-disappointing technical stock-price action.
All-in sustaining costs are effectively this industry’s breakeven level. As long as gold stays above $879 per ounce, it remains profitable to mine. At Q2’s average gold price of $1258, these top GDXJ gold miners were earning big average profits of $379 per ounce last quarter! That equates to hefty profit margins of 30%, levels most industries would kill for. The mid-tier gold miners aren’t getting credit for that today.
Unfortunately given its largely-junior-less composition, GDXJ remains the leading benchmark for junior gold miners. In Q2’17, GDXJ averaged $33.30 per share. That was down a sharp 11% from Q1’s average of $37.46. Investors have largely abandoned gold miners because they are captivated by the extreme Trumphoria stock-market rally since the election. Yet gold-mining profits surged in that span.
At Q1’s average gold price of $1220 and Q1’s average top GDXJ components’ AISC of $924, these elite mid-tier miners were earning $296 per ounce on average. That’s already quite healthy. But quarter-on-quarter from Q1 to Q2, these top 34 GDXJ components’ operating profits rocketed 28% higher to $379 per ounce. There’s absolutely no doubt the sharp decline in gold-stock prices in Q2 had nothing to do with fundamentals!
Gold stocks are in the dumps technically because these lofty stock markets keep powering higher. Even though they are in dangerous bubble territory and the Fed is on the verge of starting to suck capital out of the markets via super-bearish quantitative tightening. These record stock markets have really retarded investment demand for gold, which tends to move counter to stock markets. So gold stocks are deeply out of favor.
Gold-stock price levels and psychology are totally dependent on gold, the dominant driver of miners’ profits. Gold stocks enjoy major profits leverage to gold, which gives their stocks big upside potential when gold rallies. Gold-mining costs are essentially fixed during mine-planning stages. Generally the same numbers of employees and equipment are used quarter after quarter regardless of the gold price.
So higher gold prices flow right through to the bottom line, costs don’t rise with them. If gold rallies just another 3.4% from Q2’s average prices to average $1300 in a coming quarter, profits will surge another 11.1% at Q2’s all-in sustaining costs. In a $1400-average-gold quarter, merely 11.3% higher from Q2’s levels, gold-mining profits would soar 37.5% higher. At $1500, those gains surge to 19.3% and 63.9%!
And a 20% gold rally from Q2’s levels is nothing special. Back in roughly the first half of last year after a sharp stock-market correction, gold powered 29.9% higher in just 6.7 months! So if you believe gold is heading higher in coming quarters as these crazy stock markets falter, the gold stocks are screaming buys today fundamentally. Their already-strong profitability will soar, amplifying gold’s mean-reversion upleg.
Since today’s bastardized GDXJ largely devoid of juniors changed so radically since last year, the normal year-over-year comparisons in key financial results aren’t comparable. But here they are for reference. These top-34 GDXJ companies’ cashflows generated from operations soared 57% YoY to $1458m. That was driven by sales up 59% YoY to $3840m. That left their collective cash balances $34% higher YoY at $6140m.
And top-34-GDXJ-component profits skyrocketed 385% YoY to $751m. Again don’t read too much into this since it’s an apples-to-oranges comparison. If GDXJ’s component list and weightings finally stabilize after such extreme tumult, we’ll have clean comps again next year. We can still look at operating cash flows and GAAP profits among this year’s list of top-34 components, which offers some additional insights.
On the OCF front, 10 of these 34 miners reported average YoY gains of 54%, while 13 of them reported average declines of 33%. Together all 23 averaged operating-cash-flows growth of 5%. That isn’t much, but it’s positive. And it’s not bad considering Q2’17’s average gold price was dead flat from Q2’16’s. These mid-tier gold miners are doing far better operationally than their neglected super-low stock prices imply.
On the GAAP-earnings front, the 10 miners that earned profits in both Q2s averaged huge growth of 110% YoY! And out of 14 more miners that saw profits cross zero in the past year, 8 swung from losses to gains. Total annual earnings growth among those zero-crossing swingers exceeded $536m. Make no mistake, these “junior” gold miners are thriving fundamentally even at Q2’s relatively-low $1258 average gold.
So overall the mid-tier gold miners’ fundamentals looked quite impressive in Q2’17, a stark contrast to the miserable sentiment plaguing this sector. Gold stocks’ vexing consolidation this year wasn’t the result of operational struggles, but purely bearish psychology. That will soon shift as stock markets roll over and gold surges, making the beaten-down gold stocks a coiled spring today. They are overdue to soar again!
Though this contrarian sector is despised, it was the best-performing in all the stock markets last year despite a sharp Q4 post-election selloff. The leading HUI gold-stock index blasted 64.0% higher in 2016, trouncing the S&P 500’s 9.5% gain! Similar huge 50%+ gold-stock gains are possible again this year, as gold mean reverts higher as stock markets sell off. The gold miners’ strong Q2 fundamentals prove this.
Given GDXJ’s serious problems, leading to diverting most of its capital inflows into larger gold miners that definitely aren’t juniors, you won’t find sufficient junior-gold exposure in this troubled ETF. Instead traders should prudently deploy capital in the better individual junior gold miners’ stocks with superior fundamentals. Their upside is vast, and would trounce GDXJ’s even if it was still working as advertised.
At Zeal we’ve literally spent tens of thousands of hours researching individual gold stocks and markets, so we can better decide what to trade and when. As of the end of Q2, this has resulted in 951 stock trades recommended in real-time to our newsletter subscribers since 2001. Fighting the crowd to buy low and sell high is very profitable, as all these trades averaged stellar annualized realized gains of +21.2%!
The key to this success is staying informed and being contrarian. That means buying low when others are scared, like late in this year’s vexing consolidation. An easy way to keep abreast is through our acclaimed weekly and monthly newsletters. They draw on our vast experience, knowledge, wisdom, and ongoing research to explain what’s going on in the markets, why, and how to trade them with specific stocks. For only $10 per issue, you can learn to think, trade, and thrive like contrarians. Subscribe today, and get deployed in the great gold stocks on our trading books before they surge far higher!
The bottom line is the mid-tier gold miners that now dominate GDXJ enjoyed strong fundamentals in their recently-reported Q2 results. Despite a flat comp-quarter gold price, they collectively mined more gold at lower costs. That naturally fueled better operating cash flows and profits. Today’s low gold-stock prices and popular bearishness are wildly unjustified fundamentally, an anomaly that doesn’t reflect operations.
As gold itself continues mean reverting higher, these mid-tier gold miners will see their profits soar due to their big inherent leverage to gold. GDXJ now offers excellent exposure to mid-tier gold miners, which will see gains well outpacing the majors. But if you are looking for the extreme upside likely in true junior gold miners, avoid today’s GDXJ and buy individual stocks. GDXJ is no longer a “Junior Gold Miners ETF”!

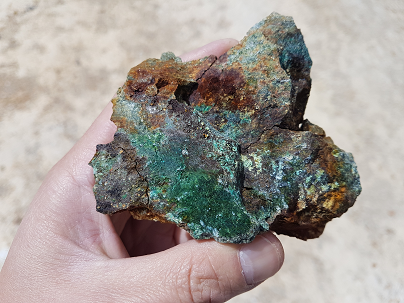
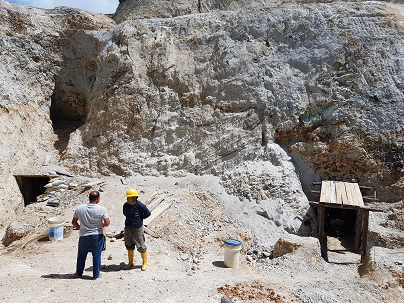
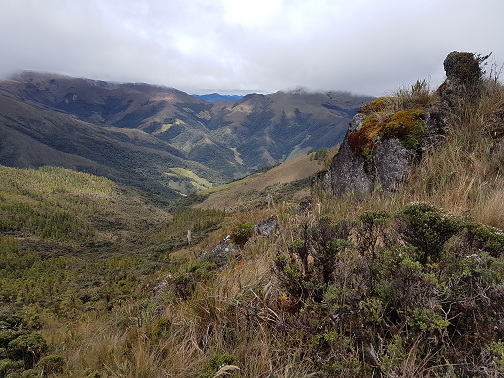
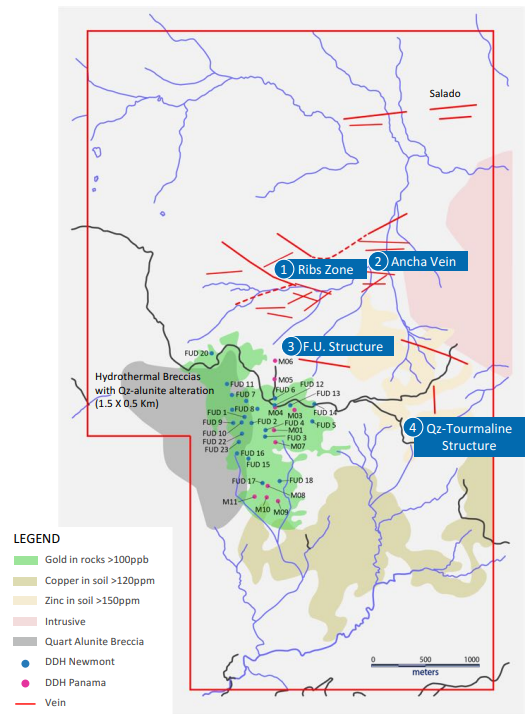

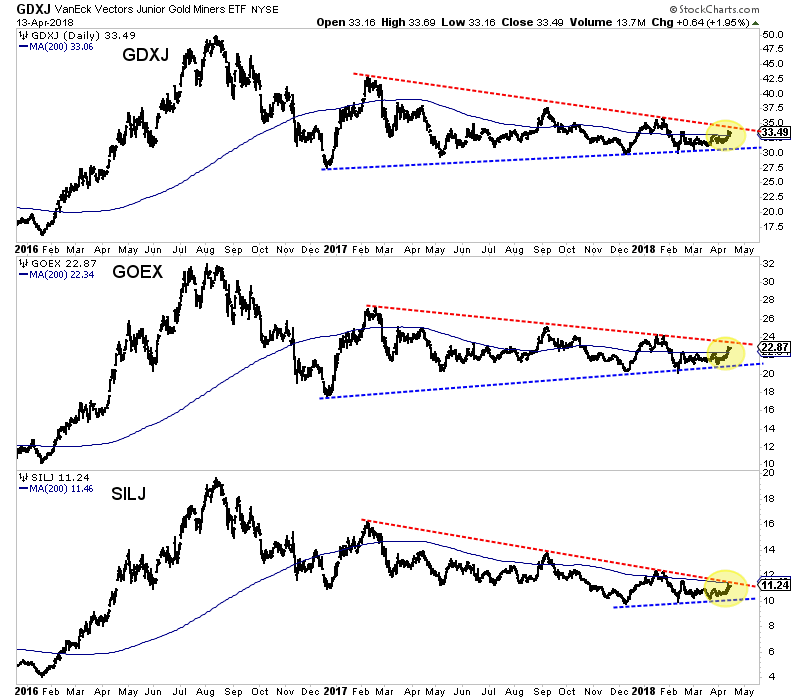
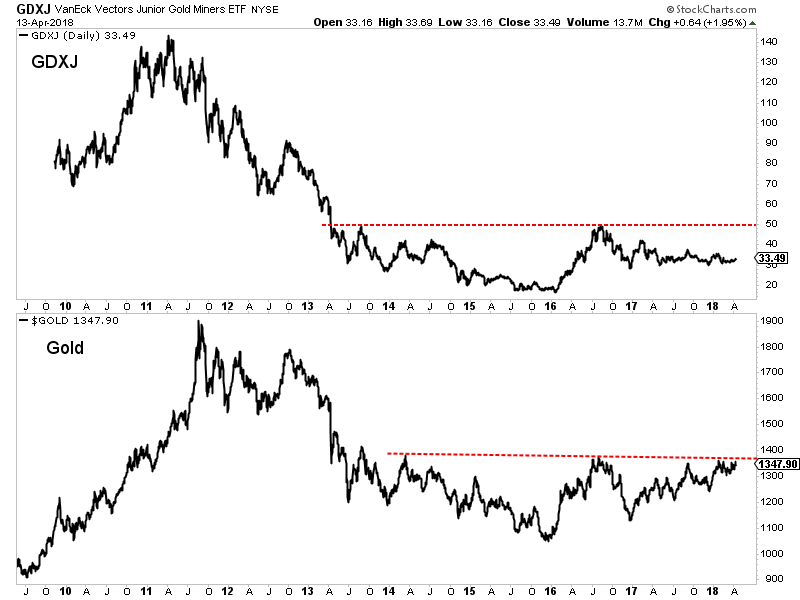
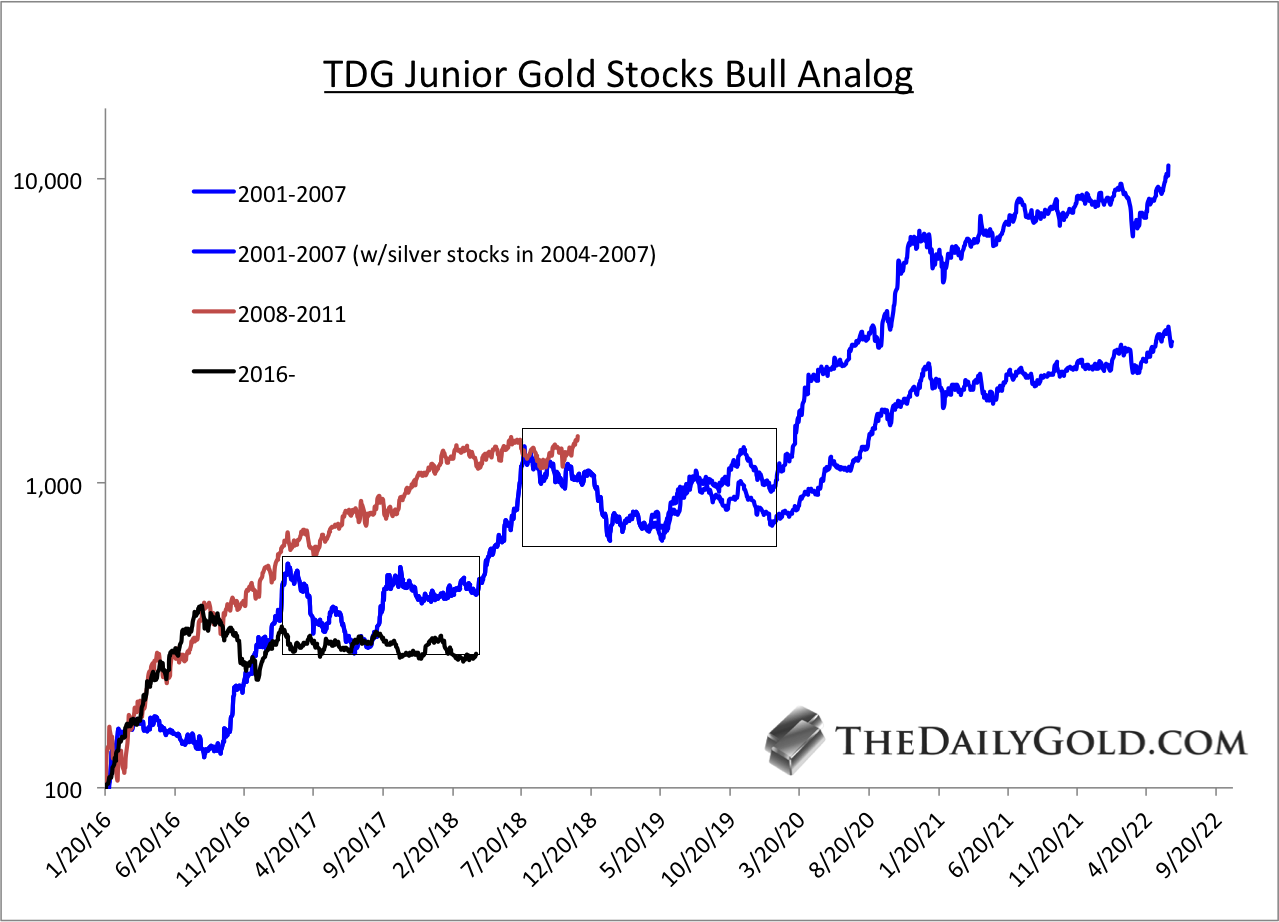

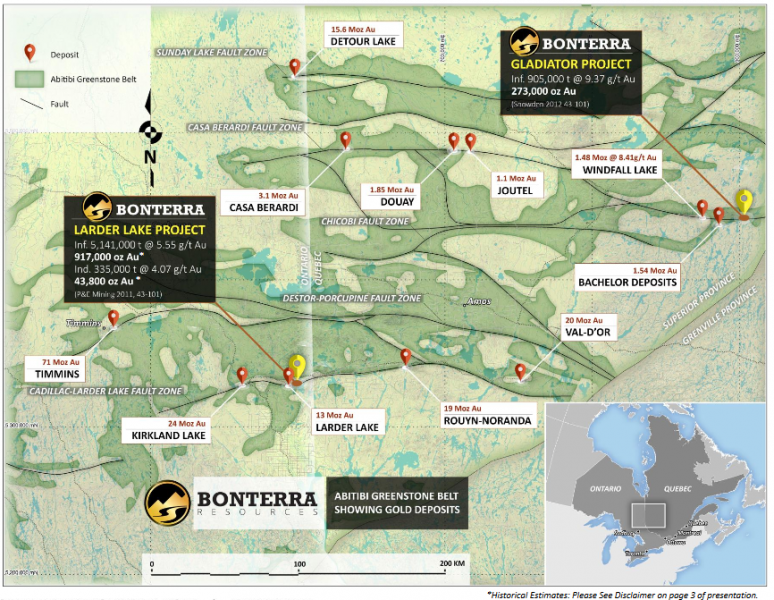
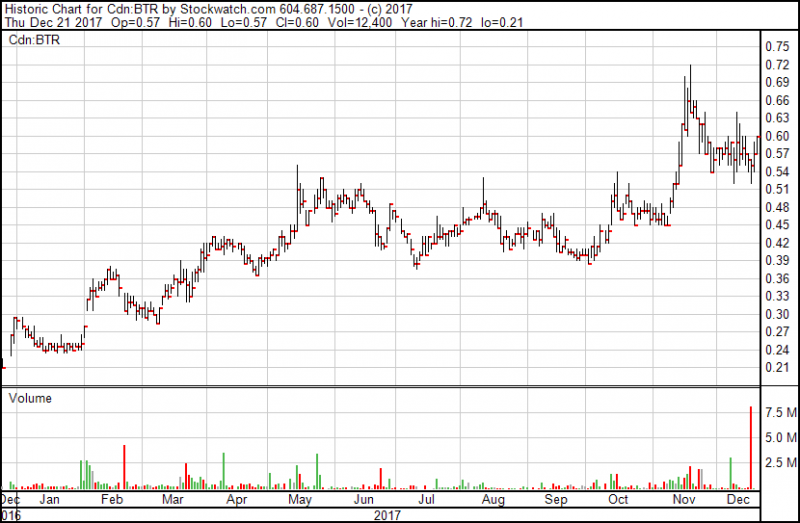
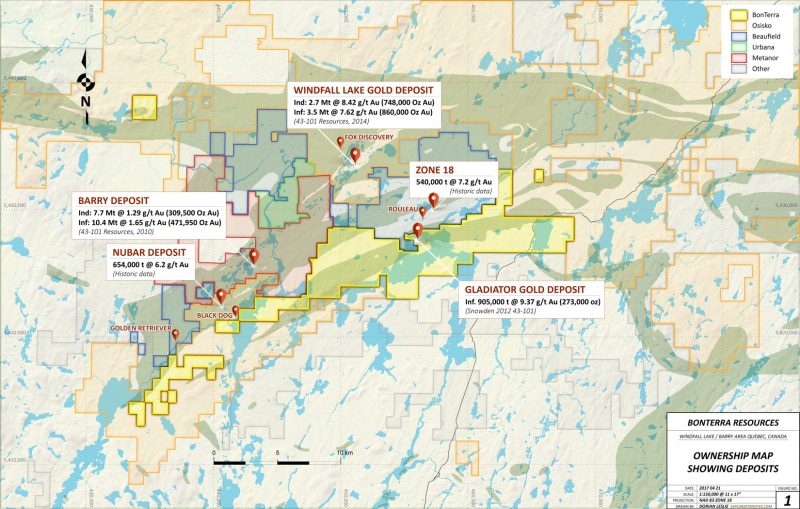


 Follow us on Twitter
 Become our facebook fan


