
Franco-Nevada is a diamond in the mining industry, as a steady and profitable royalty and streaming company. In a world of low yields and interest rates, investors are hard-pressed to find the kind of returns that will make them look at their RRSP with pride. Chasing returns also carries significant risk, which Franco-Nevada controls for by not operating mines, developing projects, or conducting exploration.
Low-Risk, Reponsible Management
The company instead focuses on managing and growing the company’s portfolio and streams, giving them exposure to commodity price optionality and a perpetual discovery option over large areas of profitable and geologically prospective real estate. This low-risk, steady, and high-reward business model is a counterbalance to the hit-and-miss strategies of many other mining companies. The company has limited exposure to many of the risks associated with operating companies because of its capital-light business model. This nimble operation strategy allows it to pivot to new projects, mines, and even supporting the industry when needed. The company engages in exploration efforts as part of advancing a property in advance of taking on an investment. This due diligence is necessary as the company relies on the industry operating responsibly to both reduce risk, and honour the royalty and streaming agreements they make.
By The Numbers
With the stock price sitting at over $109, the company is more expensive than many of its peers, but this is an investment that gives more than it takes, just as it should be. Their portfolio of precious metals like gold, silver, and platinum group metals, oil, gas, and natural gas liquids allows them to give investors a dividend yield of 0.90%. With an operating margin of 28.18% and a return on equity of 5.18%, this is one of the rare mining companies that consistently turns out results investors can be pleased with. With zero debt, and a fully equity-funded balance sheet, not only are the paper stats solid, but the bottom line fundamentals are strong enough to keep buying the stock as it gains.
Their recent announcement of a US$0.26 per share dividend to be paid on March 25th, 2021 to shareholders of record on March 11th, 2021 was welcomed warmly by investors. Analysts are estimating 15% growth for 2021, and as the company gears up to report 4Q2020 earnings on March 10th, investors eagerly await a sign that all is well with this steady performer. Whether 2021 will shape up to be as good a year for Franco-Nevada as 2020 was is still yet to be seen, but with restrictions lifting, business activity picking up, and an optimism in the air, new projects and mines will continue to need the company’s services, bringing more dividends for shareholders quarter after quarter.
Dividends Keep Padding Portfolios
We will continue to watch the dividend payout ratio, as the company must balance paying out less in dividends than it earns; the opposite would make the dividend unstable. Franco-Nevada paid out 74% of its earnings to investors last year, an average level for most businesses, and nothing they need to worry about adjusting. Dividends also used just 27% of the free cash flow it generated, leaving a comfortable margin to continue paying a dividend throughout 2021. As long as earnings don’t drop precipitously, the dividend looks to be stable and is covered by both profit and cash flow.
*This story will be updated on March 10th after the earnings report.
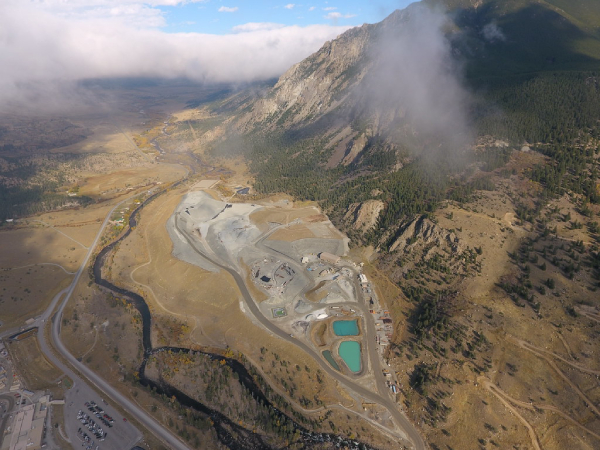
On August 29, Cypress Development Corp. (TSX-V: CYP) / (OTCQB: CYDVF) announced the successful completion of slurry rheology & filtration studies that are an integral part of the Pre-Feasibility Study (PFS) for the Clayton Valley clay-hosted lithium project, located immediately adjacent to Albemarle Corp.’s Silver Peak brine processing facilities in Nevada.
Management believes its U.S. location will become an increasingly valuable attribute. While many junior lithium companies like to name drop “Albemarle” and “Silver Peak,” Cypress owns 100% of one of just a few projects in Nevada that Albemarle might actually be interested in.
More promising results from Cypress’ expert technical team
Back to the latest news…. the outcome was the result of months of testing by laboratories and a detailed review with consultants & equipment vendors. This news represents a major milestone in the project because the results simplify the process flow sheet.
Cypress CEO Dr. Bill Willoughby commented in the press release,
“A critical step for us at Clayton Valley is the separation of solids & liquids. A viable process is dependent upon the ability to separate the process leach solution (PLS) from the leached residue whether by thickeners, filters, or other means. Significant test work has allowed Cypress to identify a commercially viable process, based on filtration, to take the solid-liquid separation from the laboratory benchtop to the operational scale.”
Readers may recall that Cypress released positive results from the first & second phases of its PFS metallurgical program in February & July. Since then, work has continued on other aspects of the PFS, including recovery & concentration of lithium from solution through mechanical evaporation, membrane filtration, and ion-exchange processes.

CEO Willoughby continued,
“The Cypress technical team discovered the Clayton Valley clays behave differently at varying leach conditions. By looking at the electro-kinetic potential of the clays we can select the optimal reagents & equipment. We also know under what conditions the rheology of the slurries becomes a limitation, and can design the flow sheet accordingly. With this new knowledge, we are confident we can simplify a significant portion of the leaching flow sheet.”
Cypress is looking at additional steps to simplify plant design with the goal to further streamline the production process and lower costs. With metallurgical & materials handling studies completed, Cypress expects to publish a PFS during the fourth quarter.
Next major milestone is a PFS in 4th quarter
It appears the PFS has been pushed back a few months. After a recent capital raise the company is comfortably funded through delivery of a PFS later this year. Come to think of it, what’s the rush? Investor sentiment remains very weak for lithium, cobalt, vanadium & graphite juniors. As long as Cypress is funded, let them keep carrying out studies to improve the PFS! Below are some highlights from the PEA.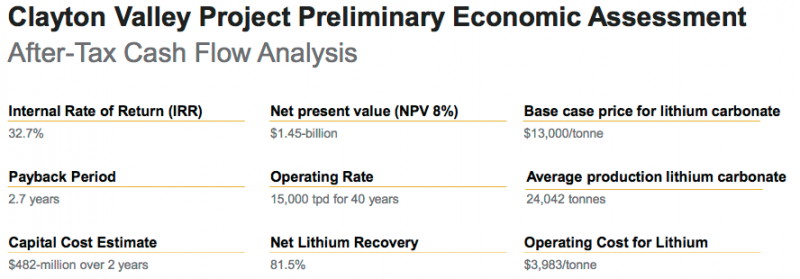
It’s important at this point to reiterate the considerable strength of management, the Board, technical advisers & retained consultants. All of these impressive people and groups are being effectively led by CEO Willoughby, who has a Doctorate in Mining Engineering & Metallurgy from the Univ. of Idaho.
Who on earth could possibly be better to run this show than a PhD in engineering & metallurgy!?! He knows what he’s doing, and he’s a driving force behind the very good results and progress his technical team is delivering.
I asked Dr. Willoughby about last week’s news, he said,
“It’s a major technical problem to separate ultrafine clays particles < 5 microns from a leach solution. Our solution could put us in the forefront of clay-hosted lithium projects globally.”
Demand keeps increasing, supply increasingly uncertain
There’s a massive disconnect in the lithium world. For years, demand forecasts have been going up. The demand side of the equation — driven by both energy storage & the electrification of passenger & commercial vehicles — is likely to increase at a Compound Annual Growth Rate (CAGR) of at least 15%, perhaps 20% or more. For example, at a 20% CAGR from Albemarle’s 270K tonne figure in 2018, demand would reach 967K tonnes in 2025.
Albemarle has a particularly good graphic depicting this unmistakable trend. Four years ago they expected ~400K tonnes LCE demand in 2025. Now, Albemarle is forecasting demand of about 1 million tonnes in 2025. Likewise, Lithium Americas is forecasting between 1.0 to 1.2 million tonnes LCE demand in 2025, a range it says comes from industry producers & publicly reported forecasts.
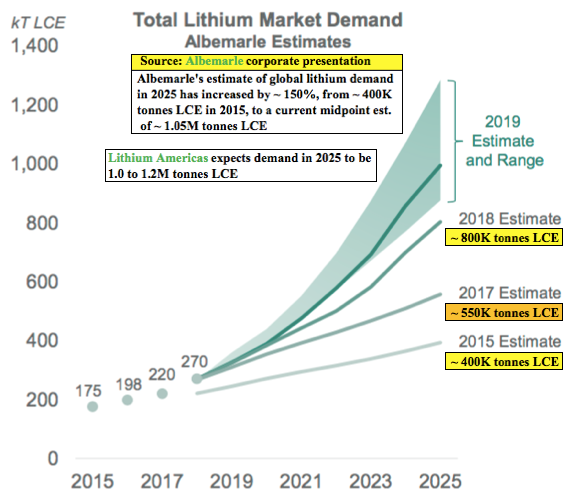
, Finally, Fastmarkets expects LCE demand to grow from ~300K tonnes in 2019 to “at least” 1.1 million tonnes in 2025. So, a lot of forecasts in and around the one million tonne mark, but even if it turns out to be less, I think it will be a major challenge for supply to approach that level in the next six years.
The longer the project delays in Argentina / Chile brine projects, and the more project mishaps like at Nemaska, the more room there is for unconventional projects such as Cypress Development’s Clayton Valley. The market will take every battery-grade tonne of lithium chemicals produced by any company that can supply them. Lithium juniors who can make it across the production finish line will be richly rewarded.
Despite significant fiscal & political challenges in Argentina that could further delay brine projects there, and continued slow movement in project development & production expansions in Chile, unconventional projects are still meaningfully undervalued compared to brine projects.
For example, Cypress Development Corp.’s enterprise value (“EV“) is less than 1% of the after-tax NPV found in its PEA. Compare that to the average 8.2% EV/NPV on the chart below. Cypress’ EV/cap-ex ratio of 3.0 times (3.0x) is 40% better than the 2.1x average of the other unconventional projects.
Cypress has the highest after-tax IRR on the chart at 32.7%, compared to an average of 26.1% among the others. And, the company’s cap-ex at C$641 million is 21% lower than the peer average.
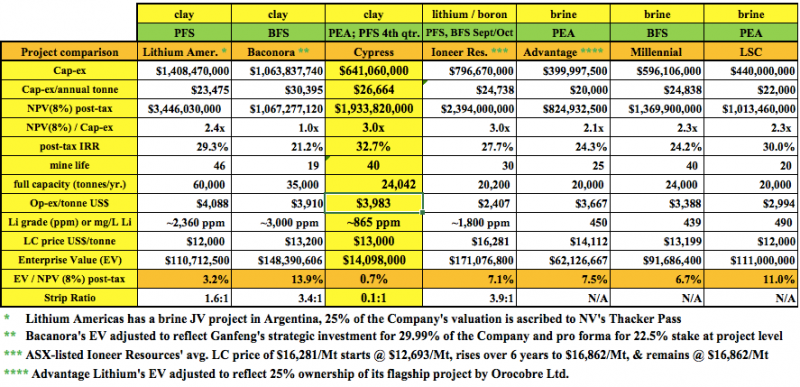
Finally, readers should note that the Clayton Valley project has a strip ratio of 0.1 to 1. The other three projects with strip ratios average 3.0 to 1. Cypress has 1/30th the strip ratio of its unconventional peers!
That’s a big reason why the company has attractive op-ex & cap-ex, despite having lower grade Li to work with. Another reason is the mineralogy; the Clayton Valley project’s lithium abundance is hosted in a friendlier clay than that at some of the other projects. Friendlier meaning easier and less costly to liberate the lithium into solution.
The extreme weakness in the vast majority of lithium juniors is actually great news. Great news for any lithium company hopeful that can produce lithium next decade. Great news for investors who may want to average down in their favorite battery metals names.
Brine projects have gone from, “can’t go wrong,” to “can’t fund”
A funny thing happened over the past two years. Brine projects went from no-brainers; (lowest cost, best understood, most reliable) — to the exact opposite. Solar evaporation ponds are getting less and less popular by the week, day, hour! And, unusually rainy weather in the Puna region of Argentina has negatively impacted pond yields. Speaking of Argentina….. well just read the headlines, it’s not pretty.
Chile imposed an onerous sliding-scale royalty on realized lithium prices from production in the Atacama salar. Albemarle’s & SQM’s best, lowest cost lithium brine operations…. the world’s best, may no longer the world’s lowest cost.
Brine projects were sure things and clay-hosted lithium projects were, “maybe in 10 years.” Now? Most brine projects are dead in the water, some of them never coming back to life. Even the top-quartile, most advanced projects are not getting funded. By contrast, the prospects for clay-hosted lithium projects are better than they were two years ago, albeit also difficult to fund.
Investors would be crazy not to consider unconventional assets. Brine projects, with evaporation ponds attached, will themselves be unconventional at some point in the future. The only question is when.
In early August, Glencore announced it was shutting a major cobalt / copper mine in Africa at the end of the year. Three weeks later, cobalt prices are up 30-35%. It might not take that much to get lithium prices back on an upswing. If prices were to improve, juniors like Cypress Development Corp., trading at under 1% of third-party derived after-tax NPVs, could do quite well.
Peter Epstein
September 13, 2019
Disclosures: The content of this article is for information only. Readers fully understand and agree that nothing contained herein, written by Peter Epstein of Epstein Research [ER], (together, [ER]) about Cypress Development Corp., including but not limited to, commentary, opinions, views, assumptions, reported facts, calculations, etc. is to be considered implicit or explicit investment advice. Nothing contained herein is a recommendation or solicitation to buy or sell any security. [ER] is not responsible for investment actions taken by the reader. [ER] has never been, and is not currently, a registered or licensed financial advisor or broker / dealer, investment advisor, stockbroker, trader, money manager, compliance or legal officer, and does not perform market making activities. [ER] is not directly employed by any company, group, organization, party or person. The shares of Cypress Development Corp. are highly speculative, not suitable for all investors. Readers understand and agree that investments in small cap stocks can result in a 100% loss of invested funds. It is assumed and agreed upon by readers that they will consult with their own licensed or registered financial advisors before making investment decisions.
At the time this interview was posted, Peter Epstein owned shares of Cypress Development Corp., and the Company was an advertiser on [ER].
While the author believes he’s diligent in screening out companies that, for any reasons whatsoever, are unattractive investment opportunities, he cannot guarantee that his efforts will (or have been) successful. [ER] is not responsible for any perceived, or actual, errors including, but not limited to, commentary, opinions, views, assumptions, reported facts & financial calculations, or for the completeness of this article or future content. [ER] is not expected or required to subsequently follow or cover any future events & news, or write about any particular company, sector or topic. [ER] is not an expert in any company, sector or investment topic.
Royal Road Minerals has released results from its recently completed diamond drilling program at the Luna Roja gold project in Nicaragua.
The Luna Roja project is part of a strategic alliance agreement with Hemco Mineros Nicaragua and is located in the highly prospective Golden Triangle region of northeastern Nicaragua. Mines in the region have been operating since the early 1900s.
The first drilling program to be completed on the project returned significant intersections including, 40.65 meters at 2.5 grams per tonne, 23.5 meters at 5.1 grams per tonne, 12.0 meters at 7.1 grams per tonne and 5.5 meters at 12.2 grams per tonne gold.
The drilling results indicate that gold mineralization remains open at depth (down to 150m vertical depth) and management believe that potential exists for further gold mineralization in a downthrown block concealed structurally below mapped marbles and skarnoids to the southeast.
Samples of the drill core have been shipped to Bureau Veritas Vancouver for preliminary metallurgical testing.
“These drilling results are a great start at Luna Roja,” said Royal Road president and CEO Dr. Tim Coughlin. “This discovery is a product of great teamwork and of an exemplary collaboration with our partners, Hemco Mineros Nicaragua. The possibility of extensions to gold mineralization at depth and under faulted cover to the southeast at Luna Roja is enticing. We are also excited to have established our first Designated Project Area and look forward to advancing the Luna Roja project with our partners Hemco Mineros Nicaragua and with the local community, local authorities and other valuable regional stakeholders.”
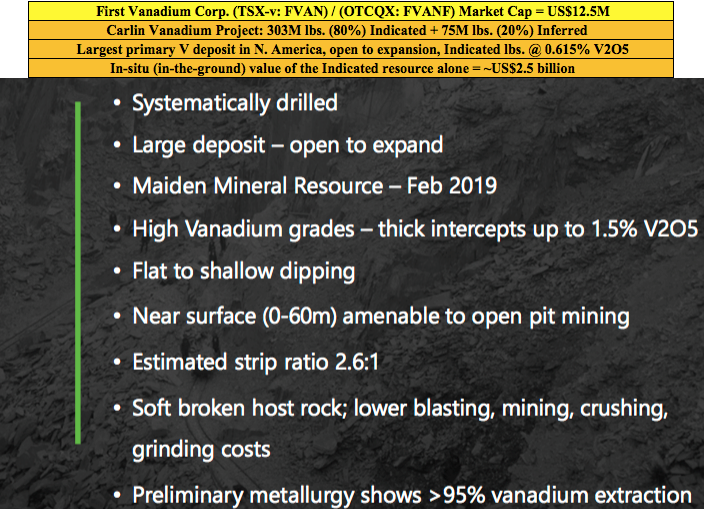
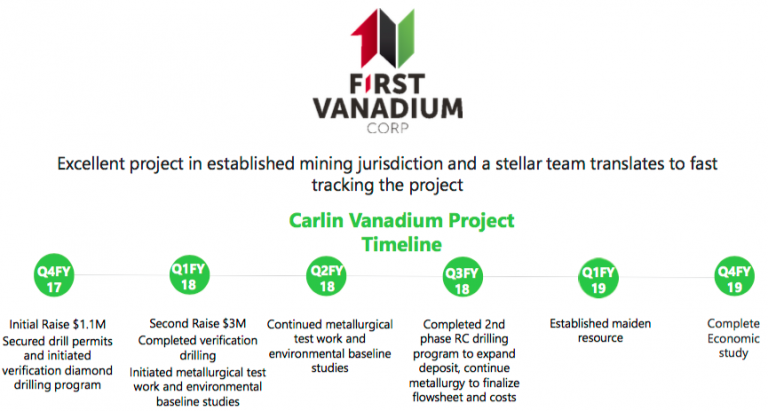
First Vanadium Corp. (TSX-V: FVAN) / (OTCQX: FVANF) has been under pressure, along with hundreds of battery metal juniors and the underlying metals including vanadium, cobalt, lithium. Even vanadium giant Largo Resources is down 61% from its 52-week high. Yet, if one believes in vanadium, it’s hard to ignore First Vanadium’s shares at C$0.44, down 78%! The pro forma Enterprise Value [market cap + debt – cash] is just US$12.8M. The Company has C$1.9M in cash.
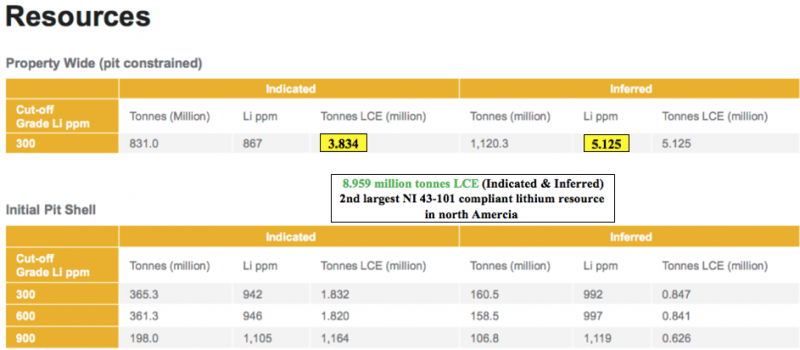
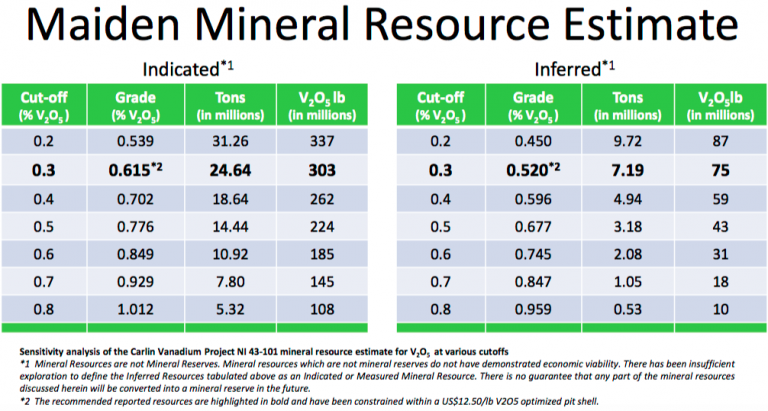
Yet, even at current vanadium pentoxide (“V2O5“) prices, the in-situ value of the Indicated-only portion (303 million pounds) of the Company’s estimated resource is ~US$2.5 billion. Management believes it has the largest high-grade primary vanadium resource in North America.
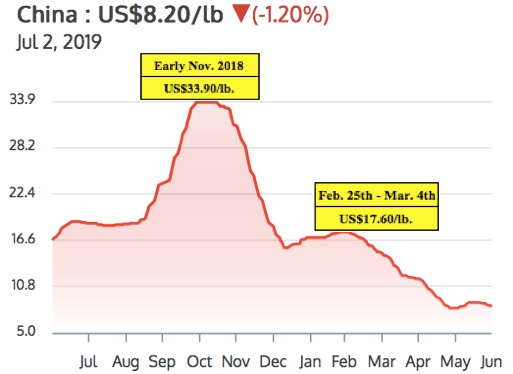
There has been a lot of weeping and gnashing of teeth over the V2O5 (China) price falling from a 2019 high of US$17.6 to its current US$8.2 per pound. But, as the saying goes, the cure to low prices is…. low prices. Few new projects make sense at today’s levels. I believe that V2O5 (China) between US$10-US$15 per pound might be a sweet spot, good for both producers and end users.
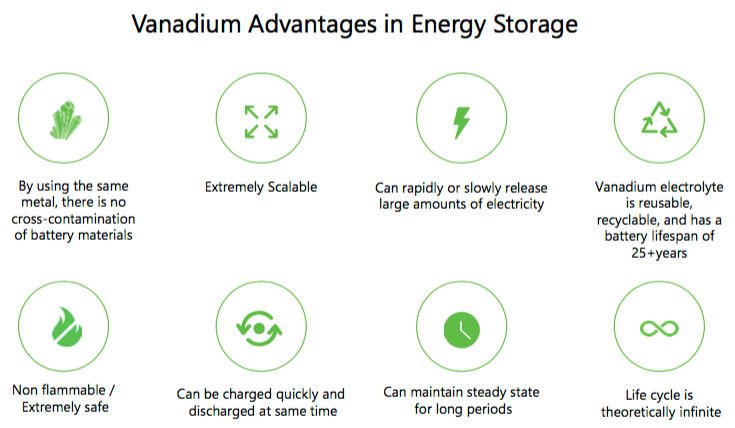
Steel companies can afford to pay higher prices for V2O5, but grid-scale, Vanadium Redox Flow Battery (“VRBs“) Energy Storage Systems (outside of China) might need prices below US$10/lb. to go mainstream. Importantly though, VRB plant costs are coming down. Vincent Sprenkle, a lead researcher at the U.S. Department of Energy’s Pacific Northwest National Laboratory, (“PNNL“) recently said, “VRB costs could be lowered by another 50%.” That would be very bullish for vanadium prices, it would allow for widespread adoption of VRBs even with V2O5 prices above US$10/lb.
First Vanadium has a sizable resource, a good grade, in a great jurisdiction. A Preliminary Economic Assessment (“PEA”) is expected by year end. The following interview of Paul Cowley, P.Geo., President, CEO & Director of First Vanadium, was conducted by phone & email between June 24th & July 2nd.
Please tell us about yourself and your team.
I’m an exploration geologist with 40 years’ experience in the discovery & evaluation of mineral deposits around the world. About half of my career was with a Major, BHP Minerals. I was involved in leading the team in the Canadian arctic that made 4 gold deposit discoveries that generated about 6 million ounces of gold. I also worked at Escondida and BHP’s Ekati diamond mine during their exploration days.
I’m a senior guy, but I’m the youngest of our group. The others have even more years of experience. We have two mining engineers that held mine general manager positions of very significant mines at Majors. We have four metallurgists that have worked for Majors, in senior roles. We have a construction engineer who’s built 20 mines in North & South America, he’s currently building Lundin’s mine in Ecuador.
What do you make of the recent volatility in the vanadium price?
Since early March 2019 the vanadium price has taken an unexpected turn lower. Prices are not responding to the bigger picture demand and supply imbalance. Chinese steel plants did not recharge their vanadium inventories in this period, as many expected they would, putting pressure on traders to liquidate at undercutting prices, but they will have to restock. The U.S.-China trade wars, and some shortfall of enforcement of new Chinese rebar standards, appear to have exacerbated the situation in the short term.
It’s our view that the fundamentals of demand in global steel applications will outstrip supply and should push vanadium prices higher again in the second half of the year, and beyond. Adding to the demand side is the exciting boom in solar & wind projects, all of which require battery storage. This is happening on so many levels around the world that we expect to see the vanadium battery carve out a healthy market share in this expanding renewable space. Some are calling the 2020’s, the Solar Decade.
Please explain the significance of the historical data you recently received, that extended the strike length by 300 meters to the south.
It means more potential than we had expected. From our drilling, the deposit appears to be open to expansion in several areas, but we did not expect the deposit to be open to the south. The newly acquired data demonstrates a 15% strike length increase to the south and it’s still open in that direction. This is exciting news as this data was not included in the resource estimate we put out in February.
You already have a 303 million pound vanadium resource (in-situ value of ~US$2.5 billion) in the Indicated category alone. Does the resource need to get any bigger?
That’s a good question. But it needs to be answered through an economic study. In our view, the resource is sizable. It’s currently the largest, highest-grade primary vanadium resource in North America. Our immediate priority is to demonstrate potential economic viability with what we have, knowing that we believe we could always make it bigger if and when we need to.
Several readers may assume that First Vanadium will need an expensive roaster in its operating flow sheet. What are your latest thoughts?
Not true. The path we are on with our metallurgical flow sheet does not include, or require, a roaster.
Although Nevada is the #1 global mining jurisdiction in the latest Fraser Institute Mining Survey, some complain that it takes a long time to get permits. What does your team expect in this regard?
In general, in the U.S. that is true, but not in Nevada. Nevada has a responsible review and process, but it’s a mining state. And, even more so for us now that vanadium is on the critical minerals list. The U.S. has unveiled its strategy in an effort to rebuild struggling domestic supply chains for metals & minerals it deems “critical” to the country’s manufacturing & defense sectors. Recently this was reiterated when President Trump & Prime Minister Trudeau announced a plan for the U.S. & Canada to collaborate on critical minerals.
What are the latest developments on the metallurgical front?
We continue to make strides on the metallurgical front. In April we announced an average of 95% vanadium extraction from the rock across the deposit, into solution. We do not know what ultimate recoveries will look like just yet, but we are making good progress. And, we’re making strides in the area of pre-concentration, with the aim to reduce the plant size, which would lower the capital intensity of the project.
What are First Vanadium’s plans for a Preliminary Economic Assessment (“PEA”)? Might that be a 1H 2020 event?
No, we think that we can move faster, our aim is to initiate a PEA in the 3rd quarter, with results to be reported before the end of the year.
Why should readers consider buying shares of First Vanadium?
I see very good value and upside; an exceptional senior technical team, a good share structure and a great project. We now have C$1.9 million in cash with the recent private placement closing, and 42.4 million shares. Our share price now is where it was at the beginning of 2018! Yet, we have delivered two successful drill campaigns, a mineral resource with considerably higher grades, and more metal in the ground than our historical resource, and 80% (303 million pounds) of it is in the Indicated category.
That, plus positive metallurgical test work and environmental baseline studies to advance permitting. If one is bullish on the vanadium price, currently at US$8.20/lb., then First Vanadium’s (TSX-V: FVAN) / (OTCQX: FVANF) project in the #1 of 84 ranked global jurisdiction of Nevada should be high on the list of projects to consider investing in.
Thank you Paul, very interesting and timely commentary on the vanadium market and on First Vanadium. I look forward to seeing a PEA later this year!
Peter Epstein
Epstein Research
July 9, 2019
Disclosures: The content of this interview is for information only. Readers fully understand and agree that nothing contained herein, written by Peter Epstein of Epstein Research [ER], (together, [ER]) about First Vanadium Corp., including, but not limited to, commentary, opinions, views, assumptions, reported facts, calculations, etc. is not to be considered implicit or explicit investment advice. Nothing contained herein is a recommendation or solicitation to buy or sell any security. [ER] is not responsible under any circumstances for investment actions taken by the reader. [ER] has never been, and is not currently, a registered or licensed financial advisor or broker/dealer, investment advisor, stockbroker, trader, money manager, compliance or legal officer, and does not perform market making activities. [ER] is not directly employed by any company, group, organization, party or person. The shares of First Vanadium Corp. are highly speculative, not suitable for all investors. Readers understand and agree that investments in small cap stocks can result in a 100% loss of invested funds. It is assumed and agreed upon by readers that they will consult with their own licensed or registered financial advisors before making any investment decisions.
At the time this article was posted, Peter Epstein owned no shares of First Vanadium Corp. and the Company was an advertiser on [ER].
Readers understand and agree that they must conduct their own due diligence above and beyond reading this article. While the author believes he’s diligent in screening out companies that, for any reasons, are unattractive investment opportunities, he cannot guarantee that his efforts will (or have been) successful. [ER] is not responsible for any perceived, or actual, errors including, but not limited to, commentary, opinions, views, assumptions, reported facts, financial calculations, etc., or for the completeness of this interview or future content. [ER] is not expected or required to subsequently follow or cover events & news, or write about any particular company. [ER] is not an expert in any company, industry sector or investment topic.
The gold miners’ stocks just blasted higher to a major decisive breakout this week! Driven by gold’s own huge bull-market breakout, the gold stocks surged well above vexing years-old upper resistance. The resulting new multi-year highs are a game changer, starting to shift long-apathetic sector sentiment back towards bullish. This will increasingly attract back traders, with their buying unleashing a virtuous circle of gains.
Traders usually track gold-stock fortunes with this sector’s most-popular exchange-traded fund, the GDX VanEck Vectors Gold Miners ETF. Launched in May 2006, this was the original gold-stock ETF. That big first-mover advantage has helped propel GDX to sector dominance. This week its net assets of $10.5b ran 44.6x larger than the next-biggest 1x-long major-gold-miners ETF! GDX is this sector’s leading benchmark.
And as recently as late May, neither speculators nor investors wanted anything to do with gold stocks. GDX slumped to $20.42 on May 29th, down 3.2% year-to-date. That was much worse than gold’s own slight 0.2% YTD decline then warranted. The gold stocks were really out of favor, largely ignored by apathetic traders. What a difference a month makes though, as their fortunes changed radically in June.
The gold miners started reanimating on May 31st, after Trump unleashed a bombshell warning to Mexico the evening before. He said tariffs would be imposed on all of its exports to the US if it didn’t seriously clamp down on illegal immigration across the US southern border. While Trump subsequently suspended those tariffs on Mexico’s promises to take action, that was the catalyzing event that awoke gold from its slumber.
A couple weeks ago I wrote an essay on the resulting mounting gold-stock upleg, explaining what was going on. But the developments since have been stunning, a colossal bullish surprise. Long neglected, GDX kept on marching higher mid-month leading into last week’s highly-anticipated Federal Open Market Committee decision. GDX closed at $23.67 the day before, already 15.9% higher in only several weeks.
The Fed kowtowed to stock traders’ hyper-dovish expectations and shifted its future rate bias from tightening to cutting, lighting a fire under gold. In last week’s essay I analyzed the gold bull breaking out, which was a momentous sea-change event. Gold rallied 1.0% to $1360 that day with top Fed officials forecasting a new rate cut next year. Gold-stock traders just shrugged at gold’s best close in 2.9 years.
They only bid GDX 1.4% higher to $24.00 after the Fed’s dovish shift. That only amplified gold’s gains by 1.4x, far short of the major gold stocks’ normal upside leverage to gold of 2x to 3x. While gold was high, it had tried and failed for years to break out above its $1350 resistance zone. And gold stocks suffered big and sharp selloffs after those previous forays proved unsuccessful. Traders didn’t expect this time to be different.
That Fed-Day evening New York time, Asian markets reopened as their Thursday morning rolled around. The Asian cultures have a deep cultural affinity for gold, and aggressively piled on in early trading. All that buying catapulted gold from $1358 to $1383 in about an hour! Partially thanks to Iran shooting down a big and sophisticated US surveillance drone overnight, gold’s Asia gains held in last Thursday’s U.S. trading.
Gold closed 2.1% higher that day at $1389, a decisive breakout 1%+ beyond its previous bull-market high of $1365 from way back in early July 2016! That also happened to be a 5.8-year closing high, so gold-stock traders realized big changes were afoot. They poured capital into gold stocks with a vengeance, catapulting GDX 4.4% higher on 3.5x its 3-month-average daily volume! That propelled it to $25.05 on close.
That was a critical technical level, as this GDX chart shows. It looks at the gold-stock price action of the last several years or so during gold’s own parallel bull market. GDX is rendered in blue, its key 50-day and 200-day moving averages in white and black, and 2.5-standard-deviation bands in light yellow. This leading gold-stock ETF had to decisively best years-old upper resistance at $25 to prove this time is different.
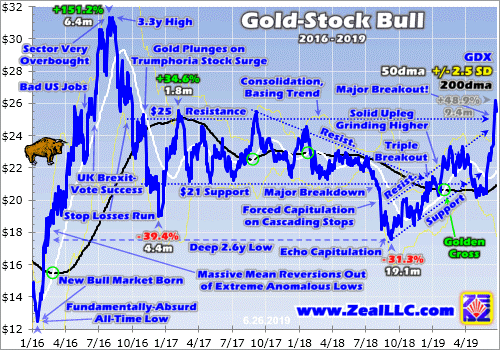
Since late 2016, GDX has largely been trapped in a giant consolidation basing trend running from $21 support to $25 resistance. $25 had proven a graveyard in the sky for gold stocks since November 2016, and needed to be overcome to change bearish psychology. GDX’s $25.05 close last Thursday on that new secular gold high was right there. But $25 resistance had to be broken decisively to impress traders.
Last Friday gold climbed another 0.7% to $1399 on pure momentum, yet gold-stock traders were worrying again. So GDX’s resulting 0.6% rally was pathetic, actually lagging gold. While not a decisive breakout over $25.25, or 1% above that long-vexing resistance line, GDX’s $25.21 close was darned close. The major gold stocks as measured by this ETF hadn’t been higher in 21.4 months. That was certainly bullish.
Last Friday and this Monday it was becoming evident that new-high psychology was taking root in gold. That is a powerful force motivating speculators and investors to buy. GDX $25 finally being materially surpassed has long been the key to unleashing this self-reinforcing sentiment in gold stocks. A couple weeks ago when GDX had merely climbed to $23.33 at best, I wrote about this coming critical breakout.
“The higher gold stocks climb, the more traders will want to buy them to ride that momentum. The more capital they deploy, the more gold stocks will rally. This normal virtuous circle of improving psychology and buying will become even more exaggerated as GDX $25 is surpassed. Seeing the highest gold-stock levels in several years will work wonders to improve sector sentiment, unleashing widespread bullishness.”
“This gold-stock upleg’s potential gains are massive spanning such a major upside breakout. Remember speculators and investors love chasing winners, so the higher gold stocks rally the more attractive they’ll look.” Nothing drives trader interest and thus capital inflows like major new highs. And GDX was right on the verge of entering that excitement-fueling zone decisively over $25 as markets opened for trading this week.
This Monday gold surged another 1.4% higher to a dazzling $1419 close! That new 6.1-year high was fueled by sheer momentum, there was little gold-moving news that day. Gold’s new-high psychology was already feeding on itself. And that enthusiasm spilled into gold stocks, with traders bidding GDX another 3.8% higher to $26.17. That was the long-awaited decisive $25 breakout, with GDX blasting 4.7% beyond!
The importance of gold stocks powering through to new 2.7-year highs cannot be overstated. Major new highs act like magnets attracting traders’ attention, interest, and capital. They prove that the long-ignored gold stocks are in bull-market-rallying mode again, portending massive gains to come. They also garner media coverage, which greatly increases the number of traders looking to ride the breakout momentum.
Since late May’s depressing low, GDX had rocketed a huge 28.2% higher in just 18 trading days! Stock traders would kill for those kinds of fast gains. And the major gold stocks’ upleg-to-date advance per this ETF had grown to 48.9% over 9.4 months. That would be impressive for any sector, but is actually still on the smaller side for the high-potential gold stocks. Their uplegs have tended to grow much larger in the past.
The last time gold was hitting new bull-market highs was in the first half of 2016. That was the maiden upleg of this bull, where gold soared 29.9% higher in just 6.7 months. The resulting excitement fueled a deluge of capital roaring into gold stocks, which skyrocketed GDX an incredible 151.2% higher in roughly that same span! While that upleg was exceptionally large, the last major gold-stock bull’s uplegs were big.
Before GDX came along, the primary gold-stock benchmark was the classic HUI NYSE Arca Gold BUGS Index. Like GDX it tracks most of the same major gold stocks, so HUI and GDX price action are usually indistinguishable. The last gold-stock bull straddling GDX’s birth saw the HUI soar 1664.4% higher over 10.8 years between November 2000 to September 2011! Those gains accrued over 12 separate uplegs.
One was an anomaly, the epic mean-reversion rebound after late 2008’s first-in-a-century stock panic. Excluding it, the other 11 normal gold-stock uplegs in that last bull averaged 80.7% gains over 7.9 months per the HUI! So GDX’s 48.9% upleg-to-date advance as of early this week remains well below precedent to be mature. Odds are it will grow much larger in line with past major uplegs before giving up its ghost.
Gold stocks paid a terrible price as gold drifted sideways over the last several years, trapped under that $1350 resistance zone which masked its in-progress bull. That’s why GDX mostly meandered between those $21 support and $25 resistance lines since late 2016. That chronic inability to break out to new highs gradually scared away the great majority of traders, leaving gold stocks incredibly undervalued.
Gold-stock prices are ultimately determined by gold, because it overwhelmingly drives their earnings. So one way to measure gold-stock “valuations” is looking at them relative to gold. This can be done using the GDX/GLD Ratio, the leading gold-stock ETF’s price divided by the flagship gold ETF’s price. That of course is the GLD SPDR Gold Shares. I last wrote about and analyzed the GGR in an early-February essay.
This Monday as GDX finally decisively broke above $25 to close at $26.17, GLD’s shares closed way up at $133.94. That made for a GGR of just 0.195x at the best gold-stock levels in several years. Yet that was still really low by historical standards. The last normal years for the gold market were arguably 2009 to 2012. That stretch was sandwiched between 2008’s stock panic and the Fed’s QE3 stock-market levitation.
The resulting extreme and irrational stock euphoria had a devastating impact on gold. But from 2009 to 2012 before markets became wildly central-bank-distorted and fake, the GDX/GLD ratio averaged 0.381x. That encompassed all kinds of gold environments, from strong bull to budding bear. So there’s no better recent span to approximate gold stocks’ “fair value” relative to gold. Applying that today is super-bullish.
At Monday’s $133.94 GLD close, that historical-average fair-value GGR would put GDX at $51.03. That is a whopping 95.0% higher than its actual close that day! Gold stocks are literally trading at just half of where they ought to be at today’s gold prices, meaning they still need to double just to catch up. And that doesn’t account for higher future gold prices or the GGR overshooting proportionally higher after mean reverting!
At best GDX has powered 151.2% higher within gold’s current bull. But during gold’s last secular bull, the HUI skyrocketed an astounding 1664.4% higher over 10.8 years! Gold stocks are one of the highest-potential sectors in the entire stock markets. When they really start running the resulting gains can truly generate life-changing wealth. That’s why contrarians are willing to suffer between their mighty bull runs.
This week’s long-awaited GDX $25 breakout is a critical technical milestone that is likely signaling much-bigger gains to come. The gold-stock surge this month is really special, actually the strongest early-summer performance for this sector in modern gold-bull history! Normally this time of year I’d be updating my gold-summer-doldrums research, highlighting the weakest time of the year seasonally for gold stocks.
Hopefully I can find time next week. This chart looks at the HUI’s average summer performances in all modern gold-bull-market years. Each summer is individually indexed to its final close in May, keeping gold-stock price action perfectly comparable regardless of prevailing gold levels. The yellow lines show 2001 to 2012 and 2016 to 2017. Last year’s summer gold-stock action is rendered in light blue for comparison.
All these lines averaged together form the red one, revealing the center-mass drift trend of gold stocks in market summers. Gold stocks’ current 2019 summer action is superimposed over all that in dark blue. As you can see, this past month’s action is the best summer start gold stocks have seen since at least 2001! They are even tracking better than the summer of 2016 in this gold bull’s mighty maiden upleg.
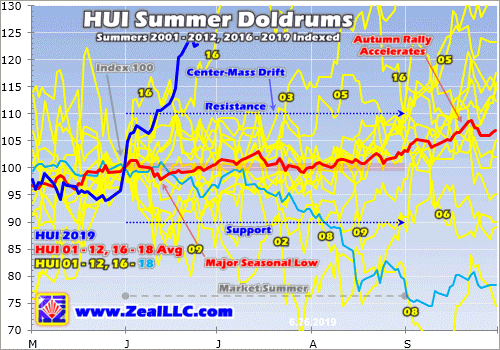
This chart really illuminates how unique gold stocks’ powerful June rally has been. This is more evidence that a sea-change sentiment shift is underway in this long-neglected sector. That sure implies the gains to come will be much larger than traders expect, driving GDX towards its own new bull highs on balance. In early August 2016, GDX hit its bull-to-date high of $31.32. That’s 19.7% higher than Monday’s breakout close.
The major gold miners’ fundamentals remain strong and bullish too, supporting much-higher stock prices. After every quarterly earnings season, I dig deep into the GDX gold miners’ fundamentals. They finished reporting their latest Q1’19 results about 6 weeks ago, and I wrote a comprehensive essay analyzing them. At that point GDX was still really out of favor, languishing under its $21 multi-year support line.
Stock prices are ultimately determined by underlying corporate earnings, and for the gold miners that is totally dependent on prevailing gold prices. Gold-mining costs are best measured in all-in-sustaining-cost terms. In Q1’19 the GDX gold miners’ AISCs averaged $893 per ounce. That’s right in line with the prior four quarters’ trend of $884, $856, $877, and $889. Gold-mining profits are going to soar with higher gold.
Gold averaged $1303 in Q1 when the major gold miners were producing it for $893. That implies they were earning $410 per ounce mined. $1400 and $1500 gold are only 7.4% and 15.1% higher from there. As the GDX gold miners’ AISCs reveal, gold-mining costs are largely fixed from quarter to quarter and don’t follow gold higher. So assuming flat AISCs, gold-mining profits surge to $507 at $1400 and $607 at $1500.
That’s 23.7% and 48.0% higher from Q1’19 levels on mere 7.4% and 15.1% gold gains from that quarter’s average price! And as of earlier this week, gold had already climbed 9.2% of that. The major gold miners’ fundamentals are already bullish, but improve greatly at higher prevailing gold prices. With earnings growth hard to come by in general stock markets this year, the gold stocks will be even more alluring.
All the stars are aligning for big gold-stock gains in coming months, with their technicals, sentiment, and fundamentals all looking very bullish. This breaking-out gold-stock upleg has excellent potential to grow much larger later this year, greatly rewarding contrarians buying in early. More and more traders are becoming aware of this sector’s huge potential, and their buying will push the gold stocks much higher.
This is not the summer to check out, but to do your homework and get deployed in great gold stocks. All portfolios need a 10% allocation in gold and its miners’ stocks! Many smaller mid-tier and junior miners have superior fundamentals and upside potential to the majors of GDX. And by the time gold stocks get really exciting again hitting their own new bull highs, much of the easy gains will have already been won.
One of my core missions at Zeal is relentlessly studying the gold-stock world to uncover the stocks with superior fundamentals and upside potential. The trading books in both our popular weekly and monthly newsletters are currently full of these better gold and silver miners. Mostly added in recent months as gold stocks recovered from selloffs, their unrealized gains were already running as high as +109% this week!
If you want to multiply your capital in the markets, you have to stay informed. Our newsletters are a great way, easy to read and affordable. They draw on my vast experience, knowledge, wisdom, and ongoing research to explain what’s going on in the markets, why, and how to trade them with specific stocks. As of Q1 we’ve recommended and realized 1089 newsletter stock trades since 2001, averaging annualized realized gains of +15.8%! That’s nearly double the long-term stock-market average. Subscribe today and take advantage of our 20%-off summer-doldrums sale!
The bottom line is gold stocks have joined gold with their own decisive breakout! GDX finally burst back above its long-oppressing $25 upper-resistance line this week. These multi-year highs are a game changer for gold stocks, ushering back long-absent bullish psychology enticing traders to return. They’ve been gone for so long that this entire gold-mining sector is deeply undervalued relative to prevailing gold prices.
That portends huge upside potential as gold and its miners’ stocks return to the limelight on their major breakouts. Traders love chasing winners to ride their upside momentum, and buying begets buying. Of course gold-stock uplegs don’t power higher in straight lines, periodic selloffs to rebalance sentiment are normal and healthy. So any material gold-stock weakness should be used to accumulate sizable positions.
Adam Hamilton, CPA
June 28, 2019
Copyright 2000 – 2019 Zeal LLC (www.ZealLLC.com
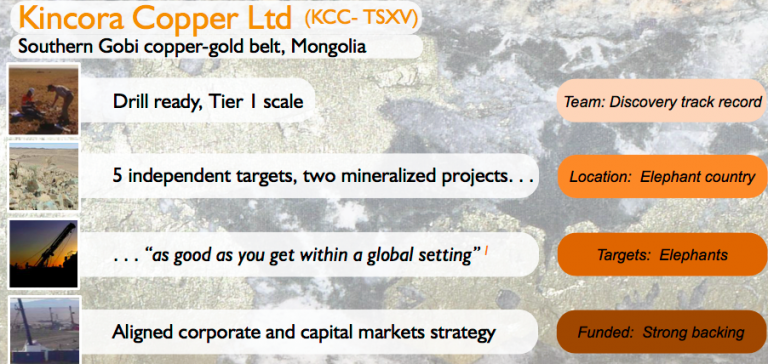
Kincora Copper [TSX-V: KCC] fell off investor’s radar screens due to an extended period of inactivity in 2018, but now the Company is cashed up, team in place, and ready for extensive drilling at 5 independent, large-scale porphyry targets with a 12-month funded budget for up to 18,000 m of drilling.
Kincora has been operating in Mongolia for > 8 years. In 2016, the Company secured unencumbered access to its promising Bronze Fox project and consolidated the dominant landholding in the Southern Gobi copper-gold belt, between and on strike with Rio Tinto’s Oyu Tolgoi (“OT“) copper-gold mine, and the Tsagaan Suvarga porphyry project, via the merger with IBEX, a private vehicle indirectly controlled by Robert Friedland.
This attracted a world-class technical team, credited with multiple discoveries of Tier 1 copper deposits, looking to repeat such successes. Since then, the Company has been executing the first modern systematic exploration program across a district-scale landholding in a highly mineralized, but vastly under-explored copper-gold porphyry belt. Now, drilling is just days away.
These are exciting times for Kincora, the most exciting in the Company’s history. The Company is in a prime position in the copper sector where new discoveries are being well rewarded and successful juniors acquired at significant premiums. For example, just this week Australian-listed MOD Resources was taken out by a billion-dollar market cap Sandfire Resources.
A new cornerstone investor, HK-based New Prospect, now the 2nd largest shareholder with about 12% of the Company, is a natural resource specialist fund with an extensive global network. LIM Advisors remains the largest investor, one of the longest operating alternative investment managers in Asia, they invest across the capital structure in deep value & special situations.
Investors in small cap natural resource stocks know that the best time to be in a junior is right before a BIG discovery. That’s the time we could be at right now with Kincora. Management just raised $6.25M. Will there be a new discovery! More than one!! None!!! Yes, there could definitively be zero new discoveries…. This is a highly speculative situation, but backed by a team that has an excellent track record of large discoveries.
Even without blockbuster discoveries, the Company has planned a very detailed and well thought-out drill program that’s sure to cover a lot of bases and provide a pipeline of news flow over the next 12 months. Raising $6.25M in a very tough market at a $7M pre-money valuation was a BIG success in and of itself, demonstrating the strength of management, the projects / targets and the massive opportunity.
The de-risking capital raise is strong evidence of the belief by cornerstone investors & seasoned management that Mongolia is a great place to, potentially, make the newest globally significant copper discovery since 2014. To learn more, please continue reading this Interview of Sam Spring, President & CEO of Kincora Copper [TSX-V: KCC].
Can you talk about how we got to the point of a substantial drill program starting very soon?
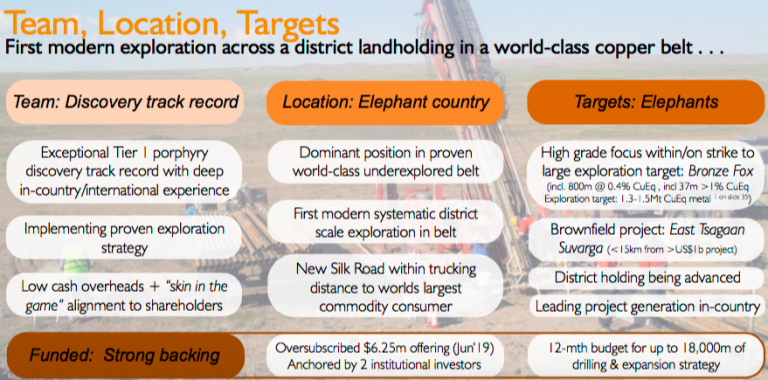
After 2018 being a transitional year of setting the right corporate foundations for success, we are entering an exciting period where the drill bit will drive Kincora’s valuation once again. This month we will commence an aggressive, multiple rig, fully-funded drill program. The focus is discoveries on 5 large, independent copper porphyry targets on our 100%-owned Bronze Fox and East Tsagaan Suvarga (“East TS”) projects.
This will be the first drill program conducted by our industry-leading technical team, who have found multiple Tier 1 copper assets. For the last 3 years, we have undertaken the first modern, district-scale, exploration across this vastly mineralized, but significantly under-explored Southern Gobi copper-gold belt.
As readers may know, there are 2 large-scale porphyry projects in this region. Rio Tinto / Turquoise Hill Resources’ Oyu Tolgoi open pit mine and underground development project, and a privately-held open pit development project called Tsagaan Suvarga. We believe there are more globally significant copper discoveries to be found.
Limited drilling supports our Bronze Fox project potentially hosting an independently defined, conceptual exploration target of 1.3 to 1.5 M tonnes (midpoint = 3.086 billion Cu Eq. pounds). That would be an in-situ value of $11 billion (1.32 CAD/USD, US$2.70/lb. Cu).
The first hole of the program will, for the first time, correctly test a very large zone (previously drilled in the wrong direction). However, prior drilling still managed to intersect 37 m at > 1% Cu Eq., within 864 m of 0.38% Cu Eq.
Our East TS project sits in the shadows of a billion-dollar open pit construction project at Tsagaan Suvarga (“TS”). Within this brownfield setting, we’re drilling 3 separate targets that are the closet analogues to the high-grade ore bodies at OT…. since OT! While just targets, readers should understand that what we’re exploring for is large and in a very favorable location and geological setting. OT’s ongoing underground expansion is the largest hard rock mining project in the world. It could become the 3rd largest copper mine on the planet, with a 100-year+ mine life.
Kincora was formed in 2011, but we are in the strongest position today that the Company has ever been in. Yet, our current market cap of $12M, (with $6M cash!) is a fraction of our peak valuation of nearly $50M. At that time, we had attracted a buyout offer for the Company and had signed 14 NDA’s with interested parties.
While naturally I’m biased, I think it would be hard to find many juniors with similar risk/return profiles and multiple near-term catalysts, backed by a world-class management, Board, Technical team, Advisors and key shareholders, trading at such a low valuation.
With the Company shortly ramping up drilling of our existing exploration portfolio, and focused on ongoing expansion opportunities, Kincora is the most active foreign-listed junior seeking to make the next Tier 1 discovery in Mongolia.
You just closed on a $6.25M capital raise in a very difficult market. Who were the key investors in this very important round?
~60% was taken up by 2 large natural resource funds and associated groups, who will represent > 40% of Kincora’s shares going forward. These groups, LIM Advisors & New Prospect Capital are both Hong Kong based funds and have a track record investing in Mongolia.
In total, there were > 30 investors in the deal, with strong Board / management participation and good support from high-quality sophisticated investors. As you can imagine, given current market conditions, a lot of work went into this raise. We truly appreciate the vote of confidence from those who invested.
How much of that $6.25M will go towards exploration? Please describe the upcoming drill program.
The vast majority will support Kincora undertaking the most aggressive exploration & discovery drill program anywhere in Mongolia this year. ~$5M will cover up to 18,000 m of drilling at Bronze Fox & East TS, plus project generation activities and advancing earlier-stage exploration targets.
Mongolia has unique geological potential to host globally significant discoveries, and that is what we are focusing on. This raising, with the accompanying warrant package, aligns our capital markets strategy with our exploration & expansion plans and gives us a good shot (but no certainty) at making new discoveries.
We are on record stating that these drill targets are, ‘as good as you get within a global setting for their respective stages’. The key driver in the next 12 months is proof of high-grade & our geological concepts, to confirm our models & interpretations with positive drill results.
In addition to your management team & Board, please describe recent due diligence done by independent advisors, consultants & analysts. Didn’t your largest shareholder also commission a study?
Our drill strategy is the culmination of almost 30 years’ copper exploration experience in this belt by senior members of our team, 5 years of exploration work and model refinements by ourselves and previous owners (including Ivanhoe Mines and IBEX) that provide us with strong conviction to focus on the selected 5 targets.
Kincora has been through 5 technical reviews since mid-2017, including from 1) a leading natural resource private equity group, 2) the EBRD, 3/4) LIM Advisors (twice) and 5) New Prospect Capital, all of which have resulted in capital being invested.
As you have picked up on Peter, our largest shareholder commissioned an independent technical review of our targets, work programs and strategy before becoming a cornerstone investor in our latest offering. This review suggested a, ‘discovery’ had already been made at Bronze Fox within the under-explored target zone to the west of a key regional fault in an area we are calling West West Kasulu. This is where the first drill hole will go. In the independent consultant’s opinion, this target area has been significantly upgraded by recent exploration activities.
While we are optimistic, and management participated in the recent raising, and have undertaken detailed systematic exploration, there’s nothing left to do but drill these targets. Please let me reiterate that Kincora is a high-risk, exploration play. Hence, there are high rewards for success.
A risk is that it might cost tens of millions to delineate an attractive NI 43-101 compliant resource. What is your team’s goal for the upcoming drill program, can you articulate what success might look like?
Absolutely. We appreciate the fact that porphyries are capital intensive, and that exploration is very risky. More meters of drilling provide us a better chance of confirming our geological concepts and riding the value creation curve for shareholders.
The best recent example of a large-scale copper porphyry discovery is that of SolGold at its Alpala project in Ecuador. The deposit at Alpala is deep, so drilling costs there are significantly more than in Mongolia. In March 2016, SolGold raised A$5.7 million at 2.3p/share, having drilled 13 promising holes and seeking to confirm its discovery. An equivalent drill program to what Kincora is now looking to complete at our 2 projects. They had fantastic results…. Over the course of 31 months, SolGold drilled a further 54 holes, attracted both Newcrest and BHP as strategic investors, and re-rated 20x for shareholders.
That’s what success at the target-testing phase of drilling can result in, even in difficult capital markets and a flat/decreasing copper price environment, which we believe is temporary.
At Bronze Fox, our drill campaign is designed to advance the strike potential away from the fault to the west, demonstrate the interpreted, significant increase in tonnage & grade potential, and confirm a new discovery. Prior higher-grade intersections include 3 of 4 holes drilled by Kincora that returned > 1% Cu and/or Cu Eq., incl. the best hole, F62, which hosted 13 m of 1.15% Cu / 1.41% Cu Eq., within 37 m at 0.83% Cu / 1.04% Cu Eq. and 864 m at 0.38% Cu Eq.
At our East TS, the geological concept we are seeking to confirm is that OT-style mineralization is present. Each of the 3 targets at East TS have large-scale potential, with individual coincident geophysical anomalies equivalent in size to ore bodies at OT and SolGold’s Alpala project.
While more conceptual and risky than the 2 targets at Bronze Fox, such a setting and scale of targets is unique – if located in more established copper districts around the world — it’s likely the area around TS & East TS would have already seen extensive drilling.
A rule of thumb for porphyry discoveries is that ~50,000 m of drilling generally provides visibility for ~5M tonnes Cu Eq. metal. Exercise of the warrants that were part of the recent offering would bring in an additional $15M (2.5x the recent raising), and enable another 100,000 meters of drilling.
There are many Copper bulls, yet the price at US$2.70/pound is half of what some bulls think is coming. Do you have a view on the Copper price?
A good question, we get asked that a lot. I will leave the forecasting to the experts, but we’re noticing that most investors see the writing on the wall. Like us, they believe the supply side will at some point (perhaps soon?) struggle to meet even average-trend demand growth, let alone any acceleration from increasing global electrification. This theme is being picked up by generalist investors as well, who have noticed what an unexpected supply shock has done to the iron ore price this year.
Regarding the industry players (mid-tiers & Majors), there has been a notable, but quiet, shift towards looking at new growth projects again over the last 18 months. BHP & Rio Tinto are even talking about organic exploration success stories, focusing on copper as a preferred commodity for expansion. That said, we are just starting to see more of the traditional miners expand into earlier stage projects to rebuild their pipelines.
Time will tell, but I certainly think that even at current copper prices, if we find what we’re looking for, there will be significant interest in Kincora. A tailwind from rising copper prices would of course be welcomed, but given the lack of exploration success industry-wide, globally, for many years now, the project pipeline is in great need of new, sizable discoveries. That is what we believe Mongolia and our targets offer investors.
Please talk about Mongolia, some readers probably won’t invest there. What do you tell investors, shareholders, prospective investors — about Mongolia country risk?
At the time I joined Kincora in 2012, Mongolia was the fastest growing economy in the world. This was driven by the first phase emergence of delivering previously untapped resources to international markets.
This emergence meant that at the time it was almost mandatory for coal & copper Majors to be seeking entry into the southern Gobi regions, with product trucked to the world’s largest consumer of both commodities. We are 5 Prime Ministers, 2 governments, a number of high profile disputes and reversals to unfavorable investment laws later, but the rocks and big picture potential remain unchanged.
In a landscape of few significant greenfield projects recently being commissioned, OT is proof of concept that Mongolia is a mature mining jurisdiction. OT is the largest development project in Mongolia’s history. It’s expected to account for up to a third of Mongolia’s GDP by the mid 2020s. It paves the way for companies like ours by lowering barriers to entry and we and others greatly benefit from newly built regional infrastructure.
When one looks at other copper jurisdictions, it’s becoming harder and more expensive to operate. Chile’s 2018 copper output was greater than the 2nd, 3rd & 4th largest country producers combined. The multi-billion-dollar cap-ex profile for Chile’s Codelco, just to keep production flat, shows the increasing challenges regarding water, community relations & high altitude, not to mention a declining copper grade!
Many other large copper supply regions are also difficult and/or increasingly difficult to operate in; look at recent developments in the DRC, China, Panama, Russia, Zambia, Indonesia, PNG, etc.
Given the team and operational track record we have at Kincora Copper [TSX-V: KCC] we are eyes wide open to the risk/reward scenario in Mongolia, which we find compelling, exploring for the next globally significant copper discovery.
Your readers should stay tuned for drill results, which should start arriving in 5-6 weeks’ time. We expect results to be ongoing for the rest of the year.
Thank you Sam, I think we covered a lot of ground. Bottom line, drill results will define Kincora Copper going forward, and a lot of smart money is betting on good drill results between now and year end.
Peter Epstein
Epstein Research
June 27, 2019
Disclosures: The content of this interview is for information only. Readers fully understand and agree that nothing contained herein, written by Peter Epstein of Epstein Research [ER], (together, [ER]) about Kincora Copper including but not limited to, commentary, opinions, views, assumptions, reported facts, calculations, etc. is not to be considered implicit or explicit investment advice. Nothing contained herein is a recommendation or solicitation to buy or sell any security. [ER] is not responsible under any circumstances for investment actions taken by the reader. [ER] has never been, and is not currently, a registered or licensed financial advisor or broker/dealer, investment advisor, stockbroker, trader, money manager, compliance or legal officer, and does not perform market making activities. [ER] is not directly employed by any company, group, organization, party or person. The shares of Kincora Copper are highly speculative, not suitable for all investors. Readers understand and agree that investments in small cap stocks can result in a 100% loss of invested funds. It is assumed and agreed upon by readers that they will consult with their own licensed or registered financial advisors before making any investment decisions.
At the time this interview was posted, Peter Epstein owns shares in Kincora Copper, and it was an advertiser on [ER].
Readers understand and agree that they must conduct their own due diligence above and beyond reading this article. While the author believes he’s diligent in screening out companies that, for any reasons whatsoever, are unattractive investment opportunities, he cannot guarantee that his efforts will (or have been) successful. [ER] is not responsible for any perceived, or actual, errors including, but not limited to, commentary, opinions, views, assumptions, reported facts & financial calculations, or for the completeness of this article or future content. [ER] is not expected or required to subsequently follow or cover events & news, or write about any particular company or topic. [ER] is not an expert in any company, industry sector or investment topic.
- A lot of Americans getting a myriad of government entitlements thought that President Trump would recreate the 1950s for them.
- If Trump had eliminated the PIT (personal income tax), capital gains tax, and corporate income tax, I’ve estimated that around $100 trillion in capital would have surged into America.
- That would have created a super-sized version of what Switzerland achieved at its peak.
- Sadly, Trump and his team didn’t do that, mainly because they are giving the citizens what they want; bigger government, more debt, and more storytelling.
- To understand what is likely coming next for America, please click here now. Mike Wilson does a near-perfect job of outlining what I believe is in store for H2 of 2019.
- Yesterday, Goldman Sachs’ chief economist was quite adamant that the consensus prediction of three rate cuts in the second half of this year would go awry, and the Fed will not cut at all.
- The risks are clearly rising for U.S. stock market investors.
- My biggest concern is that many Americans sold a lot of their gold stocks into the lows and are now aggressively buying the US stock market. The size of their buying is quite large.
- Unfortunately, their buying appears to be based mostly on Trump’s frequent “Let’s make America great!” pump-up tweets, rather than prudent study of the business cycle.
- The U.S. business cycle is very late stage now, and that’s when investors must reduce stock market exposure and increase exposure to gold!
- Having said that, please click here now. Double-click to enlarge this TQQQ triple-leveraged Nasdaq ETF chart.
- Almost 80% of mainstream stock market analysts predict the Fed will cut in July. If they are correct, the stock market will likely soar to new highs. If they are wrong, the market likely begins crashing at the start of August.
- A lot of stocks in the Dow Jones Industrials index are already at new highs, and that’s usually a sign that the indexes will make new highs too, regardless of whether a crash follows soon after that. I think new highs for the indexes occurs ahead of the July Fed meeting. That meeting also likely marks the final bull market peak for the U.S. stock market.
- At my https://guswinger.com swing trade service, we are long the stock market via TQQQ. My system is mechanical; I am always either long or short the Nasdaq via TQQQ/SQQQ. I’m also always long or short gold stocks via NUGT/DUST.
- Even if the Fed doesn’t cut rates at the July 31 meeting, the market has about six weeks to keep rallying before getting disappointed by the Fed’s decision.
- Also, I would not rule out a rate cut, because the Fed has tended to support the stock market whenever it gets into trouble. The Fed has also tended to support the U.S. government with lower rates when the government wants to borrow a lot of money.
- What about gold? Well, I suggested that investors should brace themselves for a pullback from $1350. That’s clearly in play this week as the stock market rallies. Also, Indian dealers have reduced their buying after the big gold price surge.
- Please click here now. Double-click to enlarge this daily gold chart. The most impressive event in the rally from the $1272 area is the creation of a new up channel!
- A range trade for gold is likely now. I think it will be in the $1310-$1350 area, although a wider range of $1292-$1350 is also possible. I’m happily short gold stocks at my swing trade service via DUST/JDST after a big NUGT/JNUG win, but I do expect some gold stocks to keep rallying even as gold consolidates in the trading range.
- On that note, please click here now. Double-click to enlarge this Kirkland Lake chart. My swing trade subscribers and I hold call options on this great company. The stock is trading above its February high while most gold stocks are not. This kind of outperformance is what I look for when considering a call options position.
- As GDX tumbled yesterday, Kirkland rallied higher!
- Speaking of GDX, please click here now. Double-click to enlarge. The entire pullback from February is starting to look like a giant flag pattern. The price target of the pattern is about $29.
- Please click here now. Double-click to enlarge. That’s a second look at the GDX chart. Any consolidation that occurs now will build a H&S bull continuation pattern as well as more flag-like price action.
- The July Fed meeting (which occurs as the gold love trade strong demand season begins) could create a stock market inferno and a gold stocks “Rally to the stars”. The bottom line: Investors who pare their stock market exposure as the US business cycle matures and increase their exposure to gold stocks are clearly acting with professionalism and prudence!
Special Offer For Website Readers: Please send me an Email to freereports4@gracelandupdates.com and I’ll send you my free “Golden Junior Giants!” report. I highlight key junior miners that are outperforming in this gold price consolidation zone, with key buy and sell tactics for each stock!
Thanks!!
Cheers
Stewart Thomson
Graceland Updates written daily between 4am-7am. They are sent out around 8am-9am. The newsletter is attractively priced and the format is a unique numbered point form. Giving clarity of each point and saving valuable reading time.
Risks, Disclaimers, Legal
Stewart Thomson is no longer an investment advisor. The information provided by Stewart and Graceland Updates is for general information purposes only. Before taking any action on any investment, it is imperative that you consult with multiple properly licensed, experienced and qualified investment advisors and get numerous opinions before taking any action. Your minimum risk on any investment in the world is: 100% loss of all your money. You may be taking or preparing to take leveraged positions in investments and not know it, exposing yourself to unlimited risks. This is highly concerning if you are an investor in any derivatives products. There is an approx $700 trillion OTC Derivatives Iceberg with a tiny portion written off officially. The bottom line:
Are You Prepared?
Gold surged sharply over the past week or so, nearing a major bull-market breakout! Nearly everyone was surprised by this violent awakening, which erupted suddenly as gold languished around year-to-date lows. If this dramatic rally has staying power, gold has good odds of achieving decisive new bull-market highs. That would change everything psychologically, ushering gold and its miners’ stocks back into favor.
Gold has largely flown under traders’ radars this year, mostly drowning in apathy. Actually this unique asset had a strong start, climbing 4.6% year-to-date by mid-February to hit $1341. While merely a 10.1-month high, gold was close to a major bull-market breakout. For several years now, gold has faced stiff resistance around $1350. It has repelled gold multiple times, looking like an impregnable Maginot Line.
But gold’s promising ascent was short-circuited from there, unleashing a disheartening slump over the next 10 weeks or so. By early May, gold had retreated 5.2% to $1271. The primary culprit was resurgent euphoria in the US stock markets. Equity exuberance has long proven gold’s mortal nemesis. When stock markets are high and expected to continue climbing on balance, gold investment demand often withers.
The recent gold action can’t be understood without the context of the US stock markets as represented by their flagship S&P 500 index (SPX). Heading into last September, the SPX was marching to a series of new all-time record highs. Since gold tends to climb when stock markets sell off, there was little demand for this essential portfolio diversifier. Why buy gold when stocks seem to do nothing but rally indefinitely?
That who-cares sentiment helped fuel all-time-record short selling in gold futures, hammering gold down to $1174 in mid-August for a 19.3-month low. Stuck in the shadows of euphoric stock markets, gold largely drifted sideways from there averaging $1197 until early October. But on October 10th, hyper-complacent stock traders were finally confronted with a serious selloff as the SPX plunged 3.3% that day alone.
Earlier hawkish comments from the Fed chairman were to blame. With stock markets bleeding, traders remembered gold. The world’s leading and dominant gold exchange-traded fund is the GLD SPDR Gold Shares. According to the latest data from the venerable World Gold Council, GLD’s 784.3 metric tons of gold bullion held in trust for its shareholders at the end of Q1’19 represented 31.6% of global gold ETFs’ total.
In early October with the SPX just fractionally under its recent record peak, GLD’s holdings slumped to a deep 2.6-year secular low of 730.2t. But a few trading days later as the SPX’s sudden and sharp plunge started to kill complacency, GLD enjoyed a big 1.2% holdings build. When stock traders buy GLD shares at a faster pace than gold itself is being bought, GLD’s managers equalize that excess demand by buying gold.
That SPX selloff snowballed into a severe near-bear correction, down 19.8% by Christmas Eve. With the stock markets burning, investors remembered the timeless wisdom of prudently diversifying their stock-heavy portfolios with counter-moving gold. It had rallied 8.1% in 4.3 months by the time a super-oversold SPX was ready to bounce. That gold upleg kept growing, ultimately extending to 14.2% gains by mid-February.
But as gold neared that major $1350 bull-market breakout then, stock euphoria came roaring back with a vengeance. The SPX had rocketed 18.2% higher out of its correction low by then, fueled by a radical shift back to dovishness by the Fed! It completely capitulated and caved to the stock markets, declaring that its quantitative-tightening monetary policy was open for adjustment in contrast to earlier statements on QT.
By that point the SPX had regained nearly 3/4ths of its total correction losses, so exuberant-again traders started to forget gold. Gold investment demand peaked in late January the day before the Fed gave in on QT, capping a 12.8% GLD-holdings build over 3.8 months. The higher the SPX rallied in recent months, the greater stock euphoria grew and the more gold was forgotten. Yet again stock euphoria stunted gold.
The SPX peaked at the end of April at another new all-time-record high. That extended its total monster-bounce rebound rally since late December to a colossal 25.3% in 4.2 months! A couple days later in early May with the SPX still near records, gold fell to that $1271 YTD low. Euphoric stock investors’ exodus from gold persisted another week, when GLD’s holdings slumped to 733.2t. That was down 11.0% in 3.3 months.
Gold failed to break out above its years-old $1350 resistance zone in mid-February because skyrocketing stock markets forced it back out of favor. Between late January and mid-May, fully 97% of GLD’s holdings build fueled by the SPX’s severe near-bear correction largely in Q4 had been erased! Just like late last summer, gold was again hostage to lofty euphoric stock markets. Investors wanted nothing to do with it.
But the SPX started rolling over again in May, slowly at first. It was shoved after Trump got fed up with China backtracking on nearly a year’s worth of trade negotiations with the US. On May 5th he warned that tariffs on $200b of annual Chinese imports would blast from 10% to 25% going effective the following Friday. That gradually drove the SPX lower into mid-May, including serious 1.7% and 2.4% down days.
So once again just like in October the last time the SPX rolled over hard, gold caught a bid. It rallied back up to $1299 in mid-May as investors again remembered stock markets can also fall. GLD’s holdings began modestly recovering as stock-market capital started slowly migrating back into gold. But that nascent trend reversed again in mid-May as stock markets bounced sharply higher, unleashing surging euphoria.
The primary driver of gold in recent years has been stock-market fortunes. Gold often falls out of favor when stock markets are high and rallying, then starts returning to favor when they sell off again. In a very real sense gold is the anti-stock trade. While it doesn’t only climb when stock markets weaken, that’s what mainstream investors remember gold for. Its investment demand is rarely strong near stock-market highs.
So gold again slumped back near $1273 by late May as the SPX rebounded, further demoralizing the few remaining contrarians. This metal felt pretty hopeless heading into its summer doldrums, its weakest time of the year seasonally. Then a Trump bombshell shocked stock traders out of their complacency. He warned the US was levying escalating tariffs on all Mexican imports to force Mexico to fight illegal immigration!
Last Friday May 31 was the first trading day after that surprise, and the SPX fell 1.3% to its lowest close since its all-time-record peak a month earlier. That extended its total recent selloff to 6.6%, so worries mounted. Gold had closed at $1288 in the prior day’s US trading session. Overnight after Trump’s tweet on Mexico tariffs gold rallied to $1297. That upside continued in the U.S., with gold closing 1.3% higher at $1305.
$1300 is a critical psychological line, heavily coloring sentiment especially among hyper-leveraged gold-futures speculators. They tend to buy aggressively when gold regains $1300 from below, and sell hard when gold breaks under $1300 from above. But while gold-futures trading heavily influences short-term gold price action, only sustained investment buying can ultimately grow gold uplegs to major status.
GLD’s holdings are the best daily proxy available of gold investment demand. And last Friday when gold surged, GLD merely saw a small 0.3% holdings build. American stock investors weren’t buying gold, it was the gold-futures speculators. These traders control far-less capital than investors, so their available buying firepower to push gold higher is limited. Gold uplegs never reach potential without investment demand.
The Asian markets were closed last Friday as gold rallied back over $1300 in the States. So when they opened again this past Monday June 3, Asian traders piled on to the gold buying. By the time the U.S. stock markets neared opening that day, gold was already up to $1317 in overnight trading. Once again that global momentum carried into the U.S. session, helping gold surge another 1.5% higher to $1325!
While great to see, that was still just a 3.2-month high. Without investment demand, gold’s new surge was unlikely to last very long on gold-futures buying alone. But something big changed that day in the U.S. markets. American stock traders, which had mostly shunned gold since late January, took notice. They started shifting capital back into gold via GLD shares in a major way, driving a huge 2.2% build in its holdings!
That was the biggest single-day percentage jump in this leading gold ETF’s holdings in 2.9 years, since early July 2016. That happened to be soon after the UK’s surprise pro-Brexit vote, when gold soared on the resulting uncertainty. While one day doesn’t make a trend, such a massive shift in gold investment buying is definitely attention-grabbing. If investors continue returning on balance, gold is heading way higher.
As this chart shows, gold is now within easy striking distance of a major bull-market breakout! It is not only nearing that vexing $1350 resistance zone, but has a high base from which to launch an assault. If gold-investment demand persists, gold doesn’t have far to run to hit new bull-to-date highs. Of course further stock-market weakness on balance would greatly help, but it’s not necessary with new-high psychology.
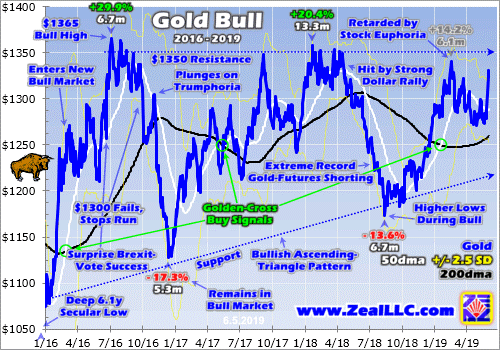
Blinded by apathy, not many traders realize gold still remains in a secular bull market. It was born from deep 6.1-year secular lows in mid-December 2015, the day after the Fed’s first rate hike in its latest tightening cycle. Over the next 6.7 months gold soared 29.9% higher in a massive upleg, entering new-bull-market territory at 20%+ gains. That left gold very overbought, so it crested at $1365 in early July 2016.
After strong bull-market uplegs big corrections are totally normal to rebalance sentiment, bleeding off the excessive greed at preceding highs. Gold consolidated high just under $1350 after that initial upleg, then fell to its 200-day moving average. It had resumed rallying in October 2016, but reversed sharply after Trump’s surprise election victory in early November. That pivotal event indirectly forced gold into a nosedive.
Gold plummeting in that election’s wake was the result of incredible euphoria, or Trumphoria at that time. Trump not only won the presidency, but Republicans controlled both chambers of Congress. So stock markets soared on hopes for big tax cuts soon. The SPX surged dramatically higher on truly-epic levels of euphoria, which in turn battered gold. Most investors shun gold when stock markets look awesome.
That greatly exacerbated gold’s normal correction to a monster 17.3% over 5.3 months! While very ugly and miserable, that remained shy of the 20%+ selloff necessary to qualify as a new bear market. Thus gold’s bull remained alive and well, albeit wounded by such a serious loss. Still gold recovered to power 20.4% higher over the next 13.3 months into early 2018, despite the SPX continuing to soar dramatically.
In late January 2018 gold peaked at $1358 just a couple days before the SPX’s own extremely-euphoric all-time-record high. While stock euphoria stunts gold investment demand, gold can still rally in lofty stock markets if it has sufficient capital-inflow momentum. But unfortunately buying was exhausted, then gold again consolidated high just under $1350 like it had done a couple summers earlier. It couldn’t break out.
A few months later gold was beaten down into another 13.6% correction over 6.7 months. It started on a sharp rally in the US dollar, which motivated gold-futures speculators to sell aggressively. Then the gold downside persisted on investors exiting as the SPX marched back up towards record highs after a sharp-yet-shallow-and-short 10.2% correction in early February 2018. Gold apathy and despair flared again.
But gold bottomed late last summer as extreme record gold-futures shorting exhausted itself, and started recovering higher again. That young upleg really accelerated when the SPX rolled over into that severe near-bear correction largely in Q4’18. That extended gold’s latest gains to 14.2% over 6.1 months as of that latest major interim high of $1341 in mid-February. Check out this gold bull’s resulting entire chart pattern.
After a strong start hitting $1365 several summers ago, gold couldn’t punch through to new bull highs. It tried several times, but stock-market euphoria and heavy gold-futures selling on U.S.-dollar strength kept batting it back down. Although gold couldn’t make new-high progress, it did carve a nice secular series of higher lows. While higher lows aren’t as exciting and attention-grabbing as higher highs, they are very bullish.
Flat highs combined with rising lows have created a gigantic ascending-triangle technical formation in gold over the past several years. That’s very clear above, gold coiling ever-tighter between climbing lower support and horizontal upper resistance. Ascending triangles are bullish chart patterns that are usually resolved with strong upside breakouts. Gold has spent recent years being accumulated behind the scenes.
No new bull-market highs along with gold being overshadowed by the stock markets surging to their own all-time-record highs in recent years has left this gold bull in stealth mode. Few investors realize it is still underway, and nearing a major bull-market breakout. But once that process become apparent, gold will quickly return to radars and become big financial news. Then gold enthusiasm will rapidly mushroom.
Any close over that vexing multi-year $1350 upper-resistance line will catch attention. But gold will have to break out decisively above there, exceeding $1350 by 1%+, to really attract the limelight. That would be $1364 gold. This Wednesday at the data cutoff for this essay, gold closed at $1331. That only left another 2.4% to climb to hit that decisive-breakout level. That’s trivial when investment capital is returning.
This gold bull’s first two uplegs averaged 25.2% gains. Today’s third upleg only ran 14.2% back in mid-February before the monster stock-market bounce’s extreme euphoria temporarily derailed it. All it would take for gold to extend to that key $1364 level is for this upleg to grow to 16.2%. That would still be modest, well behind the first two uplegs’ 29.9% and 20.4% gains. A decisive breakout is very close from here!
And once gold heads over its $1365 bull-to-date peak of July 2016, gold investment will start becoming popular again. Financial-media coverage will explode, and be overwhelmingly positive. Investors love chasing winners, and nothing motivates them to buy more than new bull-market highs. We’ve seen that in spades in the stock markets in recent years. Major buying from highs often becomes self-feeding.
The virtuous circle of inflows driven by new-high psychology can get very powerful. The more gold rallies, the more traders want to buy it to chase the momentum. The more they buy, the faster gold rallies. Gold hasn’t enjoyed positive capital-inflow dynamics like this since summer 2016. The potential gold upside from here as this unique investment returns to favor is big, supported by key tailwinds not enjoyed in years.
Starting from mid-August’s deep gold low, 20% and 30% total uplegs would catapult this metal way up to $1408 and $1526! Major new bull-market highs in gold would happen with a backdrop of dangerously-overvalued stock markets rolling over, greatly increasing the investment appeal of gold. And since the SPX is unlikely to keep surging to more record highs, stock euphoria shouldn’t arise to retard gold’s ascent.
The amount of gold buying investors need to do is staggering, as they are radically underinvested. Every investor needs a 10% portfolio allocation in gold and its miners’ stocks, period. Their current allocations to gold are virtually nonexistent per the leading proxy. For Americans it is the ratio between the total value of GLD’s gold-bullion holdings and all 500 SPX stocks’ collective market capitalizations. This is super-low.
At the end of April at the SPX’s latest peak, its stocks commanded a total $26,048.3b market cap. That is colossal beyond belief. Meanwhile GLD’s 746.7t of gold that day were only worth $30.8b at $1283. That implies American stock investors had a gold portfolio allocation around 0.12%, effectively nothing! Merely to boost that to even 0.5%, their gold holdings would have to quadruple. There’s vast potential for gold buying.
Another thing going in gold’s favor is the high U.S.-dollar levels. Its leading benchmark the U.S. Dollar Index hit 23.3-month highs in late April, then revisited those levels in late May. Gold-futures speculators tend to sell gold on a strengthening dollar and buy gold on a weakening dollar. The dollar is likely to drift lower in future months too, adding to gold’s momentum. The high dollar irks the Trump Administration, hurting U.S. exports.
So gold is nearing a major bull-market breakout that will change everything, wildly improving investors’ gold outlook and thus investment demand! The main beneficiary of higher gold prices will be the stocks of its miners. This chart shows the same gold-bull timeframe in the leading GDX VanEck Vectors Gold Miners ETF. I analyzed the latest Q1’19 fundamental results from its miners in depth just several weeks ago.
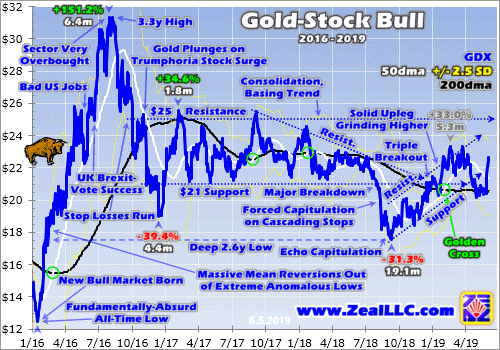
This article is focused on gold so I’ll discuss gold stocks in a future one. For our purposes today, note how GDX is positioning for a major breakout of its own above years-old $25 upper resistance. So far GDX’s current upleg is only 33.0% higher at best, small for this volatile high-potential sector. When gold powered 29.9% higher in essentially the first half of 2016, GDX amplified its gains with a monster 151.2% upleg!
So with gold on the verge of a major bull-market breakout, the beaten-down gold stocks are the place to be to greatly leverage gold’s upside. Since the gold-stock ETFs are burdened with underperformers at higher weightings, the best gains will be won in individual gold stocks with superior fundamentals. The kind of upside they can accrue during major gold uplegs is amazing, really multiplying wealth rapidly.
One of my core missions at Zeal is relentlessly studying the gold-stock world to uncover the stocks with superior fundamentals and upside potential. The trading books in both our popular weekly and monthly newsletters are currently full of these better gold and silver miners. Mostly added in recent months as gold stocks recovered from deep lows, their prices remain relatively low with big upside potential as gold rallies!
If you want to multiply your capital in the markets, you have to stay informed. Our newsletters are a great way, easy to read and affordable. They draw on my vast experience, knowledge, wisdom, and ongoing research to explain what’s going on in the markets, why, and how to trade them with specific stocks. As of Q1 we’ve recommended and realized 1089 newsletter stock trades since 2001, averaging annualized realized gains of +15.8%! That’s nearly double the long-term stock-market average. Subscribe today for just $12 per issue!
The bottom line is gold just surged near a major bull-market breakout. The $1350 resistance zone that has vexed gold for years is once again within easy range. All it will take to drive gold to new bull highs over $1365 is sustained investment buying. And that’s not a tall order with the stock markets starting to roll over again after record highs. GLD just enjoyed its biggest daily build in several years this past Monday.
Once gold gets to new bull-market highs, psychology will shift rapidly in its favor. Gold financial-media coverage will soar, and will be overwhelmingly positive. This will motivate investors and speculators alike to shift capital back into gold to chase its upside momentum. The potential gold and gold-stock gains with sentiment turning favorable are massive. It’s best to get deployed before gold’s breakout unleashes this.
Adam Hamilton, CPA
June 10, 2019
Copyright 2000 – 2019 Zeal LLC (www.ZealLLC.com)
Standard Lithium Ltd. (TSX–V: SLL) / (OTCQX: STLHF) shares are caught up in a battery metals sell off, but is it warranted given recent positive developments, ongoing supply challenges in the Lithium Triangle & exciting near-term Company catalysts? Its Arkansas Project could reach commercial production by 2022, and ramp up to ~20K tonnes/yr. of Lithium Carbonate, bolting onto brine streams from 3 existing facilities, to feed a central crystallizer plant by the mid-2020s. [a crystallizer is standard equipment made by multiple manufactures, used in many commercial applications, to convert a solution into a solid material] In this case, the solid material would be a high-purity, finished lithium product.
After successful bench & mini-pilot scale testing, Standard Lithium is at Demonstration Plant stage. The Demo Plant being constructed by Zeton Inc. is a 20 m x 20 m x 11 m tall, industrial-scale modular facility designed to process tail brine from the Lanxess South Plant in southern Arkansas. Lanxess is a leading European specialty chemicals company with > 15,000 employees in 33 countries. It develops, manufactures & markets a wide range of specialty chemicals & plastics. Last year, sales were nearly C$11 billion.
The Demonstration Plant is based on Standard Lithium’s proprietary technology that uses a solid sorbent material to selectively extract lithium. The Plant is designed to continuously process a flow of tail brine at 50 gallons per minute from the Lanxess South Plant, equivalent to annual production of 100-150 tonnes Lithium Carbonate. The Demo Plant is designed to be expanded to commercial scale early next decade.
Dr. Andy Robinson, Standard Lithium President & COO, commented in a June 3rd press release,
“The Standard Lithium team is very pleased with both the speed of execution and the exceptional quality and attention to detail that Zeton are bringing to our Demonstration Plant. We are very confident that we will be delivering a high-quality plant to the project site in southern Arkansas, and we look forward to integrating it into Lanxess’ brine operations. We are progressing very quickly on the ground, and hope to announce real progress in project implementation in the near-future.”
With all the doom & gloom around lithium pricing, even at current pricing of ~US$11.5K per tonne, 20K tonnes of Lithium Carbonate/yr. = US$230M = ~C$311M revenue at the Project level. There are possible scenarios to produce up to 30K tonnes/yr., for 25+ years by the 2H of the 2020s. Subject to a formal JV between Standard & Lanxess — in exchange for 100% funding of commercialization costs (hundreds of millions of CAD$ over several years) — by Lanxess; Standard Lithium will end up with 30%-40% of the Project. That’s a win-win for both companies in my opinion.
I believe that lithium carbonate pricing will improve early next decade, perhaps meaningfully, as forecasts for the global electrification of commercial & passenger transportation and the deployment of large-scale Energy Storage Systems, continue to rise.
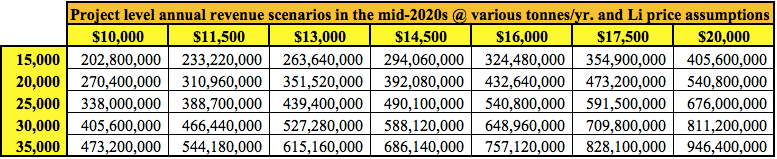
On the other hand, long-term lithium supply is highly uncertain. Brine projects in Argentina & Chile are coming, but they’re delayed due to funding & other challenges. Claimed project capacities of 20-40K tonnes of Lithium Carbonate/yr. may never be attained, look at Argentina’s Orocobre Ltd., after 4 years, it’s running at ~72% of nameplate capacity.
Of roughly 12 potentially viable brine projects in Chile & Argentina, I assume 4 won’t make it and the other 8 are delayed by an average of 2 years. I then pencil in a 4-yr ramp up period to 75% of stated project capacity. Under those assumptions, if 450K tonnes/yr. was expected from the Lithium Triangle in 2025 — what we might see, instead, is 225K tonnes/yr. in 2028! This means security of supply (from the U.S., Canada & Australia) will be of critical importance. Speed to market will be rewarded handsomely with long-term contracts at strong prices.
In the chart below we see a review done by Orocobre of 2018’s expectations vs. reality, a combined 78% shortfall in hydroxide & carbonate expansions. 285.5K tonnes of new supply expected, 64K tonnes delivered. We see this year after year after year…. when will the market catch on? This can only be good news for lithium pricing going forward.
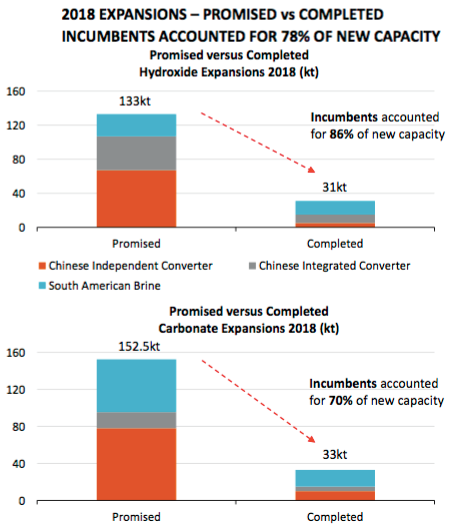
Any lithium company, be it brine, hard rock, clay or “unconventional;” that can reach production by early next decade, will be in the driver’s seat. I believe that Standard Lithium, with JV partner Lanxess could be in commercial operation by 2022. The Lanxess project has been de-risked in a number of important ways. I hope that readers & investors in lithium companies are starting to understand that risks avoided can add considerable value to a project. However, one risk still at large is technology & scale-up risk. With that in mind, I spoke at length with Standard Lithium’s President & COO, quoted above, Dr. Andy Robinson. Robinson has 20+ years’ experience as a Geoscientist and has a PhD in Geochemistry. No one is better suited to be in the position he’s in.
Please tell us about your background and what brought you to Standard Lithium.
I’m a PhD Geochemist who worked in the engineering consulting world for 10 years, and then as an entrepreneurial project developer in the mining & power space for the last decade. Robert (CEO Robert Mintak) and I worked together at Pure Energy. When we took over management of Standard Lithium in the spring of 2017, we had a very clear vision of what we wanted to build. We took our experience in the lithium business, both in terms of modern technology and project development goals, and looked for the ideal project. The ideal project had to have:
The right location for a modern approach,
Existing infrastructure at the project site – not 100’s of km away…
The right partner,
Minimal permitting & environmental risks, and
A globally significant resource
This was the only way we could realistically hope to get a project into commercial production within 5 years versus the usual 10 or more years.
How did your team choose a process technology to move forward with?
We took an agnostic approach to processing technology. The project drives the process. We started by understanding project fundamentals, then we developed a flow sheet that would work for our specific project in Southern Arkansas. Our process development work was guided by the philosophy that we didn’t just want it to work in a lab – we wanted a robust flow sheet that could work economically at commercial-scale.
Please describe the steps your team went through at the bench and mini–pilot plant stages.
At the bench-scale, we worked with large volumes of real brine from the project – we then tested a whole range of different technologies, ranging from those already in commercial use, through to novel and experimental technologies, to determine which general ‘suite’ of technologies would work best with our brine’s characteristics. We quickly determined that a modern alternative to the types of technologies developed in the 1970’s & commercialized in the 1990’s would be the ideal solution.
So, we spent the time at bench-scale solving chemistry problems of selectively extracting lithium from the brine – then we ran 2 programs of mini-pilot work to build our understanding of the process engineering. One was done at a batch-scale, then we scaled that up and ran it on a continuous basis. Now, in June 2019, we’ve just completed 2 years of test work on our southern Arkansas brines.
What were the key takeaways from each stage?
At the bench-scale – we learned that direct lithium extraction from the tail brine using a highly selective solid sorbent was the way to go. At the mini-pilot-scale – using both chemical & process engineers from a wide range of disciplines — allowed us to develop the simplest, most efficient flow sheet we could, at a reasonable cost. We’re using equipment and processes already in use around the world, at very large commercial-scale, in complementary existing industries.
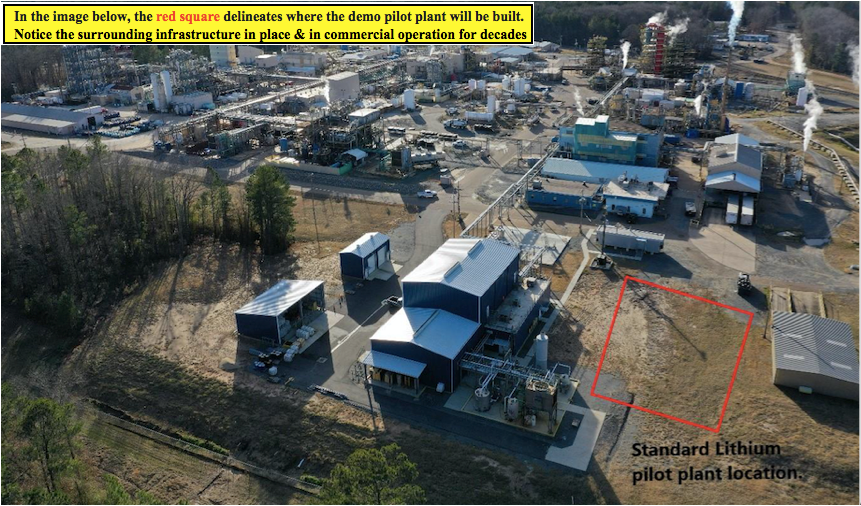
Please describe Standard Lithium’s upcoming Demonstration Plant, what do you hope to achieve?
The upcoming Demonstration Plant will be final proof-of-concept for our Project – it’s a large Plant, that can be scaled directly to a commercial facility. It’s designed to process up to 50 gallons per minute of tail brine from Lanxess’ South Plant, and produce at a rate of 100-150 tonnes of lithium carbonate per year, so about 10 to 12 tonnes per month. We hope to scale our Demo Plant up to 9,000-10,000 tonnes/yr. during the first phase of commercial execution.
If all goes as planned, Standard Lithium could be in commercial operations in 2022? 2023? Do you have a goal?
We’re aiming for a commercial decision in the first half next year, and our goal is to be in commercial operations by 2022. I should add that 2022 is aggressive, but achievable – as opposed to the aspirational targets suggested by other brine projects. Some of those projects are years away from a Bankable Feasibility Study, and then will require several more years to design, permit, win over local communities, obtain funding, construct solar evaporation ponds, regional infrastructure like roads, and build a processing facility.
Many companies are suggesting 3-year ramp up periods to full capacity, but if history is any guide, it will probably be longer. So, Standard Lithium could reach initial commercial operations years before some, if not most, of the brine projects in the ‘Lithium Triangle.’ If true, we would hope to lock-in long-term contracts (through Lanxess) at very favorable pricing.
Might you be able to sell lithium output into specialty niche–markets that command premium pricing?
That’s a great question. If one looks at Lanxess’ business model, it centers around taking raw materials and converting them into a large variety of tertiary products that maximize the value obtained from their feedstock. They do these conversions using their global specialty chemicals expertise. Several niche lithium chemicals command high margins and typically are served by a small number of manufacturers. Lanxess is a leading global specialty chemical company, they know how to: a) build & operate a chemical plant, and b) extract maximum value from their chemical feedstock!
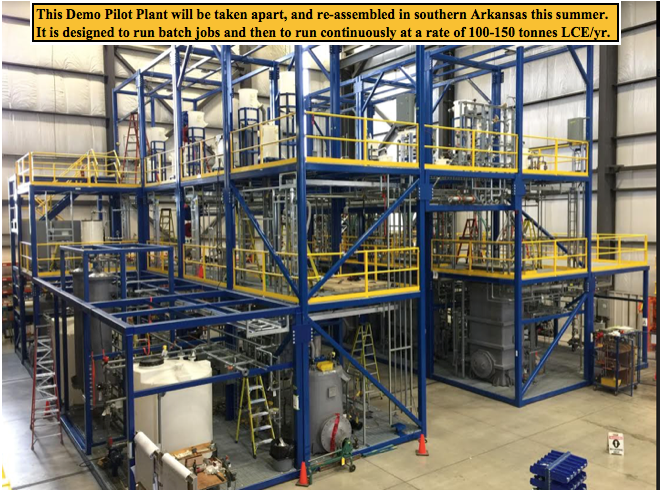
What would you like to say to readers who are still unsure about your operational flow sheet?
We think there’s still a general misunderstanding in the lithium industry about lithium processing technology. There’s a pervasive thought that evaporation ponds are conventional and therefore ‘safe,’ and that anything different is high-risk. In reality, each evaporation pond project is unique, each has initial, and ongoing, chemical & operational challenges; Orocobre is an example of taking the traditional approach and not delivering battery-quality, or nameplate capacity.
Interestingly, FMC (now Livent Corp.) has been successfully operating an ‘alternative’ lithium-selective sorbent technology (similar to ours) in Argentina since the 1990’s. Standard Lithium (TSX–V: SLL) / (OTCQX: STLHF) is not engaging in a high-risk processing technology – we’re simply making incremental improvements to what has already been done successfully for decades.
Once people see our onsite Demonstration Plant in continuous operation later this year, I think perceptions will change as to our technology being unconventional. We don’t have untested technology, we have customized technology, specifically designed with our project fundamentals in mind. The project drives the process. It took years of hard work and millions of dollars, but we think we’re about to cross the finish line regarding proof-of-concept. That should turn a lot of heads.
Peter Epstein
Epstein Research
June 6, 2019
Disclosures: The content of this article is for information only. Readers fully understand and agree that nothing contained herein, written by Peter Epstein of Epstein Research [ER], (together, [ER]) about Standard Lithium, including but not limited to, commentary, opinions, views, assumptions, reported facts, calculations, etc. is not to be considered implicit or explicit investment advice. Nothing contained herein is a recommendation or solicitation to buy or sell any security. [ER] is not responsible under any circumstances for investment actions taken by the reader. [ER] has never been, and is not currently, a registered or licensed financial advisor or broker/dealer, investment advisor, stockbroker, trader, money manager, compliance or legal officer, and does not perform market making activities. [ER] is not directly employed by any company, group, organization, party or person. The shares of Standard Lithium are highly speculative, not suitable for all investors. Readers understand and agree that investments in small cap stocks can result in a 100% loss of invested funds. It is assumed and agreed upon by readers that they will consult with their own licensed or registered financial advisors before making any investment decisions.
At the time this article was posted, Peter Epstein owned shares of Standard Lithium and it was an advertiser on [ER].
Readers understand and agree that they must conduct their own due diligence above and beyond reading this article. While the author believes he’s diligent in screening out companies that, for any reasons whatsoever, are unattractive investment opportunities, he cannot guarantee that his efforts will (or have been) successful. [ER] is not responsible for any perceived, or actual, errors including, but not limited to, commentary, opinions, views, assumptions, reported facts & financial calculations, or for the completeness of this article or future content. [ER] is not expected or required to subsequently follow or cover events & news, or write about any particular company or topic. [ER] is not an expert in any company, industry sector or investment topic.
The silver miners’ stocks have been pummeled in recent months, plunging near major secular lows in late May. Sentiment in this tiny sector is miserable, reflecting silver prices continuing to languish relative to gold. This has forced traditional silver miners to increasingly diversify into gold, which has far-superior economics. The major silver miners’ ongoing shift from silver is apparent in their recently-released Q1’19 results.
Four times a year publicly-traded companies release treasure troves of valuable information in the form of quarterly reports. Required by the U.S. Securities and Exchange Commission, these 10-Qs and 10-Ks contain the best fundamental data available to traders. They dispel all the sentiment distortions inevitably surrounding prevailing stock-price levels, revealing corporations’ underlying hard fundamental realities.
The definitive list of major silver-mining stocks to analyze comes from the world’s most-popular silver-stock investment vehicle, the SIL Global X Silver Miners ETF. Launched way back in April 2010, it has maintained a big first-mover advantage. SIL’s net assets were running $294m in mid-May near the end of Q1’s earnings season, 5.6x greater than its next-biggest competitor’s. SIL is the leading silver-stock benchmark.
In mid-May SIL included 24 component stocks, which are weighted somewhat proportionally to their market capitalizations. This list includes the world’s largest silver miners, including the biggest primary ones. Every quarter I dive into the latest operating and financial results from SIL’s top 17 companies. That’s simply an arbitrary number that fits neatly into the table below, but still a commanding sample.
As of mid-May these major silver miners accounted for fully 94.4% of SIL’s total weighting. In Q1’19 they collectively mined 70.9m ounces of silver. The latest comprehensive data available for global silver supply and demand came from the Silver Institute in April 2019. That covered 2018, when world silver mine production totaled 855.7m ounces. That equates to a run rate around 213.9m ounces per quarter.
Assuming that mining pace persisted in Q1’19, SIL’s top 17 silver miners were responsible for about 33% of world production. That’s relatively high considering just 26% of 2018’s global silver output was produced at primary silver mines! 38% came from lead/zinc mines, 23% from copper, and 12% from gold. Nearly 3/4ths of all silver produced worldwide is just a byproduct. Primary silver mines and miners are fairly rare.
Scarce silver-heavy deposits are required to support primary silver mines, where over half their revenue comes from silver. They are increasingly difficult to discover and ever-more expensive to develop. And silver’s challenging economics of recent years argue against miners even pursuing it. So even traditional major silver miners have shifted their investment focus into actively diversifying into far-more-profitable gold.
Silver price levels are best measured relative to prevailing gold prices, which overwhelmingly drive silver price action. In late May the Silver/Gold Ratio continued collapsing to its worst levels witnessed in 26.1 years, since April 1993! These secular extremes of the worst silver price levels in over a quarter century are multiplying the endless misery racking this once-proud sector. This silver environment is utterly wretched.
The largest silver miners dominating SIL’s ranks are scattered around the world. 10 of the top 17 mainly trade in U.S. stock markets, 3 in the United Kingdom, and 1 each in South Korea, Mexico, Peru, and Canada. SIL’s geopolitical diversity is good for investors, but makes it difficult to analyze and compare the biggest silver miners’ results. Financial-reporting requirements vary considerably from country to country.
In the U.K. companies report in half-year increments instead of quarterly. Some silver miners still publish quarterly updates, but their data is limited. In cases where half-year data is all that was made available, I split it in half for a Q1 approximation. Canada has quarterly reporting, but the deadlines are looser than in the States. Some Canadian miners really drag their feet, publishing their quarterlies close to legal limits.
The big silver companies in South Korea, Mexico, and Peru present other problems. Their reporting is naturally done in their own languages, which I can’t decipher. Some release limited information in English, but even those translations can be difficult to interpret due to differing accounting standards and focuses. It’s definitely challenging bringing all the quarterly data together for the diverse SIL-top-17 silver miners.
But analyzing them in the aggregate is essential to understand how they are faring. So each quarter I wade through all available operational and financial reports and dump the data into a big spreadsheet for analysis. Some highlights make it into this table. Blank fields mean a company hadn’t reported that data by mid-May, as Q1’s earnings season wound down. Some of SIL’s components report in gold-centric terms.
The first couple columns of this table show each SIL component’s symbol and weighting within this ETF as of mid-May. While most of these stocks trade on US exchanges, some symbols are listings from companies’ primary foreign stock exchanges. That’s followed by each miner’s Q1’19 silver production in ounces, along with its absolute year-over-year change. Next comes this same quarter’s gold production.
Nearly all the major silver miners in SIL also produce significant-to-large amounts of gold! That’s truly a double-edged sword. While gold really stabilizes and boosts silver miners’ cash flows, it also retards their stocks’ sensitivity to silver itself. So the next column reveals how pure these elite silver miners are, approximating their percentages of Q1’19 revenues actually derived from silver. This is calculated one of two ways.
The large majority of these top SIL silver miners reported total Q1 revenues. Quarterly silver production multiplied by silver’s average price in Q1 can be divided by these sales to yield an accurate relative-purity gauge. When Q1 sales weren’t reported, I estimated them by adding silver sales to gold sales based on their production and average quarterly prices. But that’s less optimal, as it ignores any base-metals byproducts.
Next comes the major silver miners’ most-important fundamental data for investors, cash costs and all-in sustaining costs per ounce mined. The latter directly drives profitability which ultimately determines stock prices. These key costs are also followed by YoY changes. Last but not least the annual changes are shown in operating cash flows generated and hard GAAP earnings, with a couple exceptions necessary.
Percentage changes aren’t relevant or meaningful if data shifted from positive to negative or vice versa, or if derived from two negative numbers. So in those cases I included raw underlying data rather than weird or misleading percentage changes. Companies with symbols highlighted in light-blue have newly climbed into the elite ranks of SIL’s top 17 over this past year. This entire dataset together is quite valuable.
It offers a fantastic high-level read on how the major silver miners are faring fundamentally as an industry and individually. The crazy-low silver prices really weighed on operating cash flows and earnings in Q1, and the silver miners’ years-old shift into gold continued. These companies are having no problem just surviving this silver-sentiment wasteland, but they probably won’t be thriving again before silver recovers.
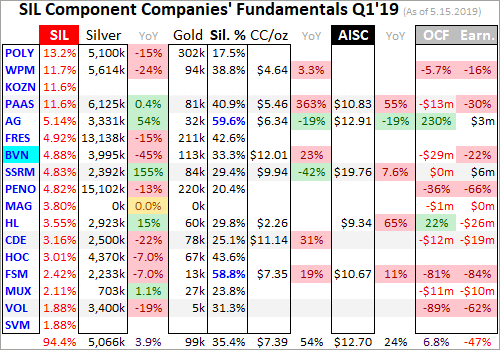
SIL’s poor performance certainly reflects the challenges of profitably mining silver with its price so darned cheap. Year-to-date in late May, SIL had already lost 12.2%. Silver itself was down 7.2% YTD at worst, starting to threaten mid-November 2018’s 2.8-year secular low of $13.99. And that just extended last year’s losing trend, where SIL plunged 23.3% amplifying silver’s own 8.6% loss by 2.7x. This sector looks ugly.
Silver’s weakest prices relative to gold in over a quarter century have continued to devastate silver-mining sentiment. Investors understandably want nothing to do with the forsaken silver miners, so their stock prices languish near major lows. Even their own managements seem really bearish, increasingly betting their companies’ futures on gold rather than silver. Silver’s Q1 price action further supports this decision.
During Q1’19 silver ground another 2.3% lower despite a 0.8% gold rally, bucking its primary driver. Q1’s average silver price of $15.54 fell 7.1% YoY from Q1’18’s average. That was way worse than gold’s mere 1.9% YoY average-price decline. The silver-mining industry is laboring under a pall of despair. Although production decisions aren’t made quarter by quarter, the chronically-weak silver prices are choking off output.
Production is the lifeblood of silver miners, and it continued to slide. The SIL top 17 that had reported their Q1 results by mid-May again mined 70.9m ounces of silver. That was down 3.1% YoY from Q1’18’s silver production, excluding Silvercorp Metals. SVM’s fiscal years end after Q1s, and it doesn’t report its longer more-comprehensive annual results until well after Q1’s normal quarterly earnings season wraps up.
It’s not just these major silver miners producing less of the white metal, the entire industry is according to the Silver Institute’s latest World Silver Survey. 2018 was the third year in a row of waning global silver mine production. This shrinkage is accelerating too as silver continues to languish, running 0.0% in 2016, 1.8% in 2017, and 2.4% in 2018! Peak silver may have been seen with this metal so unrewarding to mine.
The traditional major silver miners aren’t taking silver’s vexing fading lying down. They’ve spent recent years increasingly diversifying into gold, which has way-superior economics with silver prices so bombed out. The SIL top 17’s total gold production surged 10.9% YoY to 1387k ounces in Q1! This producing-less-silver-and-more-gold trend will continue to grow as long as silver prices waste away in the gutter.
Silver mining is as capital-intensive as gold mining, requiring similar large expenses to plan, permit, and construct new mines, mills, and expansions. It needs similar fleets of heavy excavators and haul trucks to dig and move the silver-bearing ore. Similar levels of employees are necessary to run silver mines. But silver generates much-lower cash flows than gold due its lower price. Silver miners have been forced to adapt.
This is readily evident in the top SIL miners’ production in Q1’19. SIL’s largest component in mid-May as this latest earnings season ended was the Russian-founded but UK-listed Polymetal. Its silver production fell 15.0% YoY in Q1, but its gold output surged 41.1%! Just 17.5% of its Q1 revenues came from silver, making it overwhelmingly a primary gold miner. Its newest mine ramping up is another sizable gold one.
SIL’s second-largest component is Wheaton Precious Metals. It used to be a pure silver-streaming play known as Silver Wheaton. Silver streamers make big upfront payments to miners to pre-purchase some of their future silver production at far-below-market unit prices. This is beneficial to miners because they use the large initial capital infusions to help finance mine builds, which banks often charge usurious rates for.
Back in May 2017 Wheaton changed its name and symbol to reflect its increasing diversification into gold streaming. In Q1’19 WPM’s silver output collapsed 24.4% YoY, but its gold surged 17.4% higher! That pushed its silver-purity percentage in sales terms to just 38.8%, way below the 50%+ threshold defining primary silver miners. WPM’s 5-year guidance issued in February forecasts this gold-heavy ratio persisting.
Major silver miners are becoming so scarce that SIL’s third-largest component is Korea Zinc. Actually a base-metals smelter, this company has nothing to do with silver mining. It ought to be kicked out of SIL post-haste, as its presence and big 1/9th weighting really retards this ETF’s performance. Korea Zinc smelted about 64.0m ounces of silver in 2018, which approximates roughly 17% of its full-year revenue.
Global X was really scraping the bottom of the barrel to include a company like Korea Zinc in SIL. I’m sure there’s not a single SIL investor who wants base-metals-smelting exposure in what is advertised as a “Silver Miners ETF”. The weighting and capital allocated to Korea Zinc can be reallocated and spread proportionally across the other SIL stocks. The ranks of major silver miners are becoming more rarefied.
SIL’s fourth-largest component in mid-May is Pan American Silver, which has a proud heritage mining its namesake metal. In Q1’19 its silver production was flat with a negligible 0.4% YoY increase, yet its gold output soared 74.2%! Thus PAAS’s silver purity slumped to 40.9%, the lowest by far seen in the years I’ve been doing this quarterly research. And it’s going to get much more gold-centric in coming quarters.
PAAS acquired troubled silver miner Tahoe Resources back in mid-November. Tahoe had owned what was once the world’s largest silver mine, Escobal in Guatemala. It had produced 5.7m ounces in Q1’17 before that country’s government unjustly shut it down after a frivolous lawsuit on a trivial bureaucratic misstep by the regulator. PAAS hopes to work through the red tape to win approval for Escobal to restart.
But the real prize in that fire-sale buyout was Tahoe’s gold production from other mines. That deal closed in late February, so that new gold wasn’t fully reflected in PAAS’s Q1 results. Now this former silver giant is forecasting midpoint production of 27.1m ounces of silver and 595.0k ounces of gold in 2019! That is way into mid-tier-gold territory and a far cry from 2018’s output of 24.8m and 178.9k. PAAS has turned yellow.
Pan American will probably soon follow in Wheaton’s footsteps and change its name and symbol to reflect its new gold-dominated future. As miserable as silver has been faring, I’m starting to wonder if the word “silver” in a miner’s name is becoming a liability with investors. The major primary silver miners are going extinct, forced to adapt by diversifying out of silver and into gold as the former languishes deeply out of favor.
In Q1’19 the SIL-top-17 miners averaged only 35.4% of their revenues derived from silver. That’s also the lowest seen since I started this thread of research with Q2’16 results. Only two of these miners remained primary silver ones, and their silver-purity percentages over 50% are highlighted in blue. They are First Majestic Silver and Fortuna Silver Mines, which together accounted for just 7.6% of SIL’s total weighting.
With SIL-top-17 silver production sliding 3.1% YoY in Q1’19, the per-ounce mining costs should’ve risen proportionally. Silver-mining costs are largely fixed quarter after quarter, with actual mining requiring the same levels of infrastructure, equipment, and employees. So the lower production, the fewer ounces to spread mining’s big fixed costs across. SIL’s major silver miners indeed reported higher costs last quarter.
There are two major ways to measure silver-mining costs, classic cash costs per ounce and the superior all-in sustaining costs. Both are useful metrics. Cash costs are the acid test of silver-miner survivability in lower-silver-price environments, revealing the worst-case silver levels necessary to keep the mines running. All-in sustaining costs show where silver needs to trade to maintain current mining tempos indefinitely.
Cash costs naturally encompass all cash expenses necessary to produce each ounce of silver, including all direct production costs, mine-level administration, smelting, refining, transport, regulatory, royalty, and tax expenses. In Q1’19 these SIL-top-17 silver miners reported cash costs averaging $7.39 per ounce. While that surged 23.6% YoY, it still remains far below prevailing prices. Silver miners face no existential threat.
The major silver miners’ average cash costs vary considerably quarter-to-quarter, partially depending on whether or not Silvercorp Metals happens to have edged into the top 17. This Canadian company mining in China has negative cash costs due to massive byproduct credits from lead and zinc. So over the past couple years, SIL-top-17 average cash costs have swung wildly ranging all the way from $3.95 to $6.75.
Way more important than cash costs are the far-superior all-in sustaining costs. They were introduced by the World Gold Council in June 2013 to give investors a much-better understanding of what it really costs to maintain silver mines as ongoing concerns. AISCs include all direct cash costs, but then add on everything else that is necessary to maintain and replenish operations at current silver-production levels.
These additional expenses include exploration for new silver to mine to replace depleting deposits, mine-development and construction expenses, remediation, and mine reclamation. They also include the corporate-level administration expenses necessary to oversee silver mines. All-in sustaining costs are the most-important silver-mining cost metric by far for investors, revealing silver miners’ true operating profitability.
The SIL-top-17 silver miners reporting AISCs in Q1’19 averaged $12.70 per ounce, 7.2% higher YoY. That remained considerably below last quarter’s average silver price of $15.54, as well as late May’s ugly silver low of $14.34. So the silver-mining industry as a whole is still profitable even with silver drifting near quarter-century-plus lows relative to gold. And those AISCs are skewed higher by SSR Mining’s outlying read.
Another traditional silver miner that changed its name, this company used to be known as Silver Standard Resources. SSRM has shifted into gold too, gradually winding down its old Pirquitas silver mine resulting in abnormally-high AISCs of $19.76 per ounce. Excluding these, the SIL-top-17 average in Q1 falls to $10.94 which is a much-more-comfortable profits cushion between production costs and low silver prices.
Interestingly SSRM has been ramping up a new mine close to its old Pirquitas mill, and is starting to run that ore through. That makes SSR Mining one of the rare silver miners that’s going to see growing output this year. It is forecasting a midpoint of 4.9m ounces of silver production in 2019, a 74% jump from last year’s levels! Higher production should lead to lower AISCs going forward, pulling the average back down.
As hopeless as silver has looked in recent months, it won’t stay down forever. Sooner or later gold will catch a major bid, probably on surging investment demand as these dangerous stock markets roll over. Capital will start migrating back into silver like usual once gold rallies long enough and high enough to convince traders its uptrend is sustainable. Since the silver market is so small, that portends much-higher prices.
At Q1’19’s average silver price of $15.54 and average SIL-top-17 AISCs of $12.70, these miners were earning $2.84 per ounce. That’s not bad for a sector that investors have left for dead, convinced it must be doomed. Being so wildly undervalued relative to gold, silver has the potential to surge much higher in the next gold upleg. The average Silver/Gold Ratio since Q1’16 right after today’s gold bull was born was 77.1x.
At $1400 and $1500 gold which are modest upleg gains, silver mean reverting to recent years’ average SGR levels would yield silver targets of $18.16 and $19.46. That’s conservative, ignoring the high odds for a mean-reversion overshoot, and only 16.9% and 25.2% above Q1’s average price. Yet with flat AISCs that would boost the SIL top 17’s profits by 92.3% and 138.0%! Their upside leverage to silver is amazing.
The caveat is the degree to which silver miners’ earnings amplify this metal’s upside is dependent on how much of their sales are still derived from silver when it turns north. If the SIL top 17 are still getting 35% of their sales from silver, their stocks should surge with silver. But the more they diversify into gold, the more dependent they will be on gold-price moves. Those aren’t as big as silver’s since gold is a far-larger market.
On the accounting front the top 17 SIL silver miners’ Q1’19 results highlighted the challenges of super-low silver prices. These companies collectively sold $3.0b worth of metals in Q1, which actually clocked in at an impressive 10.8% YoY increase. That was totally the result of these companies mining 10.9% more gold in Q1. Though it dilutes their silver-price exposure, shifting into gold really strengthens them financially.
But operating-cash-flow generation looked much worse, collapsing 55.1% YoY to $237m across the SIL top 17 that reported them for Q1. There was no single-company disaster, but Q1’s average silver prices being 7.1% lower YoY eroded OCFs universally. That led to these miners’ collective treasuries shrinking 22.9% YoY to $2.3b. That’s plenty to operate on, but not that much to fund many mine builds or expansions.
Hard GAAP profits reported by the SIL top 17 silver miners were very weak too in Q1’19, plunging 54.9% YoY to $123m. But there were no major writedowns from these low silver prices impairing the value of silver mines and deposits. Investors don’t buy silver stocks for how they are doing today, but for what they are likely to do as silver mean reverts higher. Silver-mining earnings surge dramatically as silver recovers.
Silver’s last major upleg erupted in essentially the first half of 2016, when silver soared 50.2% higher on a parallel 29.9% gold upleg. SIL blasted 247.8% higher in just 6.9 months, a heck of a gain for major silver stocks. But the purer primary silver miners did far better. The purest major silver miner First Majestic’s stock was a moonshot, skyrocketing a staggering 633.9% higher in that same short span! SIL’s gains are muted.
The key takeaway here is avoid SIL. The world’s leading “Silver Miners ETF” is increasingly burdened with primary gold miners with waning silver exposure. And having over 1/9th of your capital allocated to silver miners squandered in Korea Zinc is sheer madness! If you want to leverage silver’s long-overdue next mean reversion higher relative to gold, it’s far better to deploy in smaller purer primary silver miners alone.
One of my core missions at Zeal is relentlessly studying the silver-stock world to uncover the stocks with superior fundamentals and upside potential. The trading books in both our popular weekly and monthly newsletters are currently full of these better gold and silver miners. Mostly added in recent months as these stocks recovered from deep lows, their prices remain relatively low with big upside potential as gold rallies!
If you want to multiply your capital in the markets, you have to stay informed. Our newsletters are a great way, easy to read and affordable. They draw on my vast experience, knowledge, wisdom, and ongoing research to explain what’s going on in the markets, why, and how to trade them with specific stocks. As of Q1 we’ve recommended and realized 1089 newsletter stock trades since 2001, averaging annualized realized gains of +15.8%! That’s nearly double the long-term stock-market average. Subscribe today for just $12 per issue!
The bottom line is the major silver miners are still struggling. With silver continuing to languish at quarter-century-plus lows relative to gold, the economics of extracting it remain challenging. That led to slowing silver production and higher costs in Q1. The traditional major silver miners continued their years-long trend of increasingly diversifying into gold. Their percentage of sales derived from silver is still shrinking.
There aren’t enough major primary silver miners left to flesh out their own ETF, which is probably why SIL is dominated by gold miners. While it will rally with silver amplifying its gains, SIL’s upside potential is just dwarfed by the remaining purer silver stocks. Investors will be far-better rewarded buying them instead of settling for a watered-down silver-miners ETF. Their stocks will really surge as silver mean reverts much higher.
Adam Hamilton, CPA
June 4, 2019
Copyright 2000 – 2019 Zeal LLC (www.ZealLLC.com)
On May 27, Portofino Resources (TSX-V: POR) announced initial sampling results at its Yergo lithium brine project that covers the entire Aparejos Salar in the Province of Catamarca, Argentina. Yergo is within 15 km of Neo Lithium’s high-grade, PFS-stage 3Q Project. Before getting to this important company news, a quick recap of Portofino.
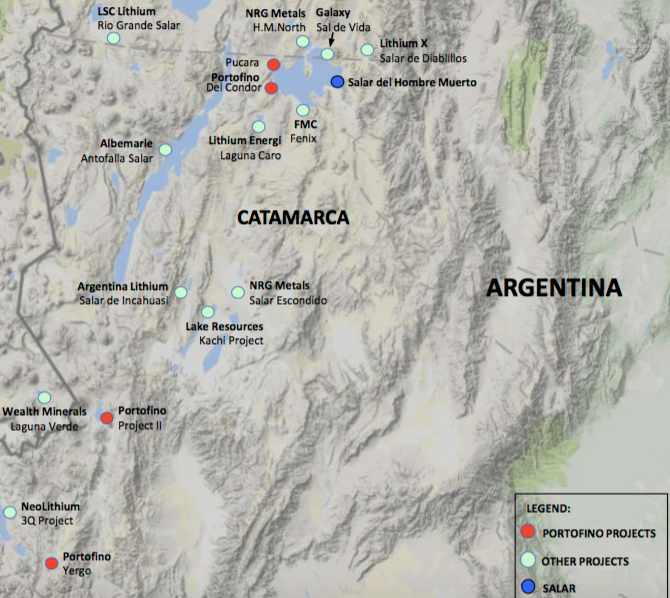
The Company controls 3 projects in Catamarca, covering > 8,600 hectares, via low-cost, 4-yr. options. Through the end of 2020, total cash outlays are < $65K, for all 3 projects. There are no work commitments or royalties. Portofino’s most advanced (initial drilling this summer) asset is the 100%-controlled, 1,804-hectare Hombre Muerto West project. Close neighbors in the Hombre del Muerto Salar include– Livent Corp. (formerly FMC), POSCO, and Australian-listed Galaxy Resources. POSCO paid ~$375M to Galaxy for 17,500 hectares in Catamarca province, that’s ~$21,400/ha. If POSCO, Galaxy, Livent Corp., Lithium Americas, Albemarle, SQM, Ganfeng, Orocobre Ltd. or smaller players like Neo Lithium, Millennial Lithium, Argosy Minerals, Advantage Lithium and Galan Lithium, were to pay half of what POSCO paid (per hectare) for 1/3 of Portofino’s 1,804 hectares in Hombre Muerto; that would equate to 6x the Company’s current market cap of C$1M. As a reminder, of 18 surface samples taken at the Hombre Muerto West project last year, 2 were > 1,000 mg/L Li, averaging 1,026 mg/L Li, 4 were > 800 mg/L Li, averaging 935 mg/L Li and 6 were > 700 mg/L Li, averaging 871 mg/L.
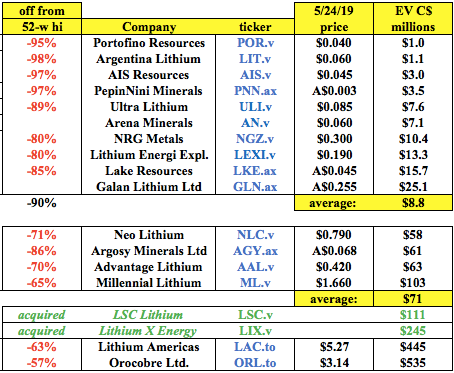
A Second Project, Named Project II, Looks Promising as Well….
Portofino can acquire 85% of Project II, which is 3,950 hectares in size and located 10 km from the Chile border (see map above) and 65 km northeast of Neo Lithium’s 3Q project. Historical exploration work included near-surface brine samples that averaged 274 mg/L Li, with several in excess of 300 mg/L Li. Project II captures the whole salar, has relatively easy access, and has returned consistent surface / near-surface sampling results over a wide area. The Maricunga project (BFS completed) is located just across the Chile border. Maricunga is billed as the highest grade, undeveloped brine project in the Americas.
Last, but not Least, Yergo, Subject of the May 27th News
Portofino has the right to acquire a 100% Interest in the 2,932 hectare Yergo lithium brine project. The property covers the entire Aparejos salar {see map above}. Earlier this year, surface & near-surface brine sampling & geological mapping were done. Twenty-two locations were sampled, returning values up to 373 mg/L Li and up to 8,001 mg/L Potassium (“K“). The sample sites averaged 224 mg/L Li, 4,878 mg/L K and 184 mg/L Magnesium (“Mg“.) The average Mg:Li ratio of the 22 samples is a very low 0.8:1. Due to unusually high levels of water in the salar, 16 of the 22 samples were taken from the southeast portion of the salar. Those 16 samples averaged 278 mg/L Li, 6,091 mg/L K and 86 mg/L Mg. The average Mg:Li ratio of the 16 samples is extremely low at 0.4:1. Most projects in Argentina have Mg:Li ratios of 3.0 to 3.5 to 1.
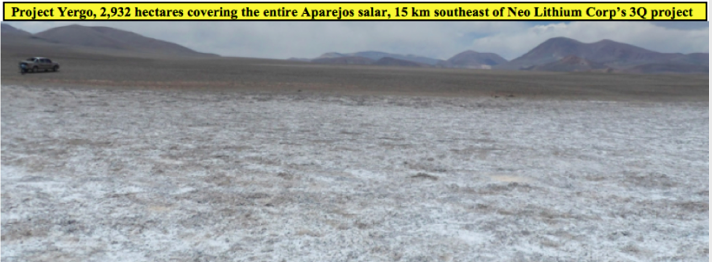
According to the press release, one sample taken from the northwestern portion of the salar returned a value of 351 mg/L Li, indicating a potential area of elevated near-surface Li brines up to 3 km in length by 1-2 km in width. Additional sampling will be required to better test the central portions of the area. Management intends to complete additional sampling once surface waters have evaporated to allow for less-diluted brine samples. Due to the close proximity of the salars comprising Neo Lithium’s 3Q Project and Portofino’s Yergo project, geologists studying Yergo believe it’s likely that they have similar geological histories and are similarly enriched in Lithium & Potassium.
David Tafel, Portofino’s CEO stated:
“We are encouraged with these very good, initial lithium and potassium sample results combined with extremely low magnesium/lithium ratios. As soon as weather permits, our geological team will continue their exploration work to follow up on the potential surface extent of the mineralization.“
Conclusion
Although the main event is drilling in June/July at Hombre Muerto West, these surface sample results from the Yergo project are certainly promising. Portofino is slowly but surely, without burning too much cash, advancing multiple projects. In a better battery metals market or a better lithium juniors market, I believe that the optionality embedded in Portofino’s 3 projects would be valued higher. Perhaps a lot higher. A C$1M market cap is a cheap entry point to see a few drill holes in one of the best lithium enriched salars on the planet. A proven salar with long-term existing production and advanced-staged development projects underway.
The following chart is another look at relative valuation. I calculated each company’s Enterprise Value per hectare. Portofino is the 2nd cheapest by this measure. To be fair, this is not the best metric, because not all hectares are of equal quality, or equally far advanced. For instance, some of the companies below have Preliminary Economic Assessments (“PEAs“) on select projects. However, I believe that Portofino’s 3 projects have the potential to be Company-makers (it’s easy to be a Company-maker when your market cap is C$1M). By contrast, some of the companies below have projects and green field properties in provinces or salars that have shown poor or mediocre drill results. Mediocre doesn’t make the grade in this market!
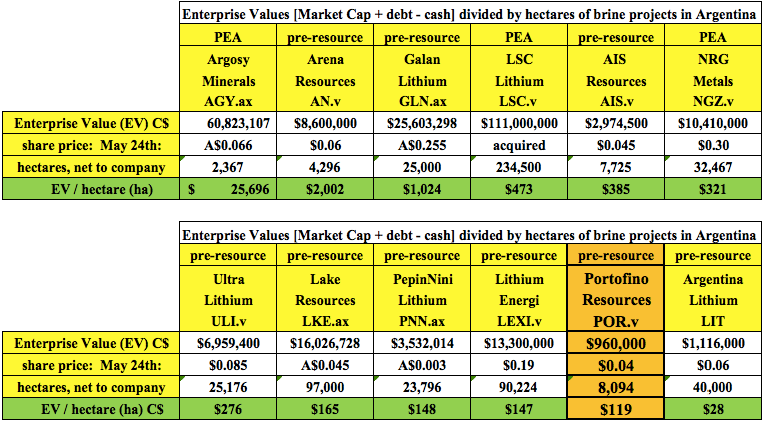
To be clear, Portofino Resources (TSX-V: POR) is a very high risk investment opportunity, it has not drilled a single hole yet. But several of the companies listed above have properties in less attractive salars, have experienced drilling problems, reported unimpressive grades, narrow brine intervals or announced small resources. One company reported a resource of just 66,000 tonnes of Indicated & Inferred lithium carbonate! Portofino could end up with mediocre drill results, or run into problems, but with a market cap of just C$1M, it might be worth taking drilling risk for the possibility of good, or very good, drill results, and perhaps a better lithium junior market later this year.
May 29, 2019
Peter Epstein, Epstein Research
Disclosures: The content of this article is for information only. Readers fully understand and agree that nothing contained herein, written by Peter Epstein of Epstein Research [ER], (together, [ER]) about Portofino Resources, including but not limited to, commentary, opinions, views, assumptions, reported facts, calculations, etc. is not to be considered implicit or explicit investment advice. Nothing contained herein is a recommendation or solicitation to buy or sell any security. [ER] is not responsible under any circumstances for investment actions taken by the reader. [ER] has never been, and is not currently, a registered or licensed financial advisor or broker/dealer, investment advisor, stockbroker, trader, money manager, compliance or legal officer, and does not perform market making activities. [ER] is not directly employed by any company, group, organization, party or person. The shares of Portofino Resources are highly speculative, not suitable for all investors. Readers understand and agree that investments in small cap stocks can result in a 100% loss of invested funds. It is assumed and agreed upon by readers that they will consult with their own licensed or registered financial advisors before making any investment decisions.
At the time this article was posted, Peter Epstein owned shares of Portofino Resources and Portofino was an advertiser on [ER].
Readers understand and agree that they must conduct their own due diligence above and beyond reading this article. While the author believes he’s diligent in screening out companies that, for any reasons whatsoever, are unattractive investment opportunities, he cannot guarantee that his efforts will (or have been) successful. [ER] is not responsible for any perceived, or actual, errors including, but not limited to, commentary, opinions, views, assumptions, reported facts & financial calculations, or for the completeness of this article or future content. [ER] is not expected or required to subsequently follow or cover events & news, or write about any particular company or topic. [ER] is not an expert in any company, industry sector or investment topic.
This is big, really big. I can’t say that it’s a surprise that Glencore might want to partner with First Cobalt Corp. (TSX-V: FCC) / (QTCQX: FTSSF), but it would be by far the best possible outcome for management’s strategic review of its 100%-owned refinery in Ontario. Shareholders & prospective investors were understandably growing nervous about First Cobalt’s ability to deliver the restart funding with little or no additional equity issuance. Not because of management, because the battery metals sector is a complete disaster. Everyone knows that the Cobalt price is down a lot, did you know that Vanadium is down 73.5% in 6 months? This news alone, if this agreement is consummated, could mark a turning point for select Cobalt juniors. {See full press release here}
Glencore adds tremendous credibility to First Cobalt’s Refinery
In addition to the potential for significant revenue (C$100M+ at US$20/lb. Cobalt) and good, very good or great EBITDA margins (depending on the Cobalt price), this would open A LOT of doors for the company. They would instantly become the premier pure-play, North American Cobalt junior, not that there are many left to choose from. First Cobalt could solidify its leading position by acquiring other companies & assets. Might eCobalt Solutions (TSX: ECS) be first on the list !?! eCobalt might now prefer the embrace of First Cobalt over a takeover by Australian-listed Jervois Mining. I have no insight on this, I’m just reflecting on the recent acquisition of ECS shares.
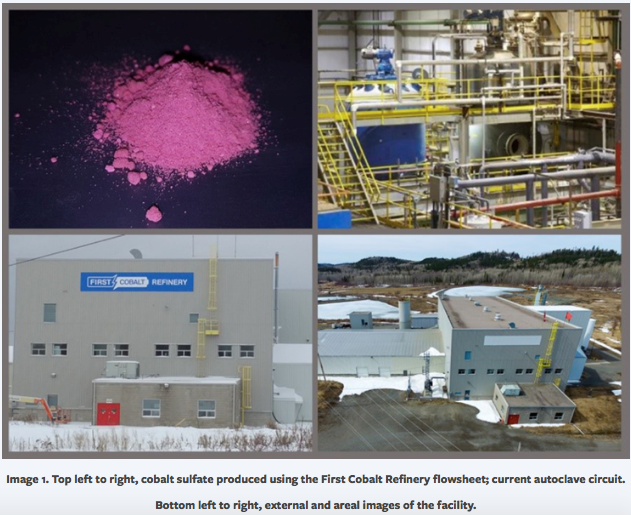
At the risk of getting ahead of myself, this is a MOU not a signed, sealed & delivered deal, I continue with the benefits of an agreement between First Cobalt & Glencore. Glencore adds increased credibility to First Cobalt, the management team and the refinery. It would be a supreme vote of confidence. Outside of North America, First Cobalt might not be a very well-known name. That would change overnight, in fact it might be changing as I write this sentence…. First Cobalt would attract additional world-class executives. The company could pay a dividend! My quick math suggests that a 5% dividend yield would be possible from 50% of the cash flow on 2,000-2,500 tonnes of production at US$20/lb. Cobalt.
Glencore would greatly de-risk Refinery restart & attract attention to FCC.v
It’s amazing what Glencore would bring to the table that no one else possibly could. It appears from the press release that Glencore might provide a loan for up to US$30M, all of the capital needed, to restart the refinery. In addition, Glencore would provide technical assistance in bringing the refinery back into production, for instance they would, “collaborate on final flow sheet design.” Glencore would source up to 100% of the feedstock. The refinery is a hydro-metallurgical Cobalt facility in the Canadian Cobalt Camp of Ontario. It has the potential to produce either a Cobalt Sulfate for lithium-ion batteries, or Cobalt metal for the North American Aerospace industry and other industrial & military applications.
Taking this news a step further, if the restart were to be a success, guess who would be there to help (if feasible) ramp up operations from 2,000-2,500 to perhaps 4,000-5,000 tonnes/yr.? Glencore is to Cobalt what Albemarle and SQM are to Lithium. Yes, closing on this agreement would be really, really good for shareholders.
Assuming that Glencore is on board, the refinery would likely be up and running sooner than otherwise would be the case. And, once the world realized that a Cobalt Refinery was coming online in Canada in 2021, and that produced Cobalt would to be ethically sourced from mine to finished product, end-users would be very interested in speaking with First Cobalt. First on the list of visitors to see CEO Trent Mell would likely be execs from the automakers. The company has already signed NDAs with a number of them. Next to visit? Li-ion battery makers. Both automakers and battery companies need ethically sourced Cobalt for genuine moral considerations, for public relations and for security of supply.
As per the press release,
“With no cobalt sulfate production in North America today, the First Cobalt Refinery has the potential to become the first such producer for the American electric vehicle market. The Company has signed confidentiality agreements with several automotive companies interested in securing cobalt for the North American market.”
I have to remind myself that this is a MOU, not a done deal, but I think the chances of it getting done are pretty high. First Cobalt & Glencore have likely been talking about the refinery for months now, if not longer. And, although I’ve outlined the many benefits for First Cobalt shareholders, Glencore benefits as well. Over time, if the refinery could produce 5,000 tonnes of Cobalt products, and Glencore controls that off-take, that’s a meaningful amount, probably > 10% of the battery-grade Cobalt processed / refined & sold outside of Africa & China.
Speaking of China, recent news shows that geopolitical risks are alive and well with China hinting at restricting the free trade of rare earth metals from China to the U.S. It doesn’t matter who’s to blame, how the U.S. and China got here, all that matters are the potential consequences. Today it’s rare earth metals, will China threaten to stop exporting lithium & cobalt next? I doubt that China would sell to Canada or Mexico if there was an embargo against the U.S. for rare earth metals, lithium, cobalt, vanadium, graphite, etc.
But now I’ve veered off course, this isn’t about China… The news today is about Glencore signing a MOU with First Cobalt Corp. (TSX-V: FCC) / (OTCQX: FTSSF) to help design, re-engineer, refurbish & commission the company’s Cobalt refinery in Ontario. Glencore could deliver up 100% of the feedstock needed to produce 2,000-2,500 tonnes of finished Cobalt. And, Glencore is considering paying the entire US$30M cost (in the form of a loan to First Cobalt Corp.) to get it up and running again. This is the biggest news of the year for the Company. This is important news for the Cobalt sector. Let’s see if this marks a change in sentiment for Cobalt juniors.
May 24, 2019
Peter Epstein
Disclosures: The content of this article is for information only. Readers fully understand and agree that nothing contained herein, written by Peter Epstein of Epstein Research [ER], (together, [ER]) about First Cobalt Corp., including but not limited to, commentary, opinions, views, assumptions, reported facts, calculations, etc. is not to be considered implicit or explicit investment advice. Nothing contained herein is a recommendation or solicitation to buy or sell any security. [ER] is not responsible under any circumstances for investment actions taken by the reader. [ER] has never been, and is not currently, a registered or licensed financial advisor or broker/dealer, investment advisor, stockbroker, trader, money manager, compliance or legal officer, and does not perform market making activities. [ER] is not directly employed by any company, group, organization, party or person. The shares of First Cobalt Corp. are highly speculative, not suitable for all investors. Readers understand and agree that investments in small cap stocks can result in a 100% loss of invested funds. It is assumed and agreed upon by readers that they will consult with their own licensed or registered financial advisors before making any investment decisions.
At the time this article was posted, Peter Epstein owned shares of First Cobalt Corp. and the Company was an advertiser on Epstein Research [ER].
Readers should consider me biased in favor of the Company and understand & agree that they must conduct their own due diligence above and beyond reading this article. While the author believes he’s diligent in screening out companies that, for any reasons whatsoever, are unattractive investment opportunities, he cannot guarantee that his efforts will (or have been) successful. [ER] is not responsible for any perceived, or actual, errors including, but not limited to, commentary, opinions, views, assumptions, reported facts & financial calculations, or for the completeness of this article or future content. [ER] is not expected or required to subsequently follow or cover events & news, or write about any particular company or topic. [ER] is not an expert in any company, industry sector or investment topic.
The major gold miners’ stocks are drifting sideways with gold, their early-year momentum sapped by the recent stock-market euphoria. But they are more important than ever for prudently diversifying portfolios, a rare sector that surges when stock markets weaken. Their just-reported Q1’19 results reveal how gold miners are faring as a sector, and their current fundamentals are way better than bearish psychology implies.
The wild market action in Q4’18 again emphasized why investors shouldn’t overlook gold stocks. Every portfolio needs a 10% allocation in gold and its miners’ stocks. As the flagship S&P 500 broad-market stock index plunged 19.8% largely in that quarter to nearly enter a bear market, the leading gold-stock ETF rallied 11.4% higher in that span. That was a warning shot across the bow that these markets are changing.
Four times a year publicly-traded companies release treasure troves of valuable information in the form of quarterly reports. Required by the US Securities and Exchange Commission, these 10-Qs and 10-Ks contain the best fundamental data available to traders. They dispel all the sentiment distortions inevitably surrounding prevailing stock-price levels, revealing corporations’ underlying hard fundamental realities.
The definitive list of major gold-mining stocks to analyze comes from the world’s most-popular gold-stock investment vehicle, the GDX VanEck Vectors Gold Miners ETF. Launched way back in May 2006, it has an insurmountable first-mover lead. GDX’s net assets running $9.0b this week were a staggering 46.6x larger than the next-biggest 1x-long major-gold-miners ETF! GDX is effectively this sector’s blue-chip index.
It currently includes 46 component stocks, which are weighted in proportion to their market capitalizations. This list is dominated by the world’s largest gold miners, and their collective importance to this industry cannot be overstated. Every quarter I dive into the latest operating and financial results from GDX’s top 34 companies. That’s simply an arbitrary number that fits neatly into the tables below, but a commanding sample.
As of this week these elite gold miners accounted for fully 94.3% of GDX’s total weighting. Last quarter they combined to mine 274.4 metric tons of gold. That was 32.2% of the aggregate world total in Q1’19 according to the World Gold Council, which publishes comprehensive global gold supply-and-demand data quarterly. So for anyone deploying capital in gold or its miners’ stocks, watching GDX miners is imperative.
The largest primary gold miners dominating GDX’s ranks are scattered around the world. 20 of the top 34 mainly trade in US stock markets, 6 in Australia, 5 in Canada, 2 in China, and 1 in the United Kingdom. GDX’s geopolitical diversity is excellent for investors, but makes it more difficult to analyze and compare the biggest gold miners’ results. Financial-reporting requirements vary considerably from country to country.
In Australia, South Africa, and the UK, companies report in half-year increments instead of quarterly. The big gold miners often publish quarterly updates, but their data is limited. In cases where half-year data is all that was made available, I split it in half for a Q1 approximation. While Canada has quarterly reporting, the deadlines are looser than in the States. Some Canadian gold miners drag their feet in getting results out.
While it is challenging bringing all the quarterly data together for the diverse GDX-top-34 gold miners, analyzing it in the aggregate is essential to see how they are doing. So each quarter I wade through all available operational and financial reports and dump the data into a big spreadsheet for analysis. The highlights make it into these tables. Blank fields mean a company hadn’t reported that data as of this Wednesday.
The first couple columns of these tables show each GDX component’s symbol and weighting within this ETF as of this week. While most of these stocks trade on US exchanges, some symbols are listings from companies’ primary foreign stock exchanges. That’s followed by each gold miner’s Q1’19 production in ounces, which is mostly in pure-gold terms. That excludes byproduct metals often present in gold ore.
Those are usually silver and base metals like copper, which are valuable. They are sold to offset some of the considerable expenses of gold mining, lowering per-ounce costs and thus raising overall profitability. In cases where companies didn’t separate out gold and lumped all production into gold-equivalent ounces, those GEOs are included instead. Then production’s absolute year-over-year change from Q1’18 is shown.
Next comes gold miners’ most-important fundamental data for investors, cash costs and all-in sustaining costs per ounce mined. The latter directly drives profitability which ultimately determines stock prices. These key costs are also followed by YoY changes. Last but not least the annual changes are shown in operating cash flows generated, hard GAAP earnings, revenues, and cash on hand with a couple exceptions.
Percentage changes aren’t relevant or meaningful if data shifted from positive to negative or vice versa, or if derived from two negative numbers. So in those cases I included raw underlying data rather than weird or misleading percentage changes. Companies with symbols highlighted in light-blue have newly climbed into the elite ranks of GDX’s top 34 over this past year. This entire dataset together is quite valuable.
It offers a fantastic high-level read on how the major gold miners are faring fundamentally as an industry and individually. While the endless challenge of growing production continues to vex plenty of the world’s larger gold miners, they generally performed much better in Q1’19 than today’s low gold-stock prices reflect. Last quarter was also a big transition one as the recent gold-stock mega-mergers continued to settle out.
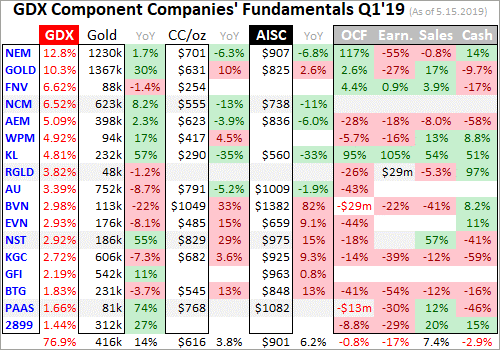
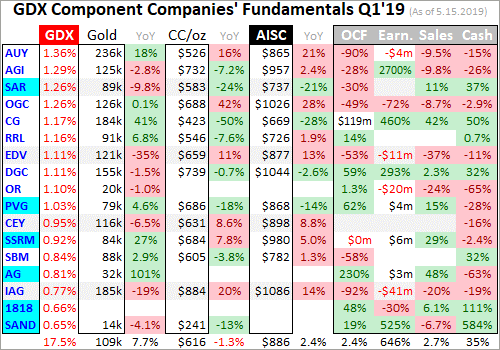
Production has always been the lifeblood of the gold-mining industry. Gold miners have no control over prevailing gold prices, their product sells for whatever the markets offer. Thus growing production is the only manageable way to boost revenues, leading to amplified gains in operating cash flows and profits. Higher output generates more capital to invest in expanding existing mines and building or buying new ones.
Gold-stock investors have long prized production growth above everything else, as it is inexorably linked to company growth and thus stock-price-appreciation potential. But for several years now the major gold miners have been struggling to grow production. Large economically-viable gold deposits are getting increasingly harder to find and more expensive to exploit, with the low-hanging fruit long since picked.
Gold miners’ exploration budgets have cratered since gold collapsed in Q2’13, plummeting 22.8%! That was the yellow metal’s worst quarter in an astounding 93 years, which devastated sentiment and scared investors away from this sector. Much less capital to explore shrank the pipeline of new finds to replace relentless depletion at existing mines. That left major gold miners just one viable option to grow their output.
They either have to buy existing mines and/or deposits from other companies, or acquire those outright. That’s unleashed a merger-and-acquisition wave that culminated in recent quarters. In September 2018 gold giant Barrick Gold announced it was merging with Randgold. Not to be outdone, in January 2019 the other gold behemoth Newmont Mining declared it was acquiring Goldcorp in another colossal mega-deal.
I wrote a whole essay analyzing these mega-mergers in mid-February, and believe they are bad for this sector for a variety of reasons. For our purposes today, Q1’19 was the first quarter fully reflecting the new Barrick including Randgold. But Newmont’s acquisition of Goldcorp wasn’t finalized until April 2019, so that isn’t included in NEM’s Q1’19 results. And unfortunately Goldcorp’s weren’t published separately either.
That makes analyzing the GDX top 34’s gold production last quarter more complicated than usual. As far as I can tell, Newmont released nothing on Goldcorp’s Q1 operations. As usual when one company buys out another, the acquired company’s website is quickly effectively deleted. It is replaced with a tiny new website largely devoid of useful information, that redirects to the new combined company’s main website.
So Goldcorp’s Q1 results were apparently cast into a black hole, never to be seen by investors. Across last year’s four quarters, Goldcorp ranked as the 5th-to-7th-largest GDX component. So excluding it from this leading gold-stock ETF skews all kinds of Q1 numbers. This discontinuity will resolve itself over the next couple quarters as Newmont and Goldcorp are fully integrated into the new, wait for it, “Newmont Goldcorp”.
In Q1’19 these top 34 GDX gold miners produced 8.8m ounces of gold, which was down a sharp 6.3% from Q1’18’s levels. But Goldcorp averaged 574k ounces of quarterly production in 2018. If that is added in, Q1’19’s climbs to 9.4m ounces which is only off a slight 0.2% YoY. Stable gold output is a victory for the major gold miners, as there have been plenty of recent quarters where their production has declined.
But depletion is still a huge challenge for them, as they are losing market share to smaller gold miners that aren’t so unwieldy to manage. The World Gold Council publishes the best global gold fundamental supply-and-demand data quarterly. According to its latest Q1’19 Gold Demand Trends report, total world mine production actually climbed 1.1% YoY in Q1. So the larger gold miners continue to underperform.
On a quarter-over-quarter basis since Q4’18, the GDX top 34’s gold production plunged 8.8%! But again that is overstated by Goldcorp’s missing-in-action Q1 output. Add in that 2018 quarterly approximation, and that decline moderates to 2.8% QoQ. The quarter-to-quarter output dynamics among the major gold miners are somewhat surprising. Gold is not produced at a steady pace year-round as logically assumed.
Going back to 2010, the world gold mine production per the WGC has averaged sharp 7.2% QoQ drops from Q4s to Q1s! For many if not most major gold miners, calendar years’ first quarters mark the low ebb in their annual output. The gold miners attribute this Q1 lull to new capital spending that slows production as mine infrastructure is upgraded. That weaker output in Q1s is regained with big jumps in following quarters.
In that same decade-long WGC dataset, Q2s saw world mine production average big 5.4% QoQ surges from Q1s! That sharp acceleration trend continued in Q3s, which averaged additional 5.3% QoQ growth from Q2s. Then that petered out on average in Q4s, which were only 0.5% better than Q3s. So it is normal for gold miners’ production to fall sharply in years’ Q1s before rebounding strongly in Q2s and Q3s.
There’s more to this intra-year seasonality than capital spending though. Mine managers play a big role in how they plan their ore sequencing. Individual gold deposits are not homogenous, but have varying richness throughout their orebodies. Mine managers have to decide which ore to mine in any quarter, which is fed through their fixed-capacity mills for crushing and gold recovery. Ore grade determines output.
The more gold per ton of ore dug and hauled in any quarter, the more gold produced. Mine managers choose to process more lower-grade ores in Q1s, then move to higher-grade ore mixes in Q2s and Q3s. That helps maximize their incentive bonuses. Q3 results are reported in early-to-mid Novembers soon before year-ends. Higher production boosts stock prices heading into that year-end bonus-calculation time!
Realize that Q1 results reported from early-to-mid Mays generally show a year’s weakest gold output. It is surprising to see investors sell gold stocks hard when Q1’s production declines from Q4’s, as this is par for the course in this industry. The bright side is excitement later builds throughout the year as Q2’s and Q3’s production grows fast. The gold miners look better fundamentally later in years than earlier in them!
With year-over-year gold production among the GDX top 34 effectively flat in Q1’19 with Goldcorp’s likely output added back in, odds argued against much of a change in gold-mining costs. They are largely fixed quarter after quarter, with actual mining requiring the same levels of infrastructure, equipment, and employees. These big fixed costs are spread across production, making unit costs inversely proportional to it.
There are two major ways to measure gold-mining costs, classic cash costs per ounce and the superior all-in sustaining costs per ounce. Both are useful metrics. Cash costs are the acid test of gold-miner survivability in lower-gold-price environments, revealing the worst-case gold levels necessary to keep the mines running. All-in sustaining costs show where gold needs to trade to maintain current mining tempos indefinitely.
Cash costs naturally encompass all cash expenses necessary to produce each ounce of gold, including all direct production costs, mine-level administration, smelting, refining, transport, regulatory, royalty, and tax expenses. In Q1’19 these top-34-GDX-component gold miners that reported cash costs averaged $616 per ounce. That actually fell a sharp 7.7% YoY, down on the low side of recent years’ cash-cost range.
Investor sentiment in gold-stock land has been really poor, as recent months’ extreme stock euphoria has really stunted interest in gold. If stock markets seemingly do nothing but rally indefinitely, then why bother prudently diversifying stock-heavy portfolios with counter-moving gold? There’s been increasing chatter lately about the gold-mining industry’s viability, which isn’t unusual when psychology waxes quite bearish.
Those worries are ridiculous with the major gold miners’ cash costs averaging in the low $600s even in Q1’s low-quarterly-output ebb. As long as gold remains well above $616, this neglected sector faces no existential threat. And Q1’s top-34-GDX-average cash costs are even skewed higher by one struggling gold miner, Peru’s Buenaventura. In Q1’19 it suffered a sharp 22.2% YoY plunge in gold production.
That was primarily due to the company stopping extraction operations at one of its key mines in January to rejigger and centralize it. That lower output to spread mining’s big fixed costs across was enough to catapult BVN’s Q1 cash costs 33.1% higher YoY to an extreme $1049 per ounce. Those are expected to mean revert much lower in coming quarters. Ex-BVN the rest of the GDX top 34 averaged merely $600.
Way more important than cash costs are the far-superior all-in sustaining costs. They were introduced by the World Gold Council in June 2013 to give investors a much-better understanding of what it really costs to maintain gold mines as ongoing concerns. AISCs include all direct cash costs, but then add on everything else that is necessary to maintain and replenish operations at current gold-production levels.
These additional expenses include exploration for new gold to mine to replace depleting deposits, mine-development and construction expenses, remediation, and mine reclamation. They also include the corporate-level administration expenses necessary to oversee gold mines. All-in sustaining costs are the most-important gold-mining cost metric by far for investors, revealing gold miners’ true operating profitability.
The GDX-top-34 gold miners reported average AISCs of $893 per ounce in Q1’19, up merely 1.0% YoY. These flat AISCs are right in line with flat production when Goldcorp’s likely output is added back in. The big operational challenges at Buenaventura also rocketed its AISCs an incredible 82.3% higher YoY to an anomalous $1382 per ounce. Excluding BVN, the rest of the GDX top 34 averaged $874 AISCs in Q1.
That’s right in line with the past couple calendar years’ quarterly average of $872. The major gold miners, despite still struggling to grow their production enough to exceed depletion, are still holding the line on all-important costs. Those stable costs regardless of prevailing gold prices are what make the gold stocks so attractive. They have massive upside potential as their profits amplify the higher gold prices still coming.
The gold price averaged $1303 in Q1’19. Subtracting the major gold miners’ average $893 AISCs from that yields strong profits of $410 per ounce. While recent years’ universal stock-market euphoria has capped gold at $1350 resistance, it has still been grinding higher on balance carving higher lows. Gold is getting wound tighter and tighter towards a major upside breakout to new bull highs well above $1350.
Like usual gold investment demand will be rekindled when the stock markets inevitably roll over materially again, propelling gold higher. A mere 7.7% upleg from $1300 would carry gold to $1400, and just 15.4% would hit $1500. Those are modest and easily-achievable gains by past-gold-upleg standards. During essentially the first half of 2016 after major stock-market selloffs, gold blasted 29.9% higher in 6.7 months!
At $1300 and Q1’s $893 average AISCs, the major gold miners are earning $407 per ounce. But at $1400 and $1500 gold, those profits soar to $507 and $607. That’s 24.6% and 49.1% higher on relatively-small 7.7% and 15.4% gold uplegs from here! This inherent profits leverage to gold is why the major gold stocks of GDX tend to amplify gold uplegs by 2x to 3x or so. Investors enjoy large gains as gold rallies.
Despite investors’ serious apathy for this sector, the gold miners’ costs remain well-positioned to fuel big profits growth in a higher-gold-price environment. Investors love rising earnings, which are looking to be scarce in the general stock markets this year. The better gold miners’ stocks are likely to see big capital inflows as gold continues climbing on balance, which will drive them and to a lesser extent GDX much higher.
The GDX top 34’s accounting results weren’t as impressive as their flat production and costs in Q1. The lack of Goldcorp’s operations being accounted for last quarter again distorted normal annual comparisons. So all these Q1’19 numbers are compared to Q1’18’s excluding Goldcorp. Last quarter’s average gold price being 1.9% lower than Q1’18’s average also played a role in weaker year-over-year performance.
The GDX top 34’s total revenues fell 5.2% YoY ex-Goldcorp to $9.2b in Q1’19. That’s reasonable given the slightly-lower production and gold prices. Lower byproduct silver output also contributed, as a half-dozen of these elite major gold miners also produce sizable amounts of silver. Again without Goldcorp, the total silver output among the GDX top 34 fell 8.0% YoY to 27.3m ounces in Q1 weighing on total sales.
Their overall cash flows generated from operations mirrored this weakening trend, down 9.1% YoY to $2.8b last quarter. Still the GDX-top-34 gold miners were producing lots of cash as the big profits gap between their AISCs and prevailing gold prices implied. Only two of these major gold miners suffered significant negative OCFs, and one of those was naturally Buenaventura with all its production struggles.
These elite gold miners remained flush with cash at the end of Q1, reporting $11.1b on their books. That is 11.3% lower YoY without Goldcorp. The gold miners tap into their cash hoards when they are building or buying mines, so declines in overall cash balances suggest more investment in growing future output. Investors fretting about the gold-mining industry today aren’t following their strong operating cash flows.
Last but not least are the GDX top 34’s hard accounting profits under Generally Accepted Accounting Principles. These are the actual quarterly earnings reported to the SEC and other regulators. Overall profits excluding Goldcorp only declined 7.2% YoY to $731m in Q1’19. That’s really impressive in light of the 5.2%-lower revenues. Prior quarters’ big mine-impairment charges on lower gold prices also dried up.
So the major gold miners included in this sector’s leading ETF are doing a lot better than investors are giving them credit for. There’s no fundamental reason for this critical portfolio-diversifying contrarian sector to be shunned. Gold stocks’ only problem is the lack of upside action in gold, which will quickly change once the stock markets decisively roll over again. December 2018 proved these relationships still work.
As the S&P 500 plunged 9.2% that month, investors remembered the timeless wisdom of keeping some gold and gold miners’ stocks in their portfolios. So they started shifting capital back in, driving gold 4.9% higher that month which GDX leveraged to a big 10.5% gain! Gold and its miners’ stocks act like portfolio insurance when stock markets sell off. Everyone really needs a 10% allocation in gold and gold stocks!
That being said, GDX isn’t the best way to do it. This ETF’s potential upside is retarded by the large gold miners struggling to grow their production. Investment capital will seek out the smaller mid-tier and junior gold miners actually able to increase their output. It’s far better to invest in these great individual miners with superior fundamentals. While plenty are included in GDX, their relatively-low weightings dilute their gains.
GDX’s little-brother ETF GDXJ is another option. While advertised as a “Junior Gold Miners ETF”, it is really a mid-tier gold miners ETF. It includes most of the better GDX components, with higher weightings since the largest gold majors are excluded. I wrote an entire essay in mid-January explaining why GDXJ is superior to GDX, and my next essay a week from now will delve into the GDXJ gold miners’ Q1’19 results.
Back in essentially the first half of 2016, GDXJ rocketed 202.5% higher on a 29.9% gold upleg in roughly the same span! While GDX somewhat kept pace then at +151.2%, it is lagging GDXJ more and more as its weightings are more concentrated in stagnant gold super-majors. The recent mega-mergers are going to worsen that investor-hostile trend. Investors should buy better individual gold stocks, or GDXJ, instead of GDX.
One of my core missions at Zeal is relentlessly studying the gold-stock world to uncover the stocks with superior fundamentals and upside potential. The trading books in both our popular weekly and monthly newsletters are currently full of these better gold and silver miners. Mostly added in recent months as gold stocks recovered from deep lows, their prices remain relatively low with big upside potential as gold rallies!
If you want to multiply your capital in the markets, you have to stay informed. Our newsletters are a great way, easy to read and affordable. They draw on my vast experience, knowledge, wisdom, and ongoing research to explain what’s going on in the markets, why, and how to trade them with specific stocks. As of Q1 we’ve recommended and realized 1089 newsletter stock trades since 2001, averaging annualized realized gains of +15.8%! That’s nearly double the long-term stock-market average. Subscribe today for just $12 per issue!
The bottom line is the major gold miners performed pretty well last quarter. Their production held steady despite lower prevailing gold prices and inexorable depletion. That led to flat costs right in line with prior years’ average levels. That leaves gold-mining earnings positioned to soar higher in future quarters as gold continues slowly grinding higher on balance. Another major stock-market selloff will accelerate that trend.
Stock investors are making a serious mistake ignoring gold and its miners’ stocks. The bearish sentiment plaguing this sector today is irrational given miners’ solid fundamentals. Diversifying is best done before it is necessary, buying low with gold-stock prices so beaten-down. This is the only sector likely to rally fast amplifying gold’s upside when stock markets inevitably swoon again. Don’t overlook the great opportunity here!
Adam Hamilton, CPA
May 21, 2019
Copyright 2000 – 2019 Zeal LLC (www.ZealLLC.com)
The junior resource sector is a people business. In my view, making money consistently in a sector which is fraught with risk and failure, without a doubt, is inextricably linked to the quality of the people who are running the companies with which I am investing.
This statement, and statements like it, are very likely the most common answers you will hear from many pundits throughout the industry. While this should now be common knowledge, however, I still hear from investors who invest and lose money with “butchers, bakers and candlestick makers.”
So, why does this still happen? I’m not totally sure. Maybe it’s the potential for a quick buck or simply investors caught up in a narrative. Whatever the answer may be, I’m sure it will continue in the future, and that’s too bad. While it makes a select few rich, overall, the promotion of mediocrity is really bad for the sector.
In saying this, today I have for you a conversation with one of the sector’s ‘greats;’ a man and a group in which it’s worth investing.
This person is Dr. Mark O’Dea, Chairman and Founder of Oxygen Capital.
Oxygen Capital has a great track record of success within the sector, as they have provided a ton of value for their shareholders through the sale of many of their projects, such as Fronteer Gold, Aurora Energy and True Gold.
In our conversation, I asked O’Dea about the secret behind Oxygen Capital’s success, lessons he’s learned while working in the sector, his view of jurisdictional risk and more. There’s a lot to glean from O’Dea’s answers – Enjoy!
Brian: In my opinion, one of the biggest issues facing most people is their lack of self-awareness. Whether it be in their investments or their personal lives, many people either have no idea or are prone to lying to themselves about where they are strong and where they are weak and, thus, typically fall short of their goals and aspirations. Oxygen Capital and its managing partners definitely don’t have this issue, as their track record for success within the resource sector is among the best I have seen. What has and continues to make Oxygen Capital successful within the resource sector?
Mark: When you start working on a project, you know reasonably soon, whether it has the potential to be an economic deposit or not, and if it doesn’t, there’s really no point in faking it. It’s a waste of time, it destroys the trust of shareholders, and it builds the wrong type of working culture. So, you’re much better off focusing your efforts on finding the right project. We have lived by the philosophy of “good projects and good places” for 20 years now and it has worked out really, really well.
Over that period, I’ve been CEO and/or Executive Chairman of a number of public companies that have been acquired, because they were underpinned by projects that were either operating mines, or advanced projects that could ultimately become mines.
For example, Fronteer Gold, among other things, had the high grade Long Canyon deposit that ultimately became a mine built by Newmont, after they acquired Fronteer in 2011. It is now one of their lowest cost mines in the USA. Aurora Energy defined and advanced one of the largest uranium deposits in Canada back in 2009, and it was ultimately acquired by Paladin in 2011. Its Michelin deposit needs higher Uranium prices, but it’s got all the attributes of a long life mine. And most recently, at True Gold, we built an open-pit, heap leach gold mine in West Africa, and shortly after we poured our first gold bar in 2016, we were acquired by Endeavour Mining. So, all of our big successes have been underpinned by high quality projects that were either mines or had the potential to become mines.
Today, we’ve got four companies at Oxygen – Pure Gold, Liberty Gold, Sun Metals and Discovery Metals. We’ve created, in my view, one of the best exploration and development pipelines in the business. And all of our companies continue to be underpinned by good projects, in good places. At Pure Gold, we have the large Madsen Gold Deposit in Red Lake Ontario, which is currently the highest grade gold development project in Canada today. We just finished a bankable feasibility study that’s underpinned by a two million ounce indicated resource, at almost nine grams per ton, with another half million ounces of inferred gold. It’s going through the final permitting process and ultimately the goal is to become the next Canadian producer.
Liberty is rapidly advancing three big open pit gold projects in the Great Basin of the United States. They’re excellent projects in a Tier 1 jurisdiction. We recently put out a PEA on Gold Strike and it shows that it’s got the makings of an excellent low cost mine. It’s very appealing. And we’re about to start drilling Black Pine, which is another big Carlin-style gold system that has exciting size potential.
Finally, Sun Metals, we just made a highly disruptive discovery in BC, which was frankly, one of the best high grade copper-gold intercepts in Canada in 2018. We’re about to get back in there this summer and continue drilling to build continuity and size. We are all very excited. So, all of our businesses are underpinned by real projects and that’s been the key to our success.
Brian: Over the course of my life, I have learned that a large portion of what it takes to be successful is not being afraid of failure. The caveat being that it doesn’t pay to be irrationally courageous, either. Firstly, do you agree? Secondly, can you give an example, in terms of your personal resource sector career, of how you used this philosophy to overcome adversity and be successful?
Mark: I would agree with both points, this business is like a treasure hunt, and you know you’re going to make a lot of wrong turns, and hit a lot of dead ends along the way. But when you persevere and ultimately get to the prize, the reward can be spectacular for everyone, and it’s worth it.
We look at dozens and dozens of projects every year, and the key is to know, A, what makes a good project, and those are things like grade, size, strip ratio, metallurgy, all those kinds of things. The second is knowing when to keep going and when to stop.
In my opinion, it is perfectly fine and, in fact, preferable to cut your losses and move on, if your project isn’t shaping up into something meaningful. So, maybe the metallurgy is fatal, or the strip ratio is too high, or the grade is too low, or maybe you just got the geology all wrong. Whatever the reason, failure is part of this business and winning teams in my opinion need to be able to try and fail and quickly move on to a better project. That’s what investors expect of you.
Brian: For me, jurisdictional risk is an interesting subject because everyone has their own criteria for what constitutes risk. For most, jurisdictional risk is most closely tied to the politics of the country in question, or the politics of a neighbouring country.
Over the course of your career, you have worked in and run mining companies in a variety of different countries around the world. These countries range from premier jurisdictions, like Canada and the United States, to some of the more difficult places, like Burkina Faso and Turkey. How have these experiences shaped the way you view jurisdictional risk?
Mark: In my view, risk comes in many forms and I put risk in two categories. One is subterranean risk. Everything below the ground, and the other is above ground risk. And so, 50 years ago in our sector, all the risk associated with mining was subterranean and related to the deposit itself. Did it have the grade and the size or not? And today, all those subterranean risks are still there, to the exact same extent, but layered on top of it all are the above ground risks. Which are, in many ways, far more challenging, because they’re difficult to manage and they can take a lot of time.
I’m talking about things like regulatory, permitting, social, and geo political risk, and mining is under increased scrutiny today. Regardless of the jurisdiction you’re in these days, each jurisdiction has its challenges, whether it’s from local communities or an environmental group.
From day one, your project needs to be positioned in a way that benefits the local community, regardless of where you are. And that means employment, a better way of life and environmental protection, and if you get these three correct right out of the gate, then you are at least increasing your chances of success down the road.
Brian: At the moment, bearish sentiment within the resource sector appears to be very prevalent. As a consequence, many of the junior companies that I have spoken to are finding it very hard to raise cash to further develop their projects. Oxygen Capital companies have a great reputation when it comes to their ability to raise cash. First, how is it that Oxygen companies are able to raise cash in difficult markets and, second, in your opinion, why is the junior resource sector on a whole, seemingly, having a hard time attracting investment capital?
Mark: Since 2013, we’ve been in a bear market; gold spiked at US$1890 /oz in 2012, and then we’ve been bumping along in the US$1200s to US$1300 range for about six years now. And, during this period, there have been some pretty massive structural changes, with traditional funding having exited the space and dried up. ETF flows have stolen liquidity, and passive money is taken over from active money. During this period, we’ve been able to stick to our knitting and we’ve been focused on buying, exploring and advancing great projects in great places, and building our pipeline. Our businesses have been able to grow in this bear market because we’ve been able to attract some of the best investors and name brand backers in the sector, and I’m extremely thankful for their support in backing our companies. Since 2012, we’ve raised about $500 million dollars in 30 finances. And that includes the CapEx to build the Karma open-pit mine in Burkina Faso.
The biggest challenge to raising new capital today is the decimation of actively managed resource funds. These funds kept the ecosystem going for decades and most of that capital has now migrated into passively managed ETFs, which don’t participate in financings. It has also shifted into other speculative industries, which hasn’t helped. But I do fundamentally believe, that the relevance and approval of the sector is going to have a renaissance as the demand for green technologies puts a bigger and bigger focus on the need for metals in our modern lives.
Brian: Having attended many resource sector focused investment conferences over the years, it’s clear, to me at least, that the majority of investors in the sector are in their, so-to-speak, ‘golden years.’ The younger generations, mainly the millennials, on mass, are virtually absent, with their attention seemingly more focused on cannabis and crypto. The question that comes to my mind is, why? Is it a matter of relatability? In your opinion, why has the resource sector failed to attract the millennial generation’s investment dollars, thus far?
Mark: I think that is an important question, but I’m not sure we’re getting the answer right. The broader market has been booming, other sectors have been on fire and generating great returns, in sectors that are more topical and, frankly, cooler. In contrast, you look at the mining space and the equities have been going down for eight years, so there hasn’t been an opportunity for them to make any money. So, they’ve been staying away and that’s one answer.
The other answer, I think there’s a cognitive dissonance between understanding the role of mining in propelling a greener, more sustainable society. That vision requires metals. And, ultimately, I think a connection needs to be made by people, who are embracing electric vehicles, wind turbines, solar panels, and recognize that they all require metals. Lots of metal, which can be extracted without destroying the environment.
As an example, Tesla just published an article today saying there’s not going to be enough metal to supply the electric vehicle demand that’s anticipated. And that’s all copper, cobalt, nickel, etc. What end consumers and investors need to realize is that, mining and environmentalism are all part of the same continuum. We’re all on the same team. And people can feel good about extracting metals from the ground, to build a sustainable greener future, while still protecting the environment. It all needs to be able to coexist as part of the same ecosystem.
Brian: Within Oxygen, you tend to focus on de-risked projects as part of your ethos. A great example of an advanced de-risked project would be the Madsen Red Lake Gold Mine, which is owned by Pure Gold, in Red Lake, Ontario. Red Lake is a prolific district. What are your reasons for focusing on gold right now and what do you see as a future for Red Lake?
Mark: Almost all of our success as a group comes from projects that have been worked on in the past and we have effectively “rediscovered” them. We can include the Michelin Project that Aurora had, Goldstrike and Black Pine at Liberty Gold, Karma at True Gold, Long Canyon at Fronteer Gold and Madsen at Pure Gold. These were all past producing mines or previous exploration projects that were forgotten and put away for various reasons including low metal prices or changes to corporate direction.
Madsen is a perfect example to highlight. This was a past producing mine for 38 years, it produced 2.5 million ounces of gold and effectively lay dormant for 20 years, owned by the predecessor company Claude Resources, who worked on it intermittently, but never advanced it to the stage of developing a new geological understanding and getting it back into production.
Pure Gold picked it up in 2014, and consolidated the property for a net cost of $8.7 million dollars and the team has focused on re-interpreting, compiling, integrating, every bit of data they could for two years on this project. We came up with a new geological model and the Company is now sitting on the highest grade development gold project in Canada, with a million ounces of reserves, drilled off at six-and-half meter centers, and sitting within a 2.1 million ounce indicated resource with another half million ounces of inferred resource. It’s an extraordinary accomplishment and these are all new ounces. This is not a remnant project that we’re going to go in and salvage. These are brand new ounces sitting outside of historical development. So, that’s a pretty important fact to include in there.
Madsen, even though it’s evolved from a historical legacy project, it is actually a big part of the future of Red Lake. It’s a sunrise asset today. We’re about to move through the final permitting process and into production with a high grade gold reserve of one million ounces, with the potential to provide decades of production in Red Lake. Meanwhile, the Red Lake mine complex itself is a sunset asset and it’s starting to wane. So, I think Madsen is going to be a very, very important component of the whole consolidated Red Lake package.
Brian: In my opinion, distinguishing if management teams are owners or if they are solely employees is integral to understanding the motivation the team has to succeed. Not only is it integral to understand how much of the company insiders own, but at what price.
How important do you think it is that management own shares in their own companies?
Mark: I think it’s vital, I think it’s one of the most important things that a shareholder should look at, when they invest in a company. How much skin in the game does the management have? There’s a massive difference between being an employee and being an owner. Being an owner of your company, through owning a significant portion of shares, is a really strong testament to your dedication and your focus on making it a successful venture. For example, at Pure Gold, we recently had five year options that were about to expire last month and everybody in the group, all the board and senior management, exercised those options and held the stock, adding three million shares of insider ownership to the books.
One of the things I have learned over the years is that when you have a project that you truly believe in, own as much of it as possible. I’m one of the largest shareholders in each of the oxygen companies, and have been regularly adding to my position at Pure Gold and Liberty Gold.
Brian: Mark, it has been a pleasure. Thank you very much for sharing your thoughts on the resource sector and, most importantly, educating us on the Oxygen Capital group of companies. Before we end, do you have any final thoughts or advice for resource sector investors in 2019 and beyond?
Mark: I will leave you with a quote from Miles Davis, who knew what he was talking about when it came to jazz when he said, “Time is not the main thing. It’s the only thing.” He wasn’t talking about mining, obviously, he was talking about music. But I think it is equally applicable to the mining sectors.
In this business or any cyclical business, if you get the timing right, the results can be spectacular, beautiful. And to me, it feels very much like the timing is right for the resource stocks to resurface and breakout from this bear market in the very near term.
Don’t want to miss a new investment idea, interview or financial product review? Become a Junior Stock Review VIP now – it’s FREE!
Until next time,
Brian Leni P.Eng
Founder – Junior Stock Review
Disclaimer: The following is not an investment recommendation, it is an investment idea. I am not a certified investment professional, nor do I know you and your individual investment needs. Please perform your own due diligence to decide whether this is a company and sector that is best suited for your personal investment criteria. I do NOT own shares in any of the companies discussed in the interview. I have NO business relationship with Oxygen Capital or any of its associated companies.
Brian Paes-Braga is a Vancouver financier and entrepreneur, known for his notable work in founding and developing the lithium resource company, Lithium X. The company raised roughly $50 million and just two years after going public was sold to NextView New Energy Lion Hong Kong Limited for $265 million in March 2018.
Today, Brian Paes-Braga serves as Principal, Head of Merchant Banking at SAF Group, a leading structured credit and merchant banking group which builds, invests, finances and advises high growth companies. He is also on the board of directors at Thunderbird Entertainment Group and DeepGreen Metals and an Advisory Council member of the International Crisis Group, as well as supports a range of charitable organizations through his Quiet Cove Foundation.
You’ve been a successful entrepreneur for a number of years and have worked in several industries outside of the resource sector. From your experience , what are the ingredients to successfully financing and building strong companies like Lithium X?
Brian Paes-Braga: I think it starts with people and who you hire and whether there is synergy among your team members. I know we had that at Lithium X. It’s also important to respect the share structure of the company, and that means being honest with your shareholders while you continue to raise capital. Luck plays a part and we certainly were lucky in terms of timing and lithium prices when the company went public.
On the subject of Lithium X, the company was sold just two years after going public and you managed to maximize shareholder return. Was that always the plan for Lithium X or did a buyer appear at the right time?
Brian Paes-Braga: I established this company based on the belief that we need to wean the world off fossil fuels. That was the mission of Lithium X. We were confident that the buyer, NextView New Energy, shared the same commitment to developing the lithium sector. True, the $50 million we raised to secure lithium-development projects paid off when we sold the company but that wasn’t our main objective.
You pitched business mentor and renowned Vancouver mining financier Frank Giustra on the idea of building a lithium company and you also attracted another top mining figure, Paul Matysek, who had previously served as CEO of Potash One and Lithium One. How did you manage to convince Giustra and Matysek to join the project?
Brian Paes-Braga: My background as an investment banker helping resource companies raise money for projects led me to believe that lithium had the right supply/demand outlook for getting into business. I did my research on the lithium sector and the demand for lithium-based batteries in China. I think that both Giustra and Matysek saw the potential in the lithium market and were equally excited about the project. Mentors have always been very important to me. Frank Giustra was someone I had looked up to from a very young age and I’ve learned a lot from him.
You are a believer in giving back to the community through your work with various charities and your private foundation, the Quiet Cove Foundation. Can you talk about why charitable giving is important to you?
Brian Paes-Braga: At the center of my work in the business world is the desire to remain philanthropically conscious. I have now travelled the world on various mission trips close to my heart, including working with Syrian refugees in Greece and building schools in Peru. I wanted to devote more time to philanthropy and projects I cared deeply for and that was the reason we created the Quiet Cove Foundation. It focuses on supporting innovative solutions for large scale social issues. We encourage charities to think big, take risks, and disrupt the status quo.
Rockridge Resources (TSX-V: ROCK) is a fairly new mineral exploration company focused on the acquisition, exploration & development of mineral resource properties in Canada. Its focus is copper & base metals. More specifically, base, green energy & battery metals, of which copper is all three! Not just any place in Canada, world-class mining jurisdictions such as Saskatchewan. And, not just good jurisdictions, but in mining camps with significant past exploration, development or production, in close proximity to key mining infrastructure.
The company’s flagship project Knife Lake is in Saskatchewan, Canada, (ranked 3rd best mining jurisdiction in the world) in the Fraser Institute Mining Company Survey. The Project hosts the Knife Lake deposit, a near-surface, (high-grade copper) VMS copper-cobalt-gold-silver-zinc deposit open along strike and at depth. Management believes there’s strong discovery potential in and around the deposit area, and at additional targets on ~85,000 hectares of contiguous claims.
On May 7, Rockridge reported additional results from its Winter diamond drill program at its flagship Knife Lake project in Saskatchewan. Hot on the heels of last week’s press release (April 30th) of 2 holes, comes 3 more. I was planning on writing an article on those excellent results, but Equity.Guru beat me to the punch, putting out this well done piece. Readers following along may recall that the key takeaway was that holes KF19001 & KF19002 largely confirmed historical grades, intercept widths & geological conditions. Fast forward to May 7th, and management’s interpretation of drill holes KF19003, KF19004 & KF19005 was announced. Results on the remaining 7 holes will be released over the next 20-30 days. As a reminder, Rockridge has an option agreement with Eagle Plains Resources to acquire a 100% Interest in the majority of the Knife Lake Cu-Zn-Ag-Au-Co VMS deposit.
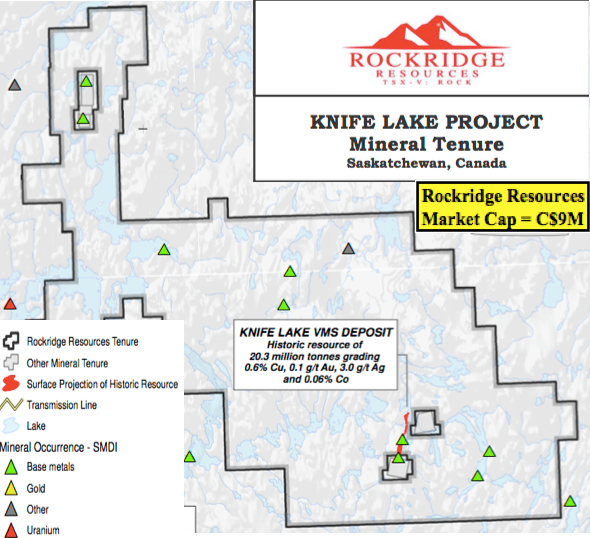
Earlier this year, Rockridge drilled 12 holes for a total of 1,053 meters. Importantly, this represents the first work on the property since 2001. Readers may recall from reading past articles & interviews on Epstein Research and Equity.Guru and viewing videos of CEO Trimble, that the company’s primary goal is to explore districts that have been under-explored, never explored, or not recently explored. Management’s highly skilled and experienced technical team & advisors deploy the latest exploration technologies & methods. A lot has changed in 18 years; a simple example would be the use of drones to fly various surveys.
Whatever management is doing seems to be working, as evidenced by 2 of the first 5 holes returning very strong results, and the third hole, KF19003 a true blockbuster.
Hole KF19003 was even better than the first 2 holes. In fact, significantly better, with a grade (Cu Eq.) x thickness (in meters) value of 91, compared to 41 & 49. Make no mistake, KF19001 / 19002 were great, they averaged 1.21 Cu Eq. over an average 38.5m. But, KF19003, WAS something to write home about…. [if under the age of 30, Google the idiom, “nothing to write home about“]. Near-surface like the first 2 holes, the 37.6m interval assayed 2% Cu, 0.2 g/t Au, 9.9 g/t Ag, 0.36% Zn & 0.01% Co, for an estimated 2.42% Cu Eq. grade. 2% Cu over 37.6 meters is a tremendous showing at under 41 meters downhole.
Holes KF19004 & KF19005 were mineralized, but had narrower intercept widths of interest. Still, there were attractive Cu Eq. grades (1.25% & 1.20%, respectively). Interestingly, Gallium (up to 25.6 ppm) & Indium (up to 15.2 ppm) values were found in the mineralized zones of all 3 holes. Those 2 Rare Earth Metals trade at an average of about US$300/kg. Each 10 ppm = 1kg/tonne. KF19004 & KF19005 confirmed mineralization up-dip of historically drilled high grade mineralization. So, those 2 holes were like KF19001 & KF19002, important in building the potential resource size. All activities are advancing the Project toward a NI 43-101 compliant mineral resource estimate later this year.
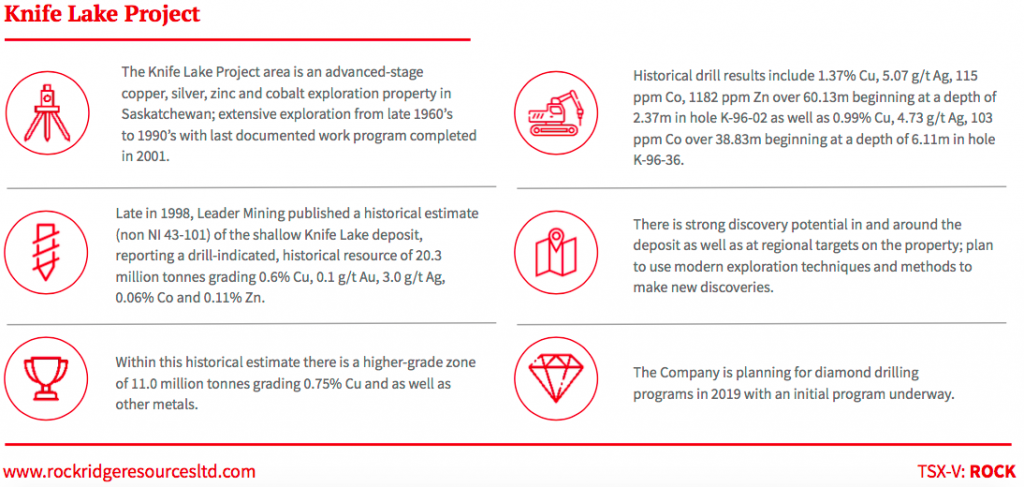
Perhaps best of all, drill hole KF19003 confirmed high-grade mineralization up-dip of KF19002 in an area where no historical drilling is known to have been done. Therefore, this assay, and perhaps nearby assays to follow, will increase the size & grade of the upcoming mineral resource estimate. There were also encouraging zinc values, incl. 4m (from the 37.6m) of 1.32% Zn, nearly C$50/tonne rock. Gold values up to 0.63 g/t are interesting, but like the zinc, I’m referring to only the best grades, from smaller intercepts. That 4m interval I mentioned also had 7.54% Cu. This is clearly a COPPER deposit, Knife Lake is a near-surface, high-grade Cu project. See drill hole results from KF19001 – KF19005 below. Holes KF19001 & KF19002 were released on April 30, and KF19003-KF19005 on May 7.
Rockridge’s President & CEO, Jordan Trimble commented: “The results from drill hole KF19003, specifically 2.42% Cu Eq. over 37.6m, far exceeded our expectations and represents one of the best holes ever drilled on the project. It is important to note that this drill hole was collared in an area where no historical drilling has been reported. As such these drill results are expected to have a positive impact on the historical resource. Final results from the remaining 7 drill holes are pending and will provide steady news flow over the near term.”
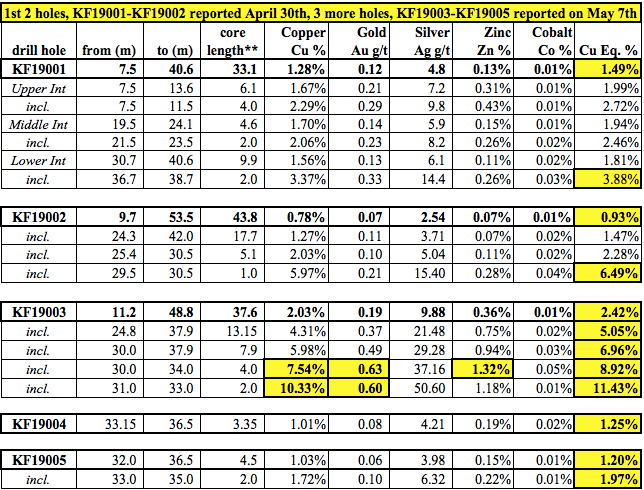
Drill indicated intercepts (core length) are reported as drilled widths and true thickness is undetermined. {details about calculation of Cu Eq. grade can be found in the press release}.{details about calculation of Cu Eq. grade can be found in the press release}.
From the press release, “The Knife Lake area saw extensive exploration from the late 1960s to the 1990s with the last documented work program completed in 2001. Between 1996 & 1998, Leader Mining completed 315 diamond drill holes, outlining a broad zone of mineralization occurring at a depth of less than 100 m. Late in 1998, Leader published an historical estimate, reporting a, “drill-indicated” resource of 20.3 M tonnes, grading 0.6% Cu, 0.1 g/t Au, 3 g/t Ag, 0.06% Co & 0.11% Zn. Within the historical estimate there is a higher grade zone containing 11.0 M tonnes of 0.75% Cu, plus other metals.”
NOTE: These mineral resource estimates are not supported by a compliant NI 43-101 technical report. A qualified person has not done the work to classify these estimates as current mineral resources in accordance with NI 43-101 standards. Furthermore, the categories used for these historical resource estimates are described as, “drill-indicated”. This is not a NI 43-101 resource category, but based on the methodologies & drill hole spacing, management believes it would likely be classified as Inferred.
The Project is within the word famous Flin Flon-Snow Lake mining district that contains a prolific VMS base metals belt. Management paid < half a penny/lb. of copper and they believe there’s tremendous exploration upside. The goal? High-grade discoveries in a mineralized belt that could host multiple deposits, as VMS-style zones often contain clusters of mineralized zones. Of course, the trick is finding them. No modern exploration, drilling or technology has been deployed at Knife Lake. It was discovered 50 years ago and last explored in the 1990s. Airborne geophysics, regional mapping & geochemistry was done. Management believes that modern geophysics; high resolution, deep penetrating EM & drone mag surveys to cover large areas in detail, could make a big difference.
The deposit remains open at depth. Additional discoveries are very possible as the property is > 85,000 hectares in size. The winter drill program marks the end of the beginning of this highly prospective project. Importantly, the program gives the company’s technical team valuable information about geology, alteration & mineralization that will be applied to regional exploration targets. According to the press release, most of the historical work was shallow drilling in and around the deposit area. Very little regional or district work has been documented. In fact, there wasn’t even much drilling done below the deposit. That’s why management is optimistic about discovery potential both at depth and regionally. I’m excited to see what the next 7 assays add to the Rockridge Resources (TSX-V: ROCK) story!
Peter Epstein
May 9, 2019
Disclosures: The content of this article is for information only. Readers fully understand and agree that nothing contained herein, written by Peter Epstein about Rockridge Resources, including but not limited to, commentary, opinions, views, assumptions, reported facts, calculations, etc. is to be considered implicit or explicit investment advice. Nothing contained herein is a recommendation or solicitation to buy or sell any security. [ER] is not responsible under any circumstances for investment actions taken by the reader. [ER] has never been, and is not currently, a registered or licensed financial advisor or broker/dealer, investment advisor, stockbroker, trader, money manager, compliance or legal officer, and does not perform market making activities. [ER] is not directly employed by any company, group, organization, party or person. The shares of Rockridge Resources are highly speculative, not suitable for all investors. Readers understand and agree that investments in small cap stocks can result in a 100% loss of invested funds. It is assumed and agreed upon by readers that they will consult with their own licensed or registered financial advisors before making any investment decisions.
At the time this article was posted, Peter Epstein owned stock in Rockridge Resources and the Company was an advertiser on [ER]. Readers understand and agree that they must conduct their own due diligence above and beyond reading this article. While the author believes he’s diligent in screening out companies that, for any reasons whatsoever, are unattractive investment opportunities, he cannot guarantee that his efforts will (or have been) successful. [ER] is not responsible for any perceived, or actual, errors including, but not limited to, commentary, opinions, views, assumptions, reported facts & financial calculations, or for the completeness of this article or future content. [ER] is not expected or required to subsequently follow or cover events & news, or write about any particular company or topic. [ER] is not an expert in any company, industry sector or investment topic.
In February, Blue Sky Uranium (TSX-V: BSK; OTC: BKUCF) delivered a very positive Preliminary Economic Assessment (“PEA“) on the Ivana uranium-vanadium deposit at the Company’s 100%-owned Amarillo Grande project in Argentina. The after-tax IRR & NPV is 29.3% & $135M. The upfront cap-ex is estimated at $128M. Importantly, the all-in sustaining cost is estimated to be in the lowest quartile of the global cost curve, at $18.27/lb. The resource contains nearly 23M pounds uranium, plus 12M pounds vanadium. These indicative economics are based on just a 13-yr. mine life. The metrics are strong, but they could get even better. CEO Niko Cacos has stated in recent interviews that the next C$2-$3M capital raise (probably in May) will fund them into the 4th quarter, and pay for well over 100 shallow drill holes that could potentially double the resource size.
The Company is well on its way to a larger resource. On April 29, Blue Sky Uranium reported,
“additional high-grade uranium & vanadium results from pit sampling carried out in the area immediately west of the Ivana Uranium-Vanadium deposit, at the Company’s wholly-owned Amarillo Grande Project in Rio Negro, Argentina. This newly-identified near-surface mineralization is open to expansion, as indicated on Figure 1, (https://bit. ly/2IZknLO) but drilling is required for further testing as the target zone is interpreted to be at greater depth in adjacent areas.”
Doubling the resource would provide a strong foundation for a blockbuster Pre-Feasibility Study (“PFS“) next year. Ultimately, management believes there’s potential for > 100 M pounds uranium, which might include > 50 M pounds vanadium. That would take longer to drill out, so I’m assuming a doubling in the next 9 months and a PFS completed in about a year from now. In my opinion, all else equal, a PFS could show an after-tax IRR > 35% and all-in sustaining costs of $16-$17/lb. The mine life could be extended to 20+ years, or annual production of uranium + vanadium in the initial 10 years could be significantly increased.
Therefore, if management is correct in their belief that a doubling of the resource is possible by 1H 2020, then the current market cap of C$20M = US$15M could be an attractive entry point. If over a longer time frame the Company could triple, quadruple or quintuple the current resource, then instead of bottom quartile costs, they could be looking at a project in the bottom decile. However, they don’t need to spend the time & money this year or next to get anywhere near 100 M pounds of uranium on the books. They have to deliver a strong PFS and then assess the uranium market at that time. If the market has improved, I think that Blue Sky could start production by 2022.
Uranium & vanadium prices over the past 6 months have had a negative impact on company share prices. Uranium bottomed at about $17.5/lb. in 2016, but rebounded to a bit over $29/lb. in Q4 of last year. Sentiment started to shift, momentum seemed to be gaining, but the spot price stalled. It now sits at close to $26/lb. Likewise, vanadium had a tremendous run, from about $3/lb. 3 years ago to just shy of $34/lb. in early November, 2018. Since then vanadium pentoxide (China price) has fallen to ~$12/lb., down 65%. As an aside, cobalt is off about 62% from its 52-week high.
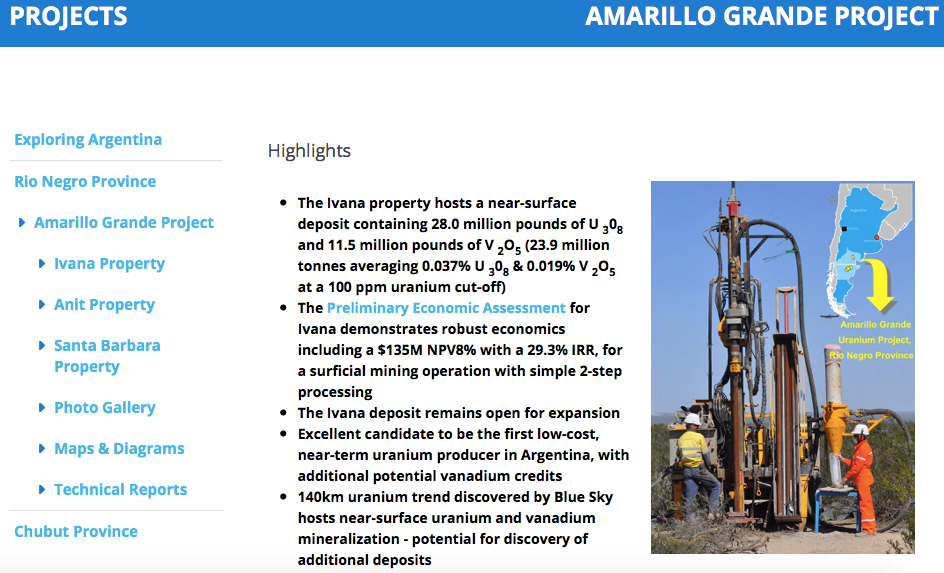
Most analysts & industry pundits believe that both vanadium & uranium prices are headed higher by year-end and higher again in 2020. For vanadium, a price between $10-$20/lb. could be the new normal. Blue Sky doesn’t need a high vanadium price, it’s just icing on the cake. At $10/lb., it doesn’t help project economics all that much. At $20/lb. it has a moderately favourable impact. The PEA uses a $15/lb. price assumption.
Everyone talks about the spot price when they discuss uranium. The spot price is ~$26/lb., but the long-term contract price is quoted at $32/lb. {See Cameco’s pricing page}. Notice that the spread between contract & spot prices over the past 4.25 years ranged from 7% to 89% and averaged 37%. Currently the spread is about 23%. All Blue Sky needs to start production early next decade is $10/lb. more in the spot price, which would likely translate to a contract price in the mid $40’s/lb. The Company doesn’t need that price this year, or even next year. Early 2021 would be perfect timing.
According to the PEA, Blue Sky’s Project has a 20% IRR at $40/lb., and that will likely improve in the upcoming PFS.
It’s not rocket science to understand why prices should rise…. Utilities have been on the sidelines for years, buying in the spot market, letting uranium inventories shrink, because they are not worried about re-supplying. All of that will change beginning next year, and more in 2021-2022. In fact, in 2021-25 global utilities are most exposed to a potential spike in prices (they’re increasingly un-contracted). Blue Sky could time the market perfectly by commencing production in 2022. Of the 60-80 uranium juniors, how many could possibly be in production as soon as 2022? I’m thinking less than 6. Why so few? Most are at exploration stage in jurisdictions where it routinely takes 5 to 15 years to reach production, (if ever). Many can’t raise capital, so their projects are dead in the water.
And, for those who are more advanced, if they require a minimum of $50+/lb. to get off the ground, they could be stalled as well. Once the market realizes that a) uranium prices are headed higher, (but not necessarily to $50+/lb. anytime soon), b) an ideal time to enter production would be in the first half of next decade, and c) sustainable low cost & security of supply will be critically important — there could be a tsunami of capital pouring into just a handful of uranium juniors. Blue Sky Uranium would likely be one of the first to benefit. And, with a market cap of just US$15M, it could become an attractive takeover target.
I mention security of supply, the Section 232 Petition in the U.S. makes it clear that uranium imports into North America & Europe, are increasingly from State-owned or controlled enterprises in adversarial countries like Russia and its allies, or countries heavily influenced by China. Energy Fuels states in a recent press release that, “greater than 60% of newly mined uranium now comes from State-owned enterprises that unfriendly nations own or control.”
If or when the U.S., the largest consumer of uranium in the world, faces a challenge in obtaining uranium, even if it starts to look like there might be a problem…. utilities will be anxious to source uranium from safe havens. Argentina certainly qualifies as a safe haven. Management has been operating natural resource companies in Argentina for well over 20 years, they have extensive contacts and vast experience in the country. They believe that first production could be in 2021, I’m saying 2022 to be conservative. Whether it’s 2021, 2022 or 2023, that’s still near-term production compared to the vast majority of uranium peers, most of whom need $50+/lb. uranium or are in jurisdictions known to take a long time to advance projects into production.
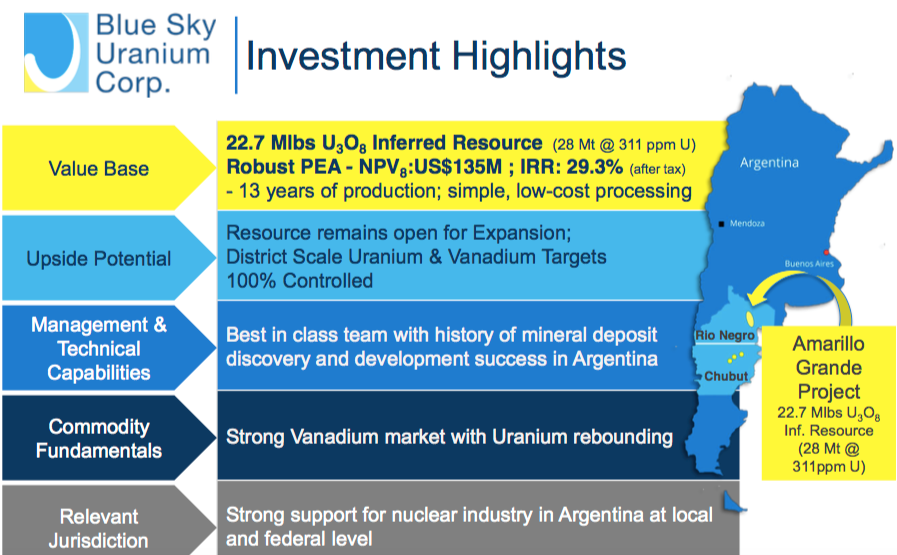
Fewer than 6. That’s right, I said fewer than 6 uranium juniors could reach production by 2022, if the long-term contract price remains below $50/lb. Think about that for a moment. By contrast, there are over 300 cannabis-hemp related companies listed in Canada and/or the U.S. A lot of those companies will be viable or will be acquired. It’s really hard to pick the best cannabis plays, but if one wants to place a bet on uranium, Blue Sky Uranium deserves to be high on the list of names to consider.
Peter Epstein
May 3, 2019
Disclosures: The content of this article is for information only. Readers fully understand and agree that nothing contained herein, written by Peter Epstein of Epstein Research [ER], (together, [ER]) about Blue Sky Uranium, including but not limited to, commentary, opinions, views, assumptions, reported facts, calculations, etc. is not to be considered implicit or explicit investment advice. Nothing contained herein is a recommendation or solicitation to buy or sell any security. ER] is not responsible under any circumstances for investment actions taken by the reader. [ER] has never been, and is not currently, a registered or licensed financial advisor or broker/dealer, investment advisor, stockbroker, trader, money manager, compliance or legal officer, and does not perform market making activities. [ER] is not directly employed by any company, group, organization, party or person. The shares of Blue Sky Uranium are highly speculative, not suitable for all investors. Readers understand and agree that investments in small cap stocks can result in a 100% loss of invested funds. It is assumed and agreed upon by readers that they will consult with their own licensed or registered financial advisors before making any investment decisions.
At the time this article was posted, Peter Epstein owned no shares of Blue Sky Uranium and Blue Sky was an advertiser on [ER]. Readers understand and agree that they must conduct their own due diligence above and beyond reading this article. While the author believes he’s diligent in screening out companies that, for any reasons whatsoever, are unattractive investment opportunities, he cannot guarantee that his efforts will (or have been) successful. [ER] is not responsible for any perceived, or actual, errors including, but not limited to, commentary, opinions, views, assumptions, reported facts & financial calculations, or for the completeness of this article or future content. [ER] is not expected or required to subsequently follow or cover events & news, or write about any particular company or topic. [ER] is not an expert in any company, industry sector or investment topic.
Eskay Creek, formerly the world’s highest-grade gold mine, may be headed for a re-start due to very promising exploration work completed by Skeena Resources (TSX.V: SKE).
Eskay Creek was operated by Barrick Gold until shutting down in 2008 due to a combination of high operating costs and a low gold price. Skeena picked up the option to explore the closed mine and has been working diligently on the project for the last two years.
Skeena has proved up a 4-million ounce gold equivalent resource at 4.5 grams/ton (indicated and inferred) open pit. The open pit aspect makes this a tantalizing prospect for investors.
Skeena sees a pathway to making the ultimate total resource larger and bringing the grade closer to 6 grams/ton. Work over the next year will determine the viability of re-opening the mine. Skeena believes Eskay Creek is the best open pit deposit of any junior miner in the world, and the stock price is yet to reflect this.
Jonathan Roth of CEO.ca sat down with Skeena’s CEO Walter Coles, Jr. and Skeena’s VP of Communications Kelly Earle to discuss the company’s discoveries, what the next steps are, and why investors should be paying attention.
Jonathan Roth: What attracted you to Skeena? Because obviously you had a lot of options. Why would you come to Skeena?
Kelly Earle: So, I was initially drawn to the Golden Triangle, the assets they were bringing into the fold, the possibility of acquiring two past producing mines as legendary as Snip and Eskay Creek. So that’s really what drew me in. But then what kept me here was really the team, a really young, keen team that I think is really the future of junior mining in Vancouver.
Jonathan Roth: Why don’t you unpack what you’ve discovered up at Eskay Creek?
Kelly Earle: So, at Eskay Creek, excitingly, we just announced a 4 million-ounce resource combined between indicated and inferred at 4.5 grams/ton open pit. To put that in context, most open pit mines operating today are around the one to two gram/ton mark. And ours is at 4.5 grams/ton and we see a pathway to bring it closer to six grams/ton. So, it’s a world class deposit from a once-legendary mine. Eskay Creek was the highest-grade gold producer in the world when it was in production. It’s very exciting to think that we’ve really just have found what’s left, what the remnants are. But even the remnants are extremely high grade by today’s standards.
Jonathan Roth: Barrick owned Eskay Creek and then they stopped mining at around 2007, 2008, somewhere around there?
Kelly Earle: Yes, 2008.
Jonathan Roth: So why did they stop, given the fact of what you folks have discovered?
Kelly Earle: We get this question a lot. It’s hard for people to understand: if it’s so great, if there’s 4 million ounces left there, why on earth did Barrick walk away? And it’s really just a function of the price of gold and how remote the mine was at the time.
So, when the mine was in operation, it was all diesel powered. So absolutely everything ran on diesel, which for the most part was flown in and flown out. There was road access, but it was still diesel powered. Secondly, the price of gold was significantly lower than it is today. So, the decision to shut the mine down was made in 2005. Price of gold was around $450, $500 an ounce. That meant the cutoff grade – to hit a 20 gram per ton head grade at the mill – they needed a 15 gram per ton cut-off grade, which is crazy by today’s standards.
So, anything below 15 grams per ton was just considered waste. So, if you look at it in the context of the time frame, it made sense that the mine shut down. Also, Barrick was just bringing Placer Dome on board, this was a big several hundred thousand ounce a year producer. The grades were dropping off at Eskay, the production annually was dropping off. It didn’t make sense to keep it open anymore because of how remote it was and the cost of producing it. So, in many ways we’re lucky because we’re left with the remnants that are now extremely high grade by today’s standards and the infrastructure has also improved dramatically since the mine was in production.
Jonathan Roth: The infrastructure obviously must be already there, and my understanding is that things are even easier to get in and out of there than they were say even a decade ago?
Kelly Earle: Within the last year, Highway 37 and the Northwest Transmission Line have been put in, which goes all the way up to Imperial Metals Red Chris Mine. Then within the last 10 years, there have been three hydroelectric facilities built between Snip and Eskay Creek. So, areas that were once all diesel operated for mines, we now have 4 cents a kilowatt hour power – so dramatically changes the opex.
We’ve talked to some engineers who said historically 50% of opex would have been diesel. Now with hydroelectric power, that would be more like 10 to 15%. So, it dramatically changes the cost to put it back into production. And at Eskay, the hydroelectric facility’s only seven kilometers away, down a paved road.
Jonathan Roth: This is Skeena’s CEO, Walter Coles Junior. The son of a very senior former US diplomat working in states that comprised the former Soviet Union, Coles is well versed in navigating the halls of power. Skeena’s projects are located in British Columbia, and Coles has made it a priority to maintain an excellent relationship with BC’s left leaning provincial government and local First Nations groups.
Walter Coles: For us, our experience with the NDP government has been phenomenal. From John Horgan as a premier to Michele Mungall, the mines minister; to her staff, Dave Nikolejsin, who’s a deputy mines minister. I’ll even shout out Peter Robb, who’s the assistant deputy mines minister. When we’ve had problems with delays in permitting, we go to Victoria and things are fixed right away.
Jonathan Roth: There’s been a general perception that the NDP government and British Columbia is not favorable to resource development projects. Obviously, you’ve seen the flip opposite of that?
Walter Coles: I think the facts can speak for themselves. BC has permitted more mines in Canada than any other province in the last three years. That speaks for itself. KSM last year got all their permits. The Red Mountain, IDM’s Red Mountain Mine got all of their permits. Pretium was permitted, I believe, in less than two years. I’m talking about the Brucejack Mine. Red Chris got all of, that’s Imperial Metals, was able to permit the Red Chris Mine. This is all on the Golden Triangle and all within the last three and a half years. In my view, there’s strong political support for mining in this province.
Jonathan Roth: So, what’s the game plan then moving forward?
Walter Coles: Our game plan is to aggressively advance Eskay Creek. The idea is we get the PEA done early in Q3 and we’ll immediately start, I hope, we’ll start pushing towards a feasibility study and we’ll probably start to permit Eskay Creek as well, to be able to put this mine back into production in the next couple years.
Jonathan Roth: So, you know obviously the resource market has been really tough for investors. It’s about as tough as it gets.
Walter Coles: Understatement.
Jonathan Roth: Right. So why, given the general market that’s out there, why should investors give you maybe a second or third look?
Walter Coles: It’s easy. In my mind, it comes down to Eskay and Snip. Snip is our other project, again, a past producing mine. There just aren’t deposits like this around the world. They’re very, very rare and our market cap right now today is about 40 million, 42 million Canadian. And we have 4 million ounces of very high grade, very attractive resource. It’s a combination of gold and silver, but I call it 4.5 million ounces of gold equivalent.
If you look at the valuations of other very well run companies, let’s say a Barkerville or let’s say an Osisko or let’s say an Ascot, as comparables to Skeena, all of those market caps are north of $175 million, and frankly we have more resource than any of those companies. And ours is open pit. The rest of them gotta go underground. So ours is easier mining. I would say adjusted for open pit versus underground, better grade, and we have more. And our market cap is like 15 to 20 percent of what these other companies are valued at. So, we are extremely undervalued right now. So if you’re an investor and you want to have exposure to precious metals, to gold, this is a way you can have leverage and the quality of the assets that we have right now, in my mind, would mean that your risk of losing money is probably a lot less than your risk of making a lot of money. That’s the kind of asymmetric investment opportunities all of us look for.
Jonathan Roth: So, you just mentioned a word there. You said undervalued. Why do you think Skeena’s been so undervalued for so long?
Walter Coles: Yeah, well, I would argue that our success at raising capital from some of the mining focused institutions, like mutual funds and hedge funds around the world, has come back to haunt us because there’s been a trend in the world of pulling capital out of actively managed investment funds and putting that capital into passively managed funds, like ETFs, index funds. So a lot of the mutual funds that we raise money from have faced redemptions over the last 18 months, and even though they told us they liked our project, their investors were pulling money out of their funds, so they were forced sellers of Skeena over the last year and a half. Unfortunately, in my mind, it’s like the worst in the 10 years that I’ve been involved with the sector, it’s the worst I’ve ever seen it. The consequence was we had forced sellers and there’s no bid, no buyers. So that’s taken Skeena down to the level it’s been in for the last six months. But I think we’re through all of that. I think those forced sellers are out and so I think the stock is now at an inflection point where there’s no more sellers. Now the question is: is there any stock available?
Jonathan Roth: What do you have going on now and what do you see happening over the next say six months to a year in terms of your work there?
Kelly Earle: So, we just put out the resource at Eskay that I mentioned, the 4 million ounces, and we’re working hard on metallurgy, because that is a question that we get a lot. Historically, there are a lot of deleterious elements, mercury, arsenic, that were associated. It’s a VMS deposit, volcanogenic massive sulfide deposit. You get extremely high grade, but then you also get some mercury and arsenic, so we’re working on the metallurgy now. We are very confident that it will be clean ore. We’re mining in mostly a different ore type than what was mined historically, but we need the metallurgy out and that report to show the market that it is going to be mineable. So that’s a key milestone that’s coming up for us within the next month.
Then after that, we’re going to be pushing forward on a preliminary economic assessment. So, we’re pretty excited about that. We run the numbers internally and they’re looking good. We’ve hired an engineering firm and we’ve brought an engineer on board to represent Skeena. So, we’re growing and we’re pushing towards that PEA and then while that’s all going on, we will be drilling.
I think people should give Skeena a look because of the amazing quality of Eskay Creek. I mentioned before about when I was part of Hod Maden I didn’t realize it at the time. I think Walter and I and the rest of our team are beginning to realize: this is an amazing deposit that we’re a part of. This is going to be one of the highest-grade open pit mines in North America, if not the world, when it goes back to production. It’s pretty rare that you sit on a brownfield site in a stable jurisdiction, with first nations and government support, 4 million ounces, 4.5 grams open pit. That’s a once-in-a-lifetime project to be a part of and I wholeheartedly believe that Eskay Creek will be back into production.
Walter Coles: We have something very special and it’s hard to find assets like this one. The Eskay Creek deposit is the best open pit deposit that any junior company in the entire world holds right now.
Courtesy: CEO.ca
Disclaimer
All statements in this report, other than statements of historical fact should be considered forward-looking statements. These statements relate to future events or future performance. Forward-looking statements are often, but not always identified by the use of words such as “seek”, “anticipate”, “plan”, “continue”, “estimate”, “expect”, “may”, “will”, “project”, “predict”, “potential”, “targeting”, “intend”, “could”, “might”, “should”, “believe” and similar expressions. Much of this report is comprised of statements of projection. These statements involve known and unknown risks, uncertainties and other factors that may cause actual results or events to differ materially from those anticipated in such forward-looking statements. Risks and uncertainties respecting mineral exploration companies are generally disclosed in the annual financial or other filing documents of those and similar companies as filed with the relevant securities commissions, and should be reviewed by any reader of this video.
Roth Multimedia executive producer Jonathan Roth is an online financial content producer. He is focused on researching and marketing resource and other public companies. Nothing in this video should be construed as a solicitation to buy or sell any securities mentioned anywhere in this video. This article is intended for informational and entertainment purposes only! Be advised Jonathan Roth is not a registered broker-dealer or financial advisor. Before investing in any securities, you should consult with your financial advisor and a registered broker-dealer. In many cases Jonathan Roth owns shares in the companies he features. For those reasons, please be aware that Jonathan Roth can be considered extremely biased in regards to the companies he writes about and features in his videos. Jonathan Roth does not own and never has owned any shares in Skeena Resources. He was paid for production of this video and another to be released at a later date.
Because Jonathan Roth has been paid by Skeena Resources, there is an inherent conflict of interest involved that may influence his perspective on Skeena Resources. This is why you should conduct extensive due diligence as well as seek the advice of your financial advisor and a registered broker-dealer before investing in any securities. Jonathan Roth may purchase shares of Skeena Resources for the purpose of selling them for his own profit and will buy or sell at any time without notice to anyone, including readers/viewers of this video.
Jonathan Roth shall not be liable for any damages, losses, or costs of any kind or type arising out of or in any way connected with the use of this video. You should independently investigate and fully understand all risks before investing. When investing in speculative stocks, it is possible to lose your entire investment.
Any decision to purchase or sell as a result of the opinions expressed in this report will be the full responsibility of the person authorizing such transaction, and should only be made after such person has consulted a registered financial advisor and conducted thorough due diligence. Information in this report has been obtained from sources considered to be reliable, but we do not guarantee that they are accurate or complete. Our views and opinions in this video are our own views and are based on information that we have received, which we assumed to be reliable. We do not guarantee that any of the companies mentioned in this video (specifically Skeena Resources) will perform as we expect, and any comparisons we have made to other companies may not be valid or come into effect.
Jonathan Roth does not undertake any obligation to publicly update or revise any statements made in this video & article.
Green shoots? Anyone seeing the green shoots of a Springtime recovery in lithium stocks? No, me neither…. However, I do note one positive development, Lithium Americas is receiving US$160M for 12.5% of its JV brine project in Argentina. That implies a C$1.7 billion valuation for the entire project, of which Lithium Americas will own half. This is the best news since POSCO paid US$280M to Galaxy Resources for 17,500 hectares in Catamarca province, Argentina. They paid US$16,000/ha for a reported 2.54 million tonnes of high-grade resources.
Speaking of Catamarca,that’s where CEO David Tafel’s company Portofino Resources (TSX-V: POR) controls 3 projects totaling > 8,600 hectares. One of the Projects is very near the projects of POSCO & Galaxy. Another is near Neo Lithium’s very high-grade 3Q project. I recognize I’m name dropping and playing the close-ology game, but Portofino has 3 shots at glory. Three legitimate chances of finding good, or even high-grade lithium deposits. Yet its market cap is just C$2M. This seems like attractive risk/reward to me.
Please give readers the latest snapshot of Portofino Resources.
Sure. Portofino Resources holds an interest in 3 lithium property groups in Argentina representing over 8,600 hectares. Our projects are located within the world-renowned “Lithium Triangle”, specifically focused in Catamarca Province, which was ranked by the Fraser Institute Annual Survey of Mining Companies, 2018, as the best mining province in Argentina. The Hombre Muerto West project is our most advanced and is within Argentina’s most prolific producing lithium brine Salar.
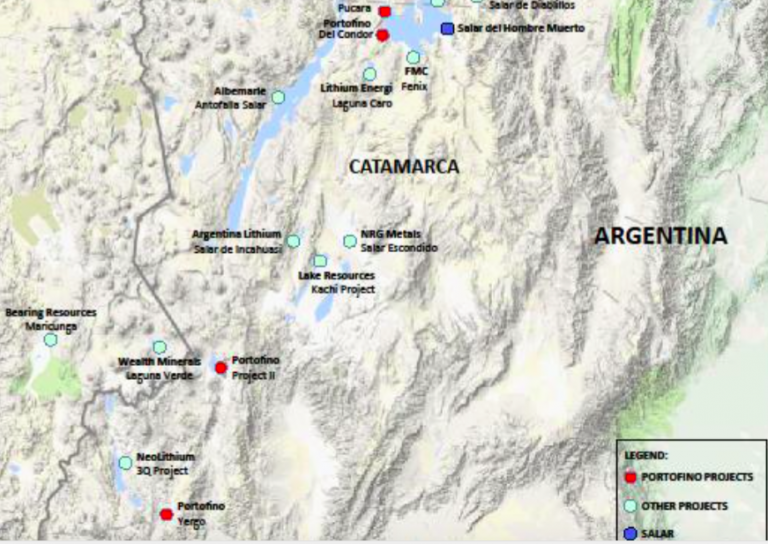
Portofino’s close neighbors in the Hombre del Muerto Salar include Majors– Livent Corp. (formerly FMC Lithium) and POSCO, and Australian-listed Galaxy Resources. All of our projects have been negotiated on the basis of 4-yr earn-in agreements with very low upfront costs. Between now and the end of next year, our total cash outlay is ~US$50K, for all 3 projects, and that’s not until 2020. I should add, we have no work commitments or royalties on any of our projects.
Very few lithium stocks are doing well lately, or over the past year for that matter. What’s your view of the sector?
Yes, it has been a very tough year for lithium stocks and lithium company shareholders, as the excitement for lithium projects has retreated and share trading has dried up. The market is no longer interested in companies with vast hectarage. It’s more about advancing projects with good addresses and good grades. Investors have become much more selective. However, a few companies with promising projects have begun to move up off their lows, and I believe this will continue. NOTE: {Bacanora Lithium, Lithium Americas & Neo Lithium are up an average of ~75% from their 52-week lows}
Tell us more about the Hombre Muerto West project, how many drill holes are planned?
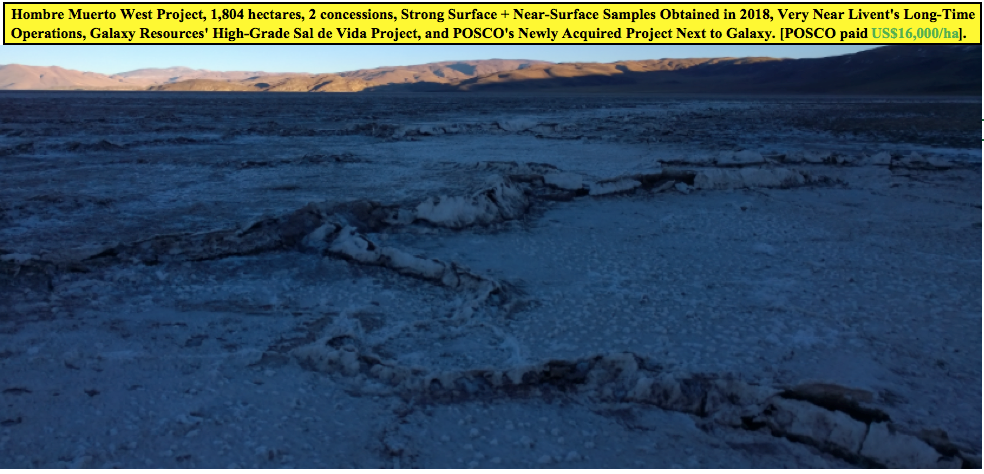
We have a team on site that should complete a geophysical survey by the end of April. This is a follow up on encouraging lithium results achieved during last year’s surface sampling. The present program will help define the extent of brine in the sub-surface, which will be used to define targets for initial drilling. We expect to generate at least 2 or 3 drill targets from the geophysics. Drilling should commence following interpretation of the survey results.
What grades & intercept widths would your team consider to be a success?
Depending upon geophysical results, we will likely drill to an initial depth of 150m and hope for grades exceeding 400-500 ml/L lithium over 75-100m.
What excites you most about Hombre Muerto West?
Our Hombre Muerto West project is located within the best known and top producing lithium brine Salar in Argentina. Galaxy Resources recently sold a portion of their holdings in the Salar to POSCO for US$280 million (US$16,000 per hectare!). In 2018, our geological team sampled 18 sites in a near-surface auger program. Six samples were over 700 mg/L lithium and the highest sample returned 1,031 mg/L lithium plus 9,511 mg/L potassium. The samples also contained low impurity levels, including low magnesium.
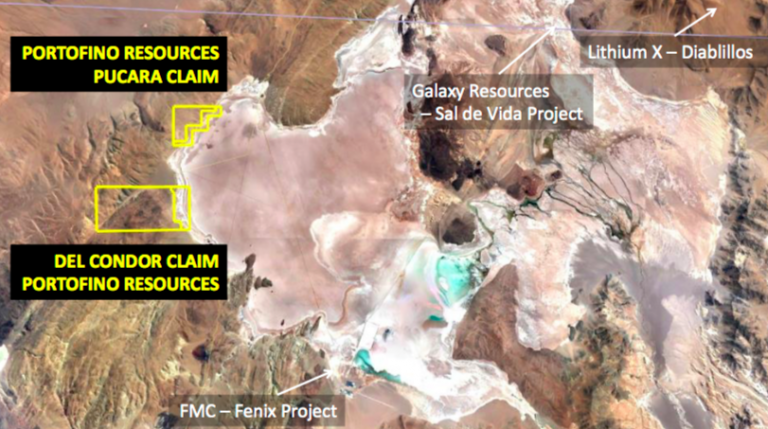
Please tell us more about your second project, named Project II.
Portofino can acquire 85% of Project II, which is 3,950 hectares in size, located approximately 10 km from the Chile border, and 65 km northeast of Neo Lithium Corp’s well known 3Q project. Historical exploration work included near-surface auger brine samples that averaged 274 mg/L lithium, with several in excess of 300 mg/L lithium.
What excites you most about Project II?
Project II captures the whole salar, has relatively easy access, and has returned consistent surface / near-surface sampling results over a wide area. In addition, the Maricunga (BFS completed) lithium project is located just across the Chile border. Maricunga is billed as the highest grade, undeveloped lithium salar project in the Americas.
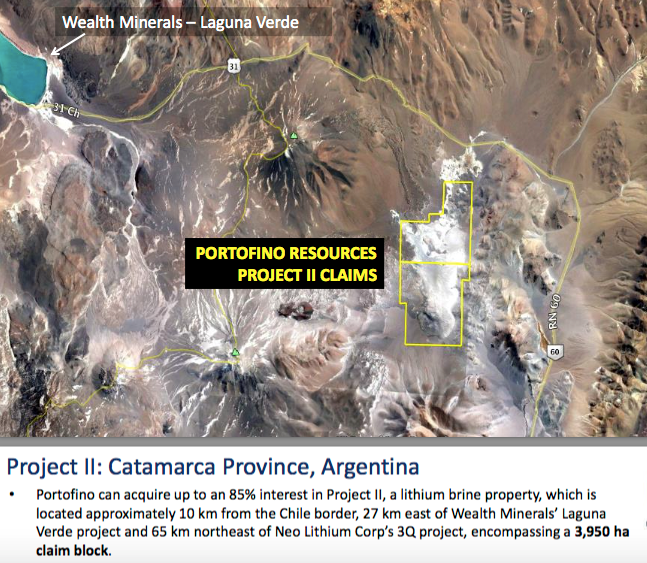
Are you in discussions with any potential strategic partners?
Yes, we are having preliminary discussions, off and on, with multiple interested parties. We would like to bring in a partner on one or more of our projects. However, there is no certainty that any agreements will be reached.
Please tell us more about your third project, Yergo.
Portofino has the right to acquire a 100% Interest in the 2,932 hectare Yergo lithium brine project. The property covers the entire Aparejos salar. Yergo is located approximately 15 km southeast of Neo Lithium Corp’s 3Q project. We completed an initial field exploration & sampling program consisting of surface & near-surface brine sampling & geological mapping. A total of 25 locations across the property were sampled. Samples have been shipped to a certified lab in Argentina. Results will be announced as soon as received.
You said that Yergo is ~15 km from Neo Lithium’s project. Neo just released a very favorable PFS. Does Yergo have anything in common with the 3Q?
Neo Lithium’s deposit is very high-grade with very low impurities. Our geological team just completed an initial sampling & mapping exploration program. We believe there are common characteristics. Once we have had a chance to review the results, we will be in a better position to comment further on commonalities.
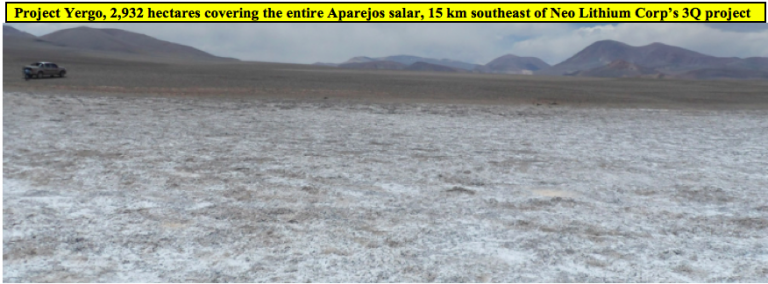
What excites you most about the Yergo project?
As mentioned, Yergo is close to Neo Lithium’s PFS-stage 3Q project, yet as far as we are aware, it had remained completely unexplored. Our geologists were quite upbeat after their visit and we are anxious to see the lab results of our initial sampling program.
Your 3 projects might be promising, but at 1,804 ha, 3,950 ha & 2,932 ha, are they large enough to host sizable resources?
Our Hombre Muerto West property is relatively small, about 1,800 hectares, but could still host a sizable resource subject to ultimate grade/basin determination. However, it would make sense to consolidate our project with another in the same salar. Our other 2 projects are big enough, and in each case we control the entire salar. The advanced-stage, well regarded Maricunga project in Chile is approx. 4,000 hectares– so comparable from that perspective to both Yergo and Project II.
Why should readers consider buying shares of Portofino Resources?
Lithium stocks are out of favor, but select stocks have moved off their lows. We have just 24 M shares outstanding and a modest market value of ~C$2M. Our 3 projects are located in close proximity to advanced-stage & producing lithium companies. Near-surface sampling at Hombre Muerto West returned some very positive results. Depending on the weather, we hope to start drilling in coming months. We have 2 exploration programs underway, the other being Yergo, so readers can expect news on both projects. We believe there’s significant upside potential in the share price.
April 12, 2019
Peter Epstein
Disclosures: The content of this interview is for information only. Readers fully understand and agree that nothing contained herein, written by Peter Epstein of Epstein Research [ER], (together, [ER]) about Portofino Resources, including but not limited to, commentary, opinions, views, assumptions, reported facts, calculations, etc. is not to be considered implicit or explicit investment advice. Nothing contained herein is a recommendation or solicitation to buy or sell any security. [ER] is not responsible under any circumstances for investment actions taken by the reader. [ER] has never been, and is not currently, a registered or licensed financial advisor or broker/dealer, investment advisor, stockbroker, trader, money manager, compliance or legal officer, and does not perform market making activities. [ER] is not directly employed by any company, group, organization, party or person. The shares of Portofino Resources are highly speculative, not suitable for all investors. Readers understand and agree that investments in small cap stocks can result in a 100% loss of invested funds. It is assumed and agreed upon by readers that they will consult with their own licensed or registered financial advisors before making any investment decisions.
At the time this article was posted, Peter Epstein owned shares of Portofino Resources and Portofino was an advertiser on [ER]. Readers understand and agree that they must conduct their own due diligence above and beyond reading this article. While the author believes he’s diligent in screening out companies that, for any reasons whatsoever, are unattractive investment opportunities, he cannot guarantee that his efforts will (or have been) successful. [ER] is not responsible for any perceived, or actual, errors including, but not limited to, commentary, opinions, views, assumptions, reported facts & financial calculations, or for the completeness of this article or future content. [ER] is not expected or required to subsequently follow or cover events & news, or write about any particular company or topic. [ER] is not an expert in any company, industry sector or investment topic.
Lithium stocks were hot a year ago, now they’re not. Brine projects in Argentina commanded rapt attention, now no one cares. Clay-hosted Lithium projects were non-starters 2-3 years ago, now they’re in the “maybe” column. Clay-hosted Lithium projects are “unconventional,” meaning untested, and therefore difficult or impossible to fund. However, “unconventional” need not mean difficult to move forward or impossible to fund. What if I told you about a company with a project that had relatively low-grade Lithium, is pre-PEA, and is located in southern Arkansas? Sounds attractive, right? No, it sounds highly….. “unconventional.” Last I checked, Arkansas was not in the heart of the Lithium Triangle.
Sometimes unconventional is not all bad. Standard Lithium (TSX-V: SLL) / (OTCQX: STLHF) is a company like no other, and that’s a good thing. Although pre-PEA (PEA now underway), Standard’s 150,000 acre Arkansas Lithium project, called the LANXESS project, has been de-risked in a surprising number of important ways. For instance, while other mining juniors talk about being near, “past producing mines,” the LANXESS project is currently in operation, at massive commercial scale — but producing Bromine from brine, not Lithium (yet). It is a past-producer, but also a present & future producer!
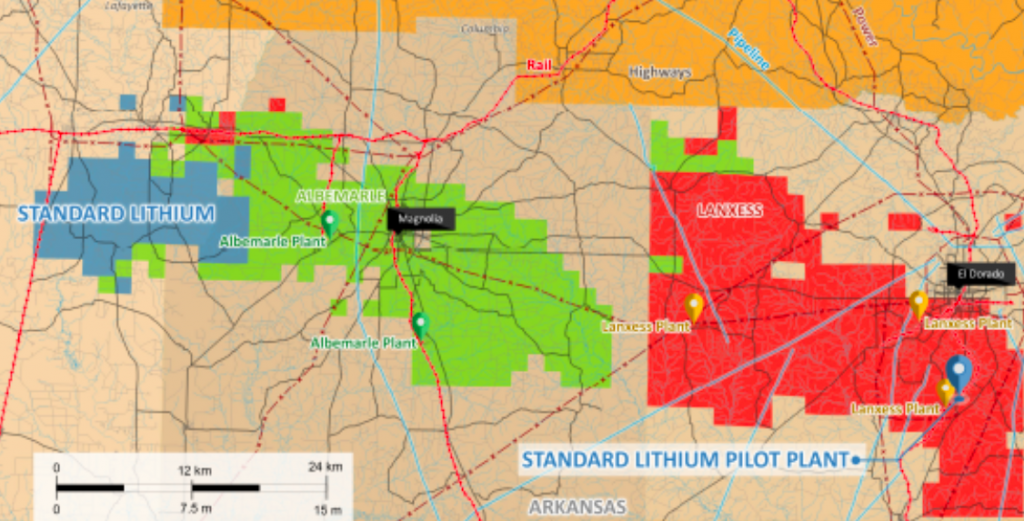
The LANXESS project is hardly early-stage. All of the project’s infrastructure is in place and currently in use. Power, rail, gas, water, tanks, chemicals, pumps, tankers, trucks, drilling equipment, wells, roads, pipelines, etc. 24/7/365, dozens of wells are pumping billions of gallons of brine (salty water), annually, containing Bromine, Lithium and other elements, through 3 nearby processing facilities. The LANXESS project happens to be smack in the middle of North America’s largest brine production & processing facilities. These facilities have been in operation for decades.
Think about the risks avoided here. The Project is in the U.S., thousands of experienced workers are in place working, there’s no discovery or resource expansion risk (the resource is already large enough), the Project is by and large already permitted, it’s in environmental compliance. There’s local community support (no Aboriginal or First Nations issues).
Year-round operations, port access in the Gulf of Mexico, workers go home each night (no fly-in / fly-out). Best of all, the Project is in commercial-scale operation right now, albeit for Bromine. These are logistical items that Lithium companies in Argentina & Chile, not to mention Australia & Canada, would die for, milestones that can take years and hundreds of millions of dollars to obtain.
Not only are operations in place at a large commercial scale, but pumping history, hydrology & geology is all readily available to Standard Lithium for review. This and other data enabled the Company to estimate a 3.1 M metric tonne Lithium Carbonate Equiv. (“LCE“) Inferred resource at the LANXESS project. So, we can be reasonably certain that there’s considerable resource size. However, to be safe we await the Inferred resource being converted to Measured & Indicated, which is expected later this year.
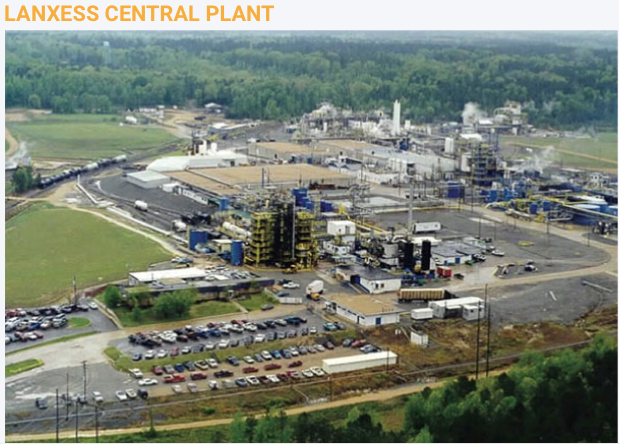
One might think that pulling Lithium out along with the Bromine would be straightforward, it’s not, it proved to be quite a technical challenge. However, a challenge on the verge of being solved, as Standard Lithium is operating a mini pilot plant that has already produced battery-grade Lithium Carbonate. However, this process needs to be scaled up very significantly.
I’ve mentioned several ways in which the Company’s Project is de-risked, taking that theme to a whole new level is a prospective JV with LANXESS (hence the project name). Standard Lithium signed a MOU with LANXESS in May 2018 and a JV term sheet in November. LANXESS is a giant German chemical conglomerate that would provide substantial help on the technical, operational, sales / marketing and R&D fronts.
Assuming reasonable project economics, LANXESS has committed to finance 100% of the commercialization of the Project. LANXESS’, (through its wholly-owned subsidiary) Great Lake Chemicals, operations in Southern Arkansas encompass more than 150,000 acres, 10,000 brine leases & surface agreements and 250 miles of pipelines. LANXESS extracts brine from wells located throughout the area and transports it to 3 Arkansas processing plants through a network of pipelines.
Executing the JV would be huge, LANXESS would own a majority of the Project, but funding is without question the largest risk factor these days. LANXESS funding would be the biggest de-risking event of them all. Several world-class brine projects in Argentina are all but stalled due to a lack of project funding. That’s even though those projects are “conventional” proposing to use conventional solar evaporation ponds. And then there’s Quebec’s Nemaska Lithium, they were billed as fully-funded, until they found a ~C$400M hole in their funding basket. Nothing against Nemaska, Lithium projects are complex and unique. Delays and cost over-runs are the norm.
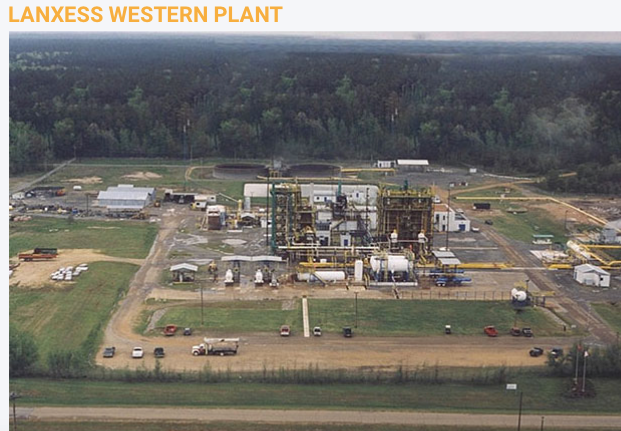
Standard Lithium’s processing technology, if operating at commercial scale, would process enormous volumes of brine in days vs. over a year for solar evaporation ponds. The technology is designed to be easily and conveniently scalable, it’s modular. If need be, the Company could plan production based on market conditions. Management is not going to run into a ~C$400M cap-ex problem, the amount of operating data available is immense and remember, most of the infrastructure is already in place.
So, what does all of this mean for Standard Lithium? Assuming LANXESS comes on board (LANXESS named Standard Lithium and the Arkansas lithium project during the opening minutes of their 4th Quarter earnings call), they have many risk factors covered, including the biggest risk, project funding. Instead of facing the daunting task of having to raise hundreds of millions in equity capital to fund a commercial development, the Company is probably looking at raising closer to C$25M over the next 18 months. They just closed an C$11M bought deal financing.
Risk Factors
The main risk factor is scaling their proprietary technology from pilot to commercial-scale. With regard to this risk, I think it’s a question of when, not if, the Company achieves this milestone. A moderate delay would be disappointing but would not deliver a fatal blow. Standard Lithium hopes to eventually reach a run-rate of ~20,000 tonnes/yr. LCE. That will likely take several years, after first achieving limited commercial production potentially as early as 2021. Ultimately, production of 30,000+ tonnes/yr. LCE for decades is a possibility, by optimizing the well fields and tapping into the Company’s nearby TETRA Project area.
What might the mid-year PEA show? We don’t know yet, but we can make some educated guesses. Cap-ex? In Argentina, the average Lithium brine project cap-ex requirement from among 6 well known projects is C$540 M. The LANXESS project will be built in stages, so the cap-ex will be substantially lower. Remember, most of the infrastructure is already in place and in operation.
Op-ex should be on the low side as well. For example, the Company has ready access to some of the cheapest chemical reagents in the world. And, the Lithium operations will be sharing some costs with the Bromine operations. Brine exits the Bromine operations at 70 degrees Celsius, so no extra energy needs to be added as it enters the Lithium facilities. Management’s goal is to be in the bottom quartile on the cost curve.
Look at “conventional” brine producer Orocobre Ltd., it’s in year 4 of commercial operation, but is still running at ~70%-80% of nameplate capacity. This is no knock on Orocobre, they were the first new brine project in Argentina in 20 years, it just demonstrates how very difficult each unique brine (chemistry) project is. And the weather, it has been surprisingly rainy this year and last, which is bad news for solar evaporation ponds. Global warming?
In the early-to-mid 2020s there will be fierce competition for scarce resources in Argentina (labor, executives with brine project building experience, consultants, water, power, mining services & equipment, environmental work & construction activities (at 4,000 meter elevations), access to governmental agencies for permits & approvals). Among the 6-10 brine projects in Argentina at PEA-stage or more advanced, several might never reach production. Several others could be delayed by 1,2,3,4 years in reaching nameplate capacities of 20k-35k tonnes/yr. LCE.
Conclusion
Standard Lithium (TSX-V: SLL) / (OTCQX: STLHF) will not be fighting for scarce resources, (another risk avoided) there should be no operating or infrastructure bottlenecks, the weather is not a factor. There won’t be cost blowouts. If a Bank Feasibility Study calls for first production in mid-2021, and LANXESS is committed to project finance, operations & off-take, it will likely happen pretty much on time and on budget.
For hard rock producers in western Australia my understanding is that the situation is a lot better, but we could still see bottlenecks as many hard rock producers try to ramp up supply at the same time. Instead of companies failing, perhaps we will see a wave of M&A in western Australia.
That higher degree of certainty is worth a lot in the wild west of Lithium project development. And, if the brine projects in the Lithium Triangle can’t deliver close to nameplate capacity in the early-to-mid-2020’s, there’s going to be tremendous demand for Standard Lithium’s output, and Lithium prices will likely be high. Who knows, maybe even the “unconventional” clay-hosted Lithium producers will have their day in the sun?
March 29, 2019
Peter Epstein
Disclosures: The content of this article is for information only. Readers fully understand and agree that nothing contained herein, written by Peter Epstein of Epstein Research [ER], (together, [ER]) about Standard Lithium, including but not limited to, commentary, opinions, views, assumptions, reported facts, calculations, etc. is not to be considered implicit or explicit investment advice. Nothing contained herein is a recommendation or solicitation to buy or sell any security. [ER] is not responsible under any circumstances for investment actions taken by the reader. [ER] has never been, and is not currently, a registered or licensed financial advisor or broker/dealer, investment advisor, stockbroker, trader, money manager, compliance or legal officer, and does not perform market making activities. [ER] is not directly employed by any company, group, organization, party or person. The shares of Standard Lithium are highly speculative, not suitable for all investors. Readers understand and agree that investments in small cap stocks can result in a 100% loss of invested funds. It is assumed and agreed upon by readers that they will consult with their own licensed or registered financial advisors before making any investment decisions.
At the time this article was posted, Peter Epstein owned shares of Standard Lithium and the Company was an advertiser on [ER]. Readers understand and agree that they must conduct their own due diligence above and beyond reading this article. While the author believes he’s diligent in screening out companies that, for any reasons whatsoever, are unattractive investment opportunities, he cannot guarantee that his efforts will (or have been) successful. [ER] is not responsible for any perceived, or actual, errors including, but not limited to, commentary, opinions, views, assumptions, reported facts & financial calculations, or for the completeness of this article or future content. [ER] is not expected or required to subsequently follow or cover events & news, or write about any particular company or topic. [ER] is not an expert in any company, industry sector or investment topic.
Defense Metals (TSV-V: DEFN) / (OTCQB: DFMTF) is a great name. The Company is defending against Chinese dominance of Rare Earth Elements (“REEs“), and Defense Departments require select REEs to defend their countries! Several REEs are very difficult or impossible to replace in critical applications, yet enable products essential to modern civilization. Any company outside of China that can reliably produce a few key REEs will have a license to print money. This week, SGS Canada provided select head assay results from a 30-tonne bulk sample. Four REE assays were reported in this press release {see chart below}. Using the price/kg of each metal, the in-situ value is ~US$ 535/t. That’s equivalent to ~ 0.41 troy ounces Gold or ~12.8 g/t Gold.
In the following interview of CEO Max Sali, readers will learn more about REEs and about Light Rare Earth Elements (“LREEs“), which REEs are in highest demand, and for which applications. Spoiler alert, Neodymium & Praseodymium are in the top 4 or 5. I asked Max why his team believes that its deposit of LREEs might be economically viable given the odds stacked against any deposit becoming a mine. To finish off, we discussed some early-stage uranium assets the Company picked up in the famous Athabasca basin. {Corporate Presentation}
Please give readers the latest snapshot of Defense Metals.
Sure. Defense Metals (TSV-V: DEFN) / (OTCQB: DFMTF) is focused on sourcing, exploring and developing rare earth & uranium properties in Canada. Our flagship project is the Wicheeda rare earth deposit. NOTE: {here’s a good, brand new article by Rick Mills on Defense Metals}
The Wicheeda deposit (6 mineral claims, 1,780 hectares) is 80 km northwest of Prince George, in British Columbia, (“BC“) Canada, and contains potentially exploitable concentrations of Rare Earth Elements. The deposit was explored in the 1970’s & 1980’s, but received little further attention until 2008 when it was drilled by Spectrum Mining Corp. They reported an Inferred resource of 11.3 million tonnes. More recently, SGS Canada provided us with an important update on the deposit. Four REE assays from a 30 tonne bulk sample we sent them earlier this year showed significant concentrations of both Neodymium & Praseodymium.
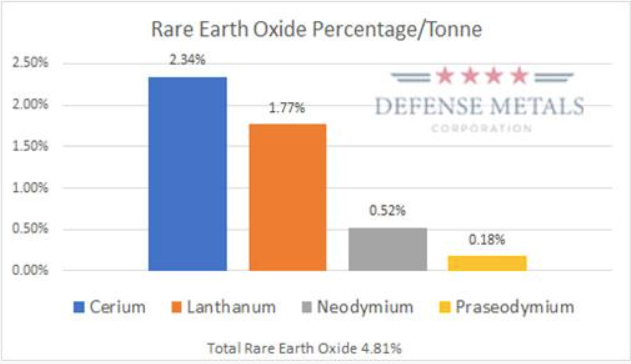
The Wicheeda deposit is a very exciting project because we can potentially get it into production fairly quickly, especially given nearby infrastructure (roads, rail, water, power, labor, mining equipment & services). A favorable mineralogy & Light Rare Earth Element (“LREE“) distribution make the Wicheeda deposit highly attractive. Some impurities can be removed through electromagnetic separation done on site. The press release we put out this week was important because it gave us a new understanding of the deposit, {see graph below}. Total Rare Earth Oxide (“TREO“) was 4.81%, which we feel is attractive.
Wicheeda is ideally suited for open pit mining and conventional flotation to produce a REE-enriched oxide concentrate. In addition to Lanthanum, Cerium & Neodymium, we also have Praseodymium. Importantly, the deposit is open in most directions and outcrops at surface, meaning a low strip ratio and the potential for expansion. Encouraging bench-scale tests have been done, giving our team the goal of a 60%+ concentrate.
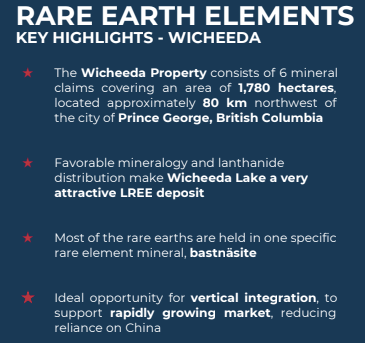
Although the main focus is our rare earth deposit, we also have 2 prospective uranium properties (5 claims blocks), in the heart of the eastern Athabasca basin near Denison Mines and IsoEnergy. Both of those companies are spending millions on drilling this year. IsoEnergy has made a new high-grade discovery 5-10 km from one of our properties.
Which rare earths are in the deposit? Which rare earths in your deposit are most valuable?
The following REEs can be found, Lanthanium, Cerium, Praseodymium, Neodymium, Samarium, Europium, Gadolinium, Yttrium & Dysprosium. There are also trace amounts of a few others. Neodymium & Praseodymium are the most valuable in the suite.
How have the prices of your most important rare earth metals trended over the past few years?
Neodymium and Praseodymium are the most important rare earth metals we have identified at the Wicheeda deposit. Neodymium (Nd) & Praseodymium (Pr) are the two rare earth elements which form the majority of rare earth permanent magnets. Below are 5-yr price charts from Kitco. The most recent prices of US$62.0 per kg for Neodymium Oxide and US$78.4 per kg for Praseodymium Oxide are down from recent highs, but up 35%-40% from mid-2016 lows.
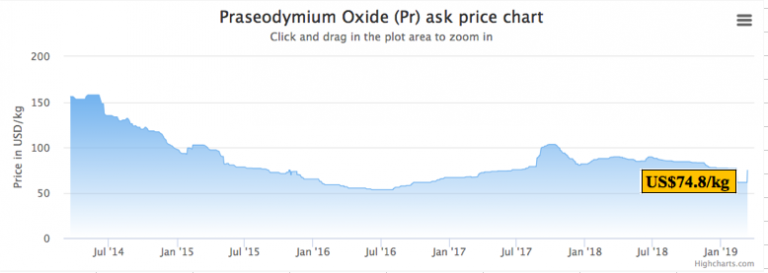
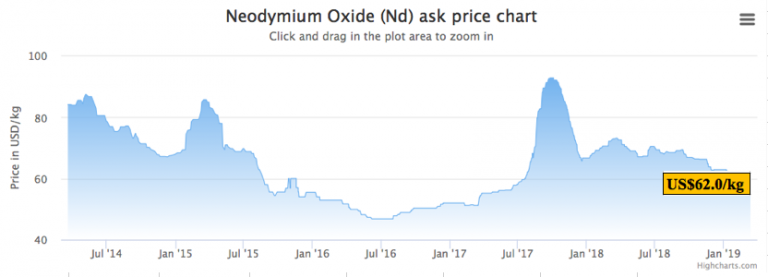
Does management have any indicative information on metallurgy, the potential recoveries of individual metals?
Bench-scale flotation and hydrometallurgical test work was done on Wicheeda deposit drill cores at a SGS Lakefield lab during 2010/2011. SGS successfully developed a flotation flow sheet that recovered 83% of the rare earth oxide (REO) and produced a concentrate grading 42% REO. Subsequent hydrometallurgical testing in 2012 on a 2-kg sample of the concentrate grading 39.7% TREO (total REO) produced an upgraded and purified precipitate containing 71% TREO through a process of pre-leaching and roasting.
SGS Canada is well into the planned work program which includes chemical & mineralogical characterization, grindability & laboratory flotation testing on a 200-kg subsample (of the 30 tonne surface bulk sample). The objectives are to validate the process and confirm that conditions of the previously established 2010/2011 bench-scale drill core flotation test work can be upscaled to the current bulk sample; in addition to further optimization of the process flowsheet.
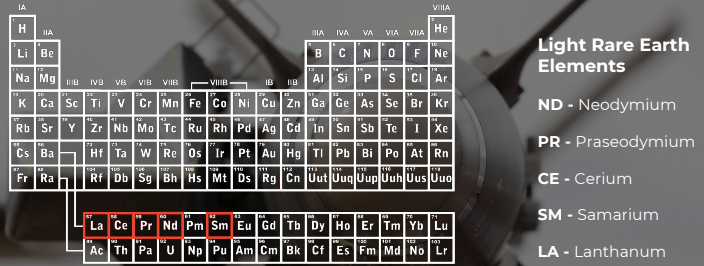
What will management learn from SGS Canada’s work?
As mentioned, Defense Metals delivered a 30 tonne surface bulk sample from the Wicheeda deposit to SGS Canada. SGS is conducting a multi-phase program of bench-scale metallurgical test work preparatory to commissioning larger scale flotation pilot plant testing. Larger scale pilot plant production is expected to validate bench-scale metallurgy and produce LREE product samples for potential off-take partners. The ultimate goal of the test work is to finalize the process flowsheet prior to the commissioning of larger-scale pilot plant testing. SGS has agreed to give us regular updates on its progress. In addition, Defense Metals plans to re-assay the ‘pulps’ used to produce a new 43-101 Inferred resource estimate. A Preliminary Economic Assessment (“PEA“) will follow.
Defense Metals also has uranium assets in the eastern Athabasca basin, please describe those properties.
Yes, these properties are early stage, and total nearly 10,000 hectares. We have people reviewing the historical work done on the properties, which actually comprise 5 claim blocks. We will likely do some airborne electromagnetic survey work, but to be honest, the eastern Athabasca basin is a hotbed of activity, so we may just allow our neighbors to drill around us and see what they find. Our holding costs on the properties are extremely low.
We are very pleased to have Dale Wallster join our technical advisory board. Dale is a geologist & prospector with 35 years’ experience in North American mineral deposit exploration, with a focus on the targeting & discovery of unconformity-related uranium deposits. He was President & Founder of Roughrider Uranium Corp., a company acquired by Hathor Exploration in 2006 for its strategically located uranium properties in the Athabasca Basin. Dale and his team are widely credited for the discovery of Hathor’s Roughrider deposit. In January 2012, Hathor became a wholly-owned subsidiary of Rio Tinto as part of a C$650 million acquisition.
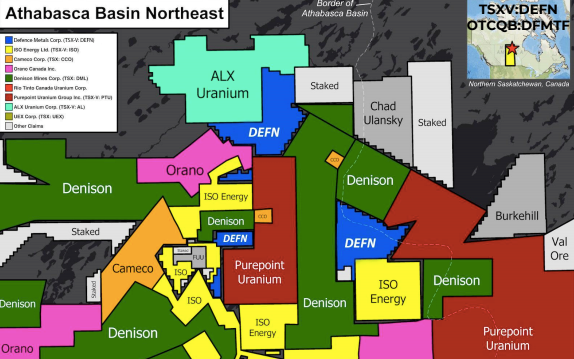
Why should readers consider buying shares of Defense Metals?
Defense Metals (TSV-V: DEFN) / (OTCQB: DFMTF) offers an attractive, early-stage way to play the REE market. Our LREE deposit appears to be sizable and is open in multiple directions. It contains potentially economic amounts of select rare earth metals. At least 2 of the REEs, Neodymium (Nd) & Praseodymium (Pr) are quite valuable and in high demand for use in permanent magnets. There are indications that the metallurgy of the Wicheeda deposit is favorable and considerable testing is being done on metallurgy.
If the Company receives additional positive reports from SGS Canada, that could be a catalyst for our share price, as it would provide support for the thesis that we can put the project into initial production fairly quickly. While still early-stage, the Wicheeda deposit has had ample historical work done on it dating back decades, and is undergoing significant, wide-ranging testing right now. If we can advance this project in 2019 the way that we think we can, our current market cap of C$5.1 M = US$3.8 M (23.75 M shares outstanding) could prove to be an attractive entry point.
Thank you Max, that was very interesting, congratulations on the new assay results.
Disclosures: The content of this interview is for information only. Readers fully understand and agree that nothing contained herein, written by Peter Epstein of Epstein Research [ER], (together, [ER]) about Defense Metals, including but not limited to, commentary, opinions, views, assumptions, reported facts, calculations, etc. is not to be considered implicit or explicit investment advice. Nothing contained herein is a recommendation or solicitation to buy or sell any security. [ER] is not responsible under any circumstances for investment actions taken by the reader. [ER] has never been, and is not currently, a registered or licensed financial advisor or broker/dealer, investment advisor, stockbroker, trader, money manager, compliance or legal officer, and does not perform market making activities. [ER] is not directly employed by any company, group, organization, party or person. The shares of Defense Metals are highly speculative, not suitable for all investors. Readers understand and agree that investments in small cap stocks can result in a 100% loss of invested funds. It is assumed and agreed upon by readers that they will consult with their own licensed or registered financial advisors before making any investment decisions.
At the time this interview was posted, Peter Epstein owned shares in Defense Metals and it was an advertiser on [ER]. Readers understand and agree that they must conduct their own due diligence above and beyond reading this article. While the author believes he’s diligent in screening out companies that, for any reasons whatsoever, are unattractive investment opportunities, he cannot guarantee that his efforts will (or have been) successful. [ER] is not responsible for any perceived, or actual, errors including, but not limited to, commentary, opinions, views, assumptions, reported facts & financial calculations, or for the completeness of this article or future content. [ER] is not expected or required to subsequently follow or cover events & news, or write about any particular company or topic. [ER] is not an expert in any company, industry sector or investment topic. [ER] may buy or sell shares in Defense Metals and other advertising companies at any time.
A lack of exploration and discovery near Hemlo has created an opportunity for one Canadian company with a deep connection to the region to make the next discovery and the regional connection between two possible gold systems.
by Nicholas LePan
The winters in Northern Ontario pause most exploration programs, however for one company, the deep chill provides an opportunity to follow up on an impressive drill hole in the shadow of Hemlo’s headframe, one of Canada’s largest gold discoveries.
Over the winter, Canadian Orebodies Inc. (TSX-V: CORE) has been building ice pads on a lake in preparation for a 1000-metre-plus drilling program. The drill program seeks to explore the extension of recently drilled high-grade gold-bearing veins on the Black Raven property. The ice pads allow the drill to target the right angle to follow up on results received from the fall 2018 drilling program.
On Dec. 11, 2018, the company announced that drilling had intercepted 133.2 g/t Au over 2.0 metres, which included 443.0 g/t Au over 0.6 metres (see press release), in a vein which the company has dubbed the Super G vein in the Smoke Lake Gold System. These results were the confirmation the company needed; the Super G vein is part of a much larger mineralized system, which comprises multiple mineralized stacked layers with potential for high-grade gold in every structure.
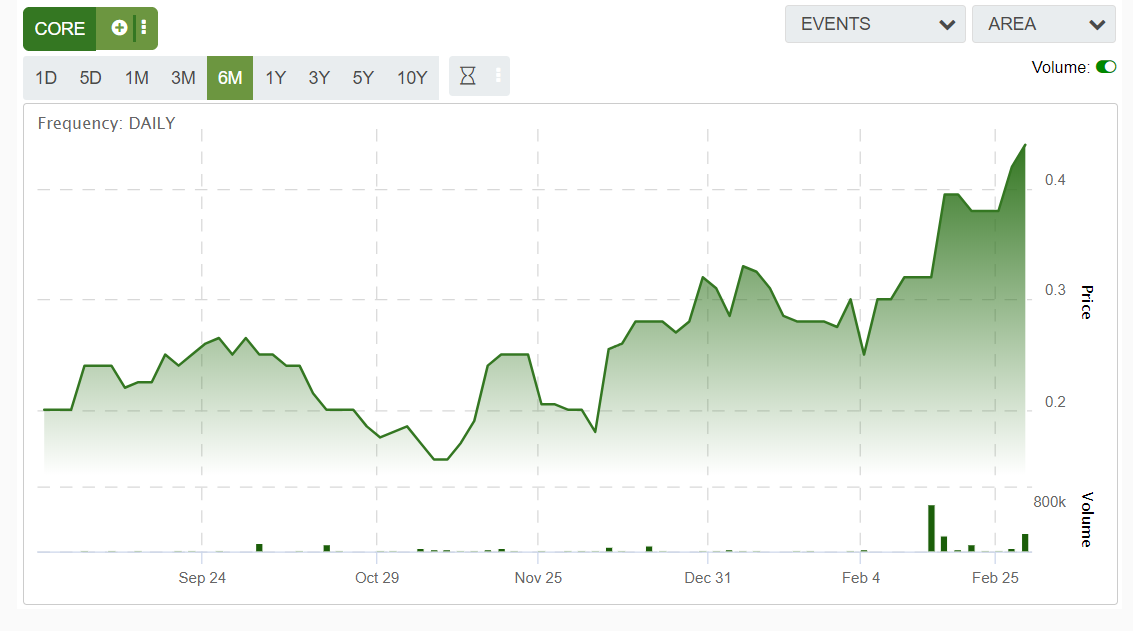
This hole was the highest grade reported on the property and it sparked interest from the market. Since that time, anticipation of further drilling has driven up share prices from 18 cents before the results to currently 34 cents per share.
Gordon McKinnon, President of Canadian Orebodies, stated:
“Our intersection from hole BR-2018-002 produced one of the highest-grade gold intercepts in the Hemlo Greenstone Belt outside of the Hemlo Mines complex, which was discovered in 1981. Looking into 2019, the combination of this season’s results, with the historic drilling results, will greatly improve our exploration model to expand the high-grade gold zones known in the system and to discover new ones.”
The significance of this new drill program is not be understated. There has been very little discovery since Hemlo, largely in part due to a lack of systematic exploration. Typically, the presence of one large orebody indicates the region has the geological potential to host further deposits, it is just a matter of getting the trend right and doing the drilling.
The main target of the 2019 drilling program is the Super G Structure of the Smoke Lake Gold System. Part of the program will target the up-dip and lateral extensions of the high-grade zone intersected in BR-2018-002.
The emerging picture suggests that the stacking of high and low grade gold zones is forming the Smoke Lake Gold System. The company is comparing its results to the width and grade of results from Amex Exploration’s (TSX-V: AMX) Eastern Gold Zone on its Perron Project.
Potential upside from the ongoing drill program could come from the extension of the discovered high-grade zone in the Super G Structure and extensions in its mineralization footprint. This could lead to the discovery of new high-grade zones in the other structures forming the Smoke Lake Gold System.
This work is going toward a larger regional picture of the potential for gold mineralization on the company’s land package. In 2017, drilling at the company’s Wire Lake project suggested that higher grade gold mineralization surrounded by a halo of lower grade mineralization can be hosted in the Wire Lake Gold System, with a headline result of 7.56 g/t gold over 4.9 metres in WL-2017-001 including 57.3 g/t gold over 0.5 metres (see release).
New geochemical data suggests that the Wire Lake Gold system is possibly related to the Smoke Lake Gold System, based on similarities between the alteration and mineralization in the two systems. If confirmed this would add an additional 5 kilometers to the Wire Lake Gold System which is already confirmed over a strike length of 3 kilometres, creating an even larger target in a underexplored greenstone belt.
This is just the beginning for the Canadian Orebodies team led by Gordon McKinnon. Calling on his family tradition, McKinnon has built a team that knows the region well and is looking to prove the continuity of his father’s success, who played a key role in the discovery of Hemlo.
On the board is John Harvey, who served as President and CEO of Hemlo Gold Mines Inc. from 1989 to 1991. Serving as an advisor to the company is Robert Middleton, who led the Rosario Resources team that discovered the Bell Creek Mine in Timmins, Ontario and, in 1982, he played a role in drilling the discovery hole at the Goliath Mine in Hemlo, Ontario.
Alongside this proven team is a series of successful shareholders such as Robert Cudney of Northfield Capital, who sold Gold Eagle Mines to Goldcorp for $1.5 billion, Sean Roosen’s Osisko Mining, Rob McEwen and Rick Rule. With these shareholders, the company has access to capital despite the company already being in a well-funded position with $2.2 million and ~58 million shares fully diluted.
The company is expecting the program to wrap in late March with assays shortly after that. These results could prove that there are more Hemlos in Ontario.
About Canadian Orebodies Inc.
Canadian Orebodies is a Canadian-based mineral exploration company with a portfolio of properties in Ontario and Nunavut. Canadian Orebodies is focused on generating shareholder value through the advancement of its two Hemlo area projects: Wire Lake and the North Limb.
By Nicholas LePan
March 14, 2019
The author of this article was compensated in cash and does not hold any securities in Canadian Orebodies.
The battle for Cornerstone Capital Resources Inc. (TSXV-CGP, OTC-CTNXF) is heating up following a preliminary takeover bid from joint venture partner SolGold. However, Cornerstone is likely to reject the overture, based on its latest press release on the matter and on comments by Glen McKay, a co-founder and former president and CEO of the junior mining exploration company.
Cornerstone has a joint venture agreement with SolGold on the Cascabel project in Ecuador, which is believed to be one of the world’s largest gold-copper deposits. SolGold is the operator of the Cascabel project and owns a majority stake. Larger gold players are also involved, with both BHP Billiton and Newcrest Mining holding minority positions in SolGold.
In a February 8 press release, Cornerstone noted that SolGold had issued a press release of its own on January 31, announcing its intention to commence an offer to acquire all of the issued and outstanding common shares of Cornerstone in an all-stock transaction, providing 0.55 of a SolGold share for every one Cornerstone share tendered.
“As previously announced by Cornerstone, shareholders of the company that collectively own over 50% of the company’s outstanding shares have notified Cornerstone that they will not support the terms announced by SolGold,” the Cornerstone release stated. “As a result, if SolGold proceeds to make a formal offer on these terms, the company believes that SolGold’s offer would be incapable of being successfully completed.”
The Board of Directors of Cornerstone said it had assessed the SolGold proposal with its financial advisor and believes that the proposal significantly undervalues Cornerstone. The Cascabel Project is owned by SolGold’s 85% owned Ecuador subsidiary Exploraciones Novomining S.A. (ENSA). The remaining 15% of ENSA is currently held by Cornerstone. In addition, Cornerstone owns approximately 9.2% of the outstanding shares of SolGold. In effect, Cornerstone has a combined direct and indirect 23% interest in the Cascabel concession.
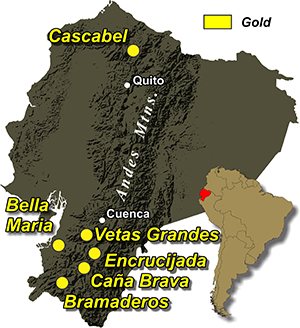
Cornerstone said it was disappointed by SolGold’s latest press release, stating that it contains “numerous inaccurate and misleading statements and baseless innuendo.” Still, Cornerstone said it remains open to constructively discussing with SolGold and other potential bidders any value enhancing transaction that would garner the support of Cornerstone’s shareholders.
In an interview, Cornerstone co-founder and former chief executive Glen McKay called the SolGold preliminary offer a poor bid, or an offer so far below the current value that under most circumstances it will be rejected. McKay is a major shareholder and a special advisor to Cornerstone. “I know that we can identify 60% of shareholders who have been surveyed and unanimously we are going to reject the offer, if SolGold comes with it,” McKay said. “They may still come with an offer, but it will be a waste of their money to do so and will be really embarrassing for SolGold.” An additional factor is that SolGold is mostly an illiquid stock so that even if Cornerstone accepted the deal there would be little chance of current CGP shareholders being able to monetize their new shares of SolGold in the short term.
The price SolGold is offering is not based on the fair value of the Cascabel project, McKay said. In addition, he says there are a number of issues with the joint venture agreement between SolGold and Cornerstone that have not been fulfilled.
This may not be an issue in the future, if BHP Billiton or Newcrest or some other suitor comes in with an offer for both companies and consolidates them. But for now, McKay says SolGold is not in a position of strength and the deal as it stands is “not going to happen.”
Stressing that he can’t predict the future, McKay nonetheless believes that another bid for Cornerstone will take place, perhaps as soon as this year. Although BHP Billiton has signed a deal which rules out a takeover bid until November, Newcrest Mining is under no such restriction.
Newcrest has signed two major joint venture agreements with Cornerstone in the last couple of months, McKay notes, including an agreement on the Cana Brava project in Ecuador and the Miocene property in Chile.
McKay sees the two deals as an indication that Newcrest is positioning itself for a bid so that they are in a good place in terms of their relationship with Cornerstone. “If I had to make a bet, I would say that Newcrest is the front runner and it may be that they will do it as a partnership,” he says. “I think something will happen before the end of 2019. We’re hoping that another interested player comes in and starts a bidding war.”
With consolidation on the rise in the metals sector, a SolGold-Cornerstone merger perhaps makes sense, although SolGold may have to sweeten its offer to cement the deal. But Cornerstone’s initial negative response suggests even that won’t be enough. For now, interested observers will have to be content to wait for another missive from SolGold to see if the offer changes or is simply shelved.
Whatever the outcome, McKay believes that Cornerstone will spin off its other assets before a sale of its interest in Cascabel due to the potential of other properties that are under other JVs such as the Bramaderos project in Ecuador. Malcolm Norris, the CEO of Cornerstone partner (Sunstone) on the project was the CEO of SolGold in 2012 when Cornerstone completed a JV deal on Cascabel. Norris and Cornerstone VP Exploration Yvan Crepeau are due the credit for the discovery of Cascabel, McKay says. They are hoping to replicate that success on Bramaderos.
First Vanadium (TSX-V: FVAN) is one of the better known vanadium companies. Its CEO, Paul Cowley, can be seen in a number of video clips that I linked to at the bottom of the page. Despite being a blue chip name, First Vanadium’s market cap is just US$19.5 M. This, for a company that claims to have the highest-grade primary vanadium project in North America, and a plan to fast-track its flagship project in Nevada. To top it all off, management just released a summary of their Maiden mineral resource estimate.
The Maiden mineral resource estimate came in at 303 M Indicated pounds @ 0.615% & 75 M Inferred pounds @ 0.52%. That represents a moderate increase in size & grade from the historical resource estimate of 289 M Inferred pounds @ 0.515%. Importantly, 80% of the new resource (in pounds) is in the Indicated category. At the current vanadium pentoxide price of US$17.60/lb., the in-situ value of First Vanadium’s 303 M Indicated pounds alone = US$ 5.33 billion. That’s about 275x its market cap. Note: {in-situ values can be misleading for early-stage projects, but they can be compared to peers at similar stage}.
Is vanadium for real? Will Vanadium Redox Flow Batteries cause demand & prices of vanadium pentoxide (“V2O5“) to soar? Will global infrastructure projects demand greatly increased amounts of vanadium-strengthened steel rebar? Please continue reading for answers to these and many other important questions. Note: Peter Epstein and Epstein Research have no prior or existing relationship with CEO Paul Cowley or First Vanadium Corp.
Please give readers the latest snapshot of First Vanadium.
First Vanadium Corp. is focused on vanadium and its advanced-stage Carlin Vanadium project in Nevada, the largest and highest grade primary vanadium deposit in North America. The Company is run by professional geologists & engineers who have worked for Major mining companies in senior positions in exploration, deposit discovery, construction & mining operations.
The company has a tight share structure and is well-funded. We just released a Maiden mineral resource estimate that’s 80% in the Indicated category and that’s larger than our historical resource, which was 100% Inferred. We are very pleased with these results.
Why vanadium, why not lithium, cobalt, graphite, nickel or copper?
All of these minerals are going to be winners in the near future with the inevitable rapid demand increases for these metals with the commercialization of lithium-ion electric batteries in automobiles and vanadium redox flow batteries in large power storage applications. There is just not enough production of these minerals from existing mines to meet the projected demand of this exciting evolution in Battery Technology and commercialization.
In addition, in the case of vanadium, it is chiefly used as an alloy for strengthening steel in infrastructure; rebar, pipelines, airplanes and car frames. CIBC Mellon has estimated that there will be $35 trillion dollars of global infrastructure projects starting over the next 20 years, which will spark big demand for vanadium.
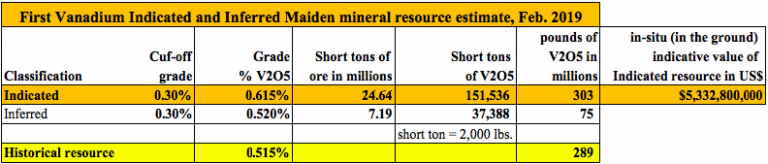
Tell us more about the Carlin Vanadium project.
The Carlin Vanadium project is a black shale-hosted sedimentary bed of high-grade vanadium which is shallow dipping and near-surface, making it ideal for open pit mining. The project’s superior location and infrastructure are added benefits, being located less than 6 miles by road to a major rail hub, a major highway, power and mining community.
Furthermore, the grades are higher, about double that of other Nevada based vanadium projects, and there’s significantly more vanadium metal in our deposit, also about double that of our peers. Our Maiden mineral resource estimate shows the large scale and high grade of the deposit.
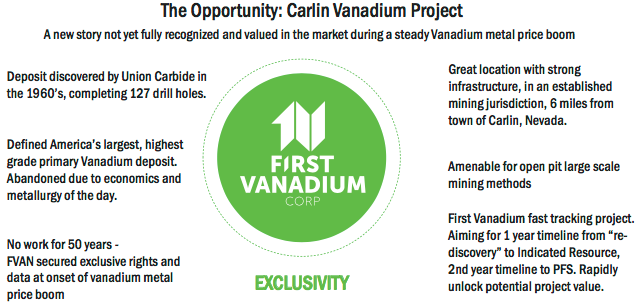
How significant has First Vanadium’s exploration drilling been compared to historical drilling? How many new holes were drilled?
The two drill campaigns that First Vanadium did in 2018 totaling 89 holes were extremely strategic and successful in both in-filling and expanding the deposit. We frequently received assay values with higher grades than those found in the older drill data. This is reflected in our Maiden mineral resource estimate that shows a 0.615% grade in the Indicated category alone. The infill drilling improved the confidence level to justify a high percentage of the resource being in the Indicated category.
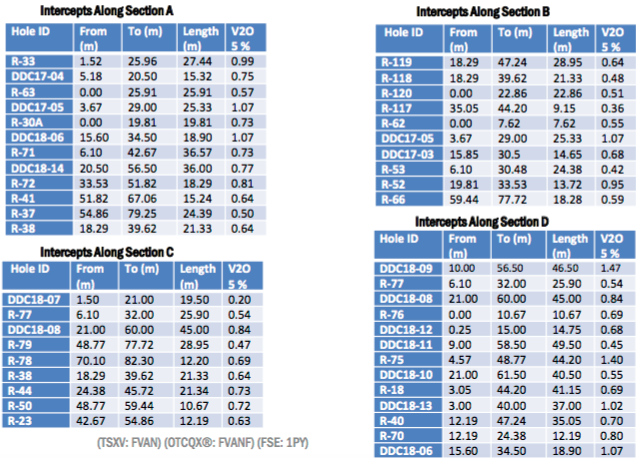
Please explain First Vanadium’s fast-track approach at the Carlin project.
In the 15 months we have had the project, we quickly received permits to drill, conducted two drill campaigns, made significant inroads in metallurgy, conducted environmental studies, and delivered a significant Maiden mineral resource estimate, with 80% of the vanadium in the Indicated category, all to advance the project and unlock value for shareholders. These steps are the normal steps taken by companies to advance and de-risk projects, but normally it would take 3-4 years to accomplish what we have done in 15 months.
Is there too much talk about VRBs, which only represent 1%-2% of vanadium use? Is the VRB opportunity possibly overrated?
The Vanadium Redox Flow Battery has only just started to be commercialized over the last two years and currently draws a small percentage of global vanadium consumption. It will ramp up in the short and intermediate time frame to become a much more significant part of vanadium consumption. For example, one project alone in China, the Dalian project, is expected to consume 7,000 tonnes of vanadium, ~8% of annual production, the equivalent of powering 100,000 homes. You can see that the scaling opportunity is eye-opening.
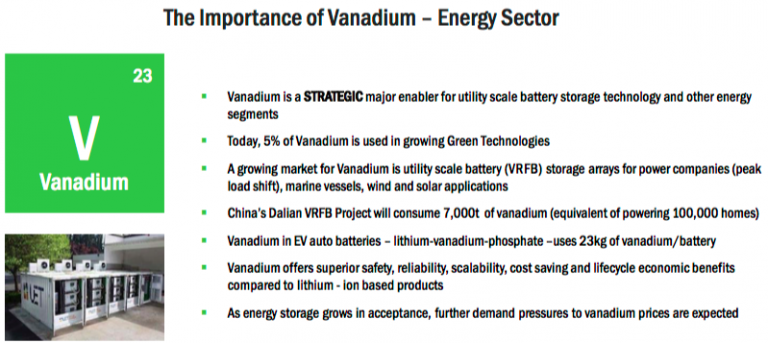
The VRB battery is a superior battery for storing large amounts of electricity and they are forecast to last 25 years, whereas the equivalent lithium-ion battery needs to be replaced every 3 to 5 years due to its depleting characteristics. The VRB battery is the ideal battery solution for the green energy space for large-capacity electricity storage in power grids and in wind & solar applications. Some have stated that if vanadium prices are too high, the VRB battery will not be completive, but continuing technical advancements are being made to bring costs down. Some vanadium producers are offering to lease the vanadium in the battery to reduce costs to the end user.
What do you make of the sharp decline in vanadium prices in Q4 2018?
Vanadium was the best performing metal in 2018, despite the pull-back at the end of the year. September & October 2018 saw a rapid increase in vanadium prices leading up to the implementation of the announced November 1st, 2018 Chinese law requiring 30% more vanadium in Chinese rebar. Rapid price increases are normally followed by pull-backs as a normal reactionary correction, but eventually that pull-back over-reaction needed to stabilize and reflect more prevailing supply & demand factors.
Naturally, the reason for the run-up in price is real and is expected to add more demand to the stage. The strong demand for the metal, and the tight supply, are still the norm– forcing prices up. From mid-January to late-February, the Chinese price of vanadium pentoxide is up 12.8% from US$15.60 to US$17.60/lb. (see chart below from vanadiumprice.com). We expect 2019 will be another strong year for vanadium prices.
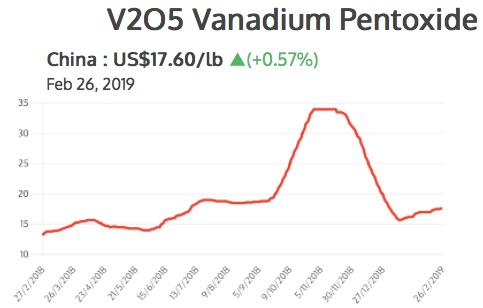
What’s the biggest risk to the Carlin project in the next 12 months?
Perceptions. In the valuations of vanadium projects and their in-situ assets, and in vanadium price performance and trajectory through 2019 to provide the investor with confidence and interest in the future of this metal.
Thank you Paul, that was very helpful, I think that readers should have a much better understanding of First Vanadium after reading this interview. Congratulations on your Maiden mineral resource estimate, and continued good luck on fast-tracking the Carlin Vanadium project.
Peter Epstein
March 1, 2019
Video clips of CEO Paul Cowley and/or First Vanadium Corp.
https://www.youtube.com/watch?v=SEsx6wPCQiM&t=9s
https://www.youtube.com/watch?v=THrnsK_ODwU&t=97s
https://www.youtube.com/watch?v=mdx-TFega1Q
Feb 26, 2019
Here are today’s videos and charts (double-click to enlarge):
SFS Key Charts, Signals, & Video Analysis
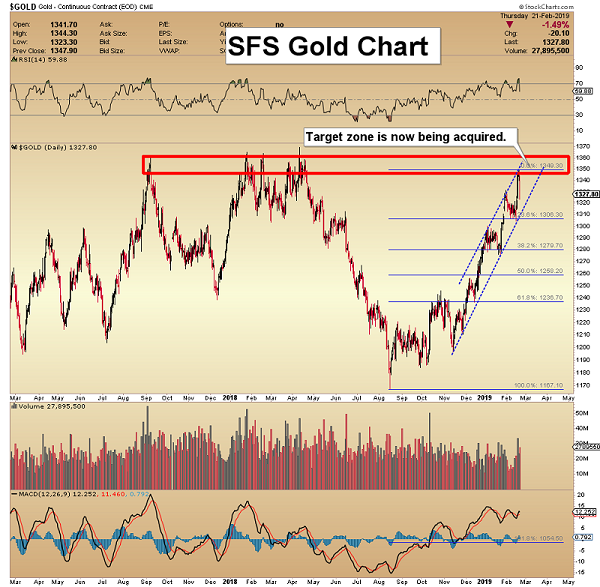
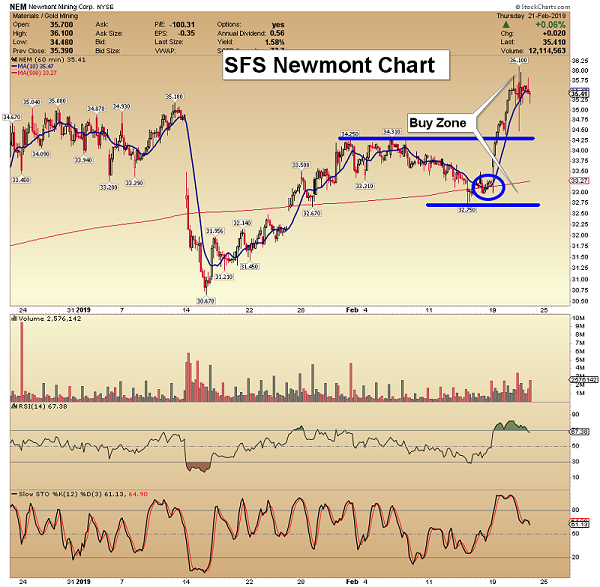
SF60 Key Charts, Signals, & Video Analysis
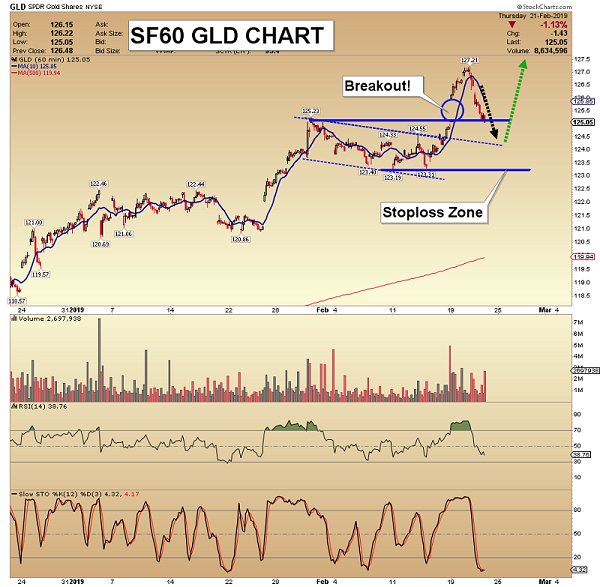
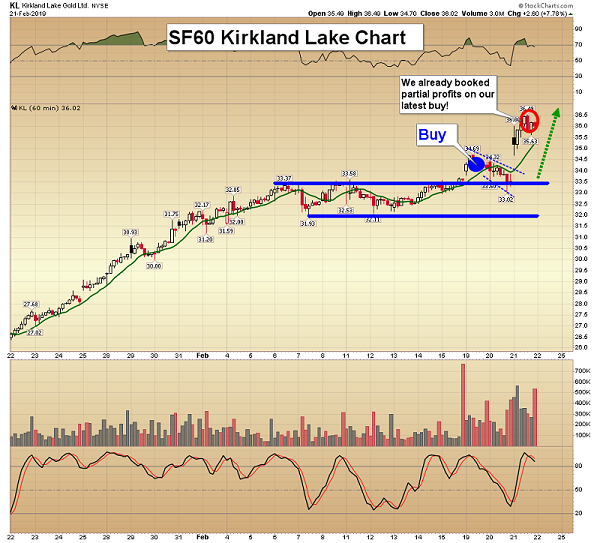
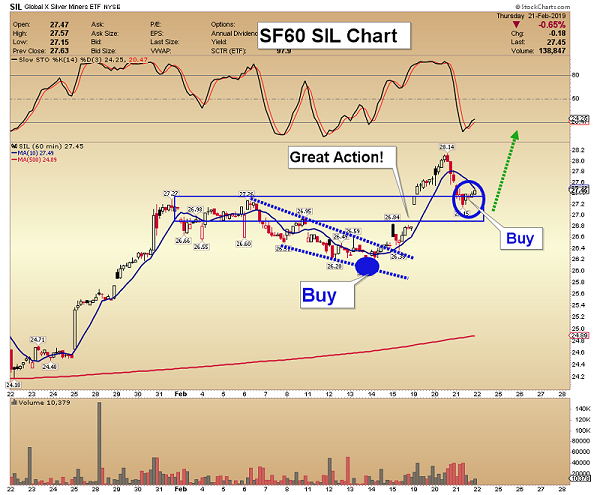
SF Trader Key Charts, Signals, & Video Analysis
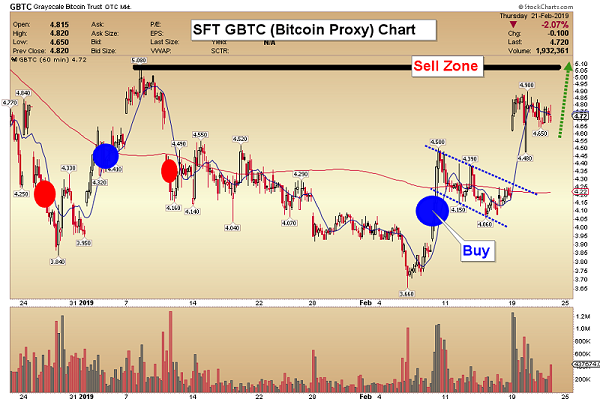
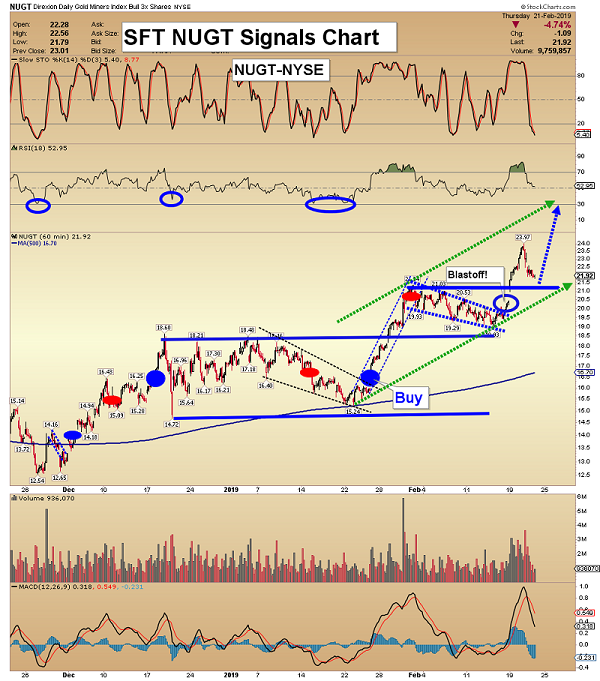
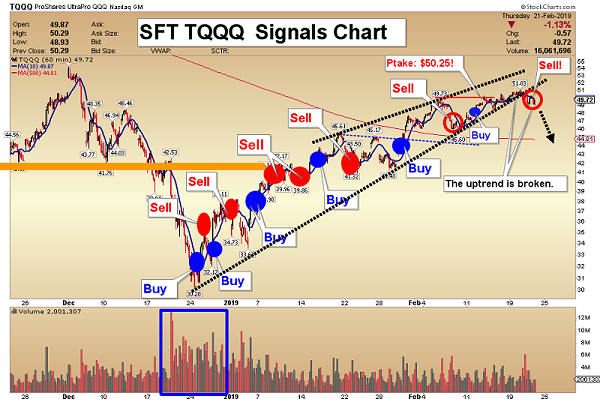
SFJ Key Charts, Signals, & Video Analysis
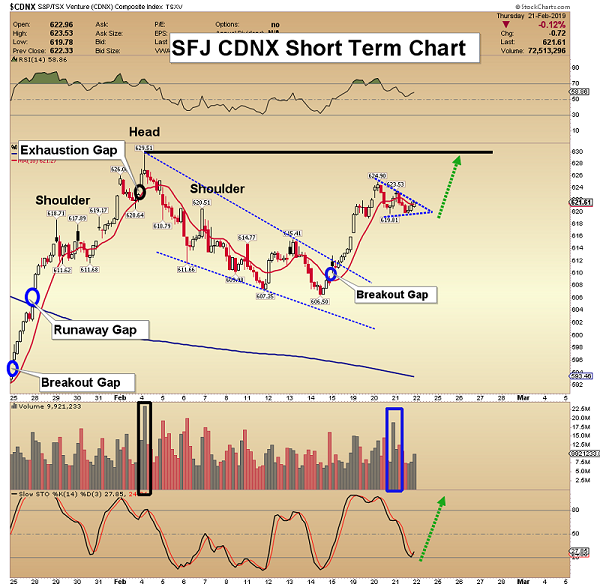
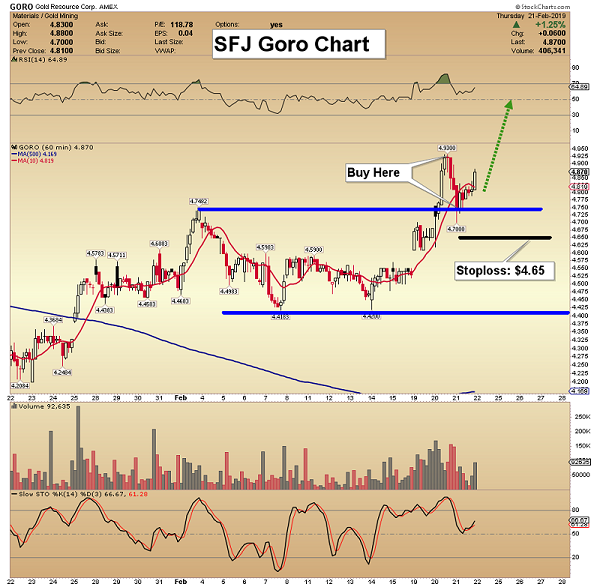
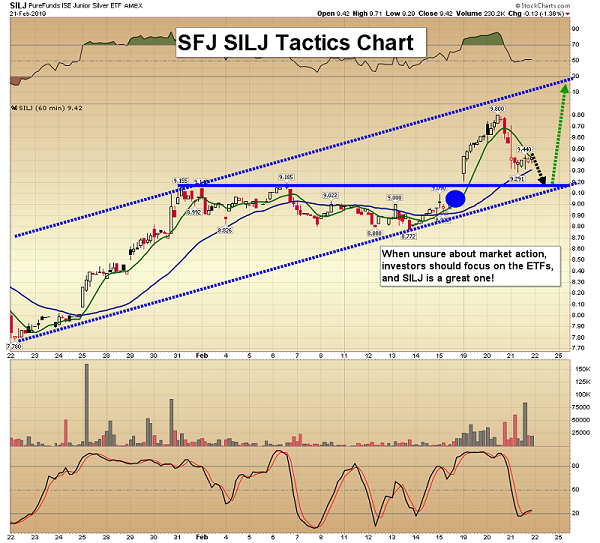
Thanks,
Morris Hubbartt
Unique Introduction For Web Readers: Send me an email to signals@superforcesignals.com and I’ll send you my “Hot Off The Press” junior miners free report, and 3 of my next Super Force Surge Signals free of charge, as I send them to paid subscribers. Thank you!
Galway Metals (GWM.V, GAYMF) is a Canadian exploration stock with two prospective projects located in strategic locations. Fundamentally, some things stand out.
1. Insiders
Over 30% of outstanding shares are in the hands of management and insiders. High quality management as both CEO and Chief Geo come from Kirkland Lake Gold (KL.TO) where they also held management positions. Another reputable insider is Wesdome’s (WDO.TO) CEO Duncan Middlemiss, who has an advising role at Galway Metals. Connections like these could be important in a later stage should
exploration continue in the current direction.
In the past year, 5 insiders have been buying their own stock, of which CEO Robert Hinchcliffe invested the highest amount. Through 2018, he bought $285,000 worth of stock in the open market and another $100,000 in a private placement. Other insiders put in between $25,000 and $88,000 of their own money into Galway Metals.
Insiders are dedicated as well. When looking at their personal holdings, the biggest part of this is held in GWM shares. Data like this can be retrieved on marketscreener.com. Management in this business usually has seats on more than one company’s board, which means they hold more than just one stock. Therefore, it’s interesting to see the weight of these. Allocations at Galway Metals show conviction: CEO 89%, VP 73%
and Chief Geo 47%.
2. History
Galway Metals was spun out of the Galway Resources takeover by AUX in 2012. At the time, Galway Resources was sold for $340M. Management is largely the same since then, so they’re experienced in growing an exploration stage company to one that’s prepared for production. Galway Resources (GWY) shareholders received a 47% premium in that deal.
3. Projects
Galway Metals has 2 projects in Eastern Canada in mine friendly jurisdictions in areas where infrastructure such as roads, railways and mills are closeby. Both projects have an existing resource for both gold and industrial metals. One million ounces of gold have been mapped to date and if we add the other metals, there’s 1.8 million gold equivalent ounces. These past years there has been a resource upgrade yearly, and this year as well, they will upgrade their existing resources on both projects
Clarence Stream
Located in mining friendly New Brunswick and in the proximity of a processing mill and (rail)roads nearby. Management hints that this project can represent a new gold district in Canada. Findings to date continue to prove this out: This project has 5 discovered zones thus
far on the main NE-SW trend with high possibility for new discoveries going by soil anomalies. Galway just announced assays from their fifth and new discovered zone: 7.3g/t over 36.7m (38.1g/t over 6.5m). A 50m stepout has been drilled which intersected visual gold twice. Results from this are pending.
This new discovery is in the middle of two known zones (Jubilee and George Murphy) that are 2km apart. Galway controls 65km of this main NE-SW trend and management believes this shares the same structure and has similar geology as Marathon’s (MOZ.TO) Valentine Lake project. Only 5km have been drilled and all zones are open in every direction. Wide mineralization at shallow depths with grades which would make this suitable for open pit mining.
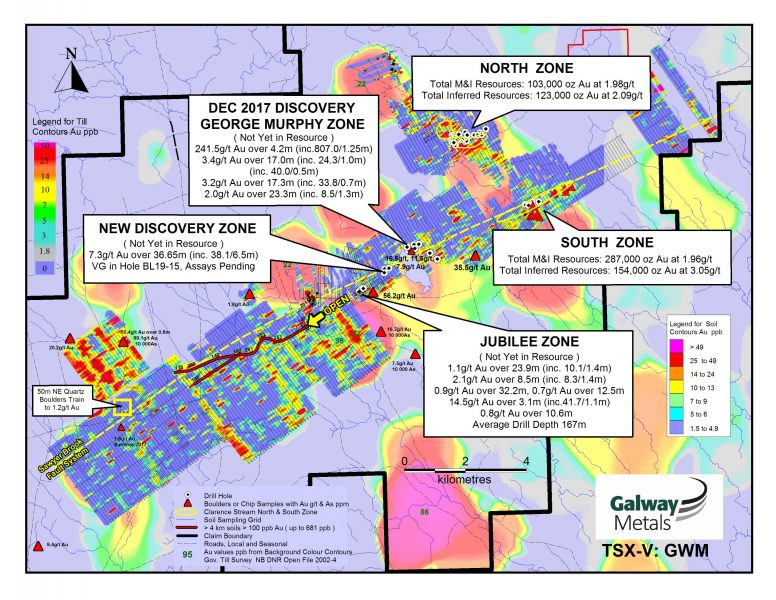
Estrades
Polymetallic project that saw production in 1990-1991:174,946 tonnes grading 6.4 g/t Au, 172.3 g/t Ag, 12.9% Zn and 1.1% Cu. Previous owner stopped production when metals prices dropped in 1991. Since then this former mine has been dormant for over 25 years. Located in mining friendly Québec with multiple deposits, active and historic mines in
the proximity. 31km of strike hosting 3 mineralized trends which hold a resource that’s high in Zinc (20.75% ZnEq) and Gold (11.28g/t AuEq).
Just like the Clarence Stream project, this is currently being drilled so news from here should flow in coming weeks.
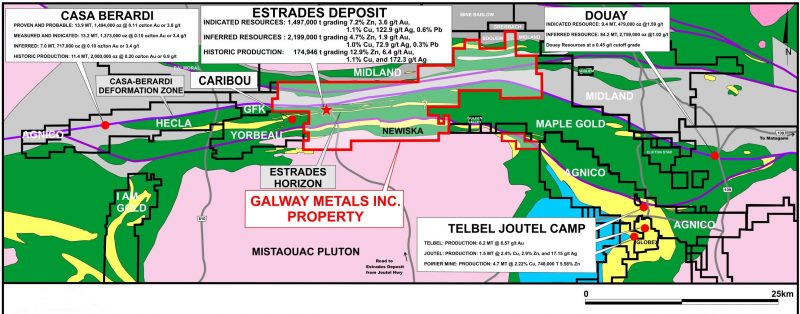
4. Cashed up
All that drilling costs money. Therefore, it’s interesting to know that Galway has about $7M in the bank after a recently closed private placement (in which 4 insiders participated), which means they can continue this aggressive exploration. Galway Metals doesn’t have any debt. Also of importance is that chief geo and vice president bought warrants with an execution price of $0.50, which -when executed- will add $750,000 to the treasury.
5. Catalysts 2019
Two catalysts this year for a revaluation. Catalyst # 1: Exploration success and new discoveries on Clarence Stream and Estrades. On Clarence stream, investors have a couple of pending results to look
forward to from drill cores that showed visual gold as well as future step-out holes from current zones. Catalyst # 2: Resource upgrade 2019 including the new zones. Management pointed at a resource upgrade this year that will – for the first time- include 2 new zones at Clarence Stream.
6. Comparables and valuation
When looking at other Eastern Canadian companies that share this continent scale trend, it’s easy to see their Clarence Stream project is favourably located in between known multi million ounce gold camps.
Similarities with Oceanagold’s Haile mine, which is an open pit mine that shares shallow depth in combination with high grades. Another similar case is Atlantic Gold over in Nova Scotia. This has the same
widespread gold occurrences on their property and built a central processing facility that’s currently being fed by the surrounding deposits.
Galway is not yet at this stage and management may not have the intention to mine it themselves. Just going by similar geological features and challenges, it’s positive to see nearby succeeded projects.
As valuation goes, when looking at the only metric we can currently apply – which is the enterprise value on a proven gold ounce basis- we’re sitting at $17.4/oz whereas this sector’s (pre feasibility) average is $52/oz. Noteworthy that this number is based on the current resource, that only holds 2 of the 5 zones at Clarence Stream.
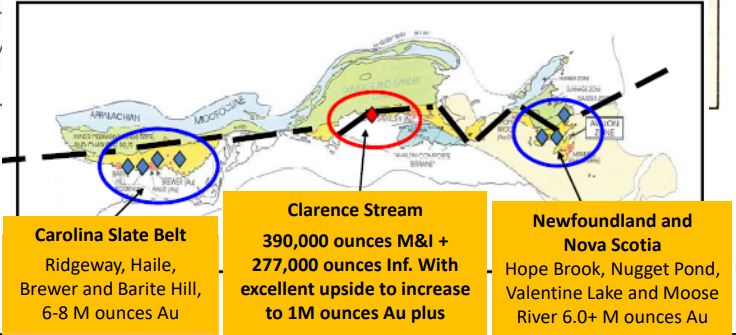
7. In Closing
As said in the intro, Galway has a lot going for it. Two catalysts this year that will continue to get fed from multiple fronts. Galway has a rather tight share float (107M) and they don’t need to collect funds any
time soon, meaning that their share price will benefit with a leverage effect when exploration continues to deliver. Management is experienced, respected, committed and on the buying side. Not to be taken for granted in any sector. Eastern Canadian gold deposits are on the rise and going by the fundamentals there’s good potential that this too will turn out to be a multi million ounce deposit, eyed by producing mining companies. Going by the EV/oz metric, there should be plenty of room for upside.
Jonas De Roose
February 22, 2019
Author Jonas De Roose is a Belgian retail investor in precious and base metals stocks with a drive for research and learning. He has a background in business development and marketing. He owns shares in Galway Metals and his article is not intended as investment advice. This article is based on his findings and based on his personal opinion. If you have suggestions regarding this company feel free to contact him at jonasderoose@hotmail.com.
by Morris Hubbartt
Jan 28, 2019
Here are today’s videos and charts (double-click to enlarge):
SFS Key Charts, Signals, & Video Analysis
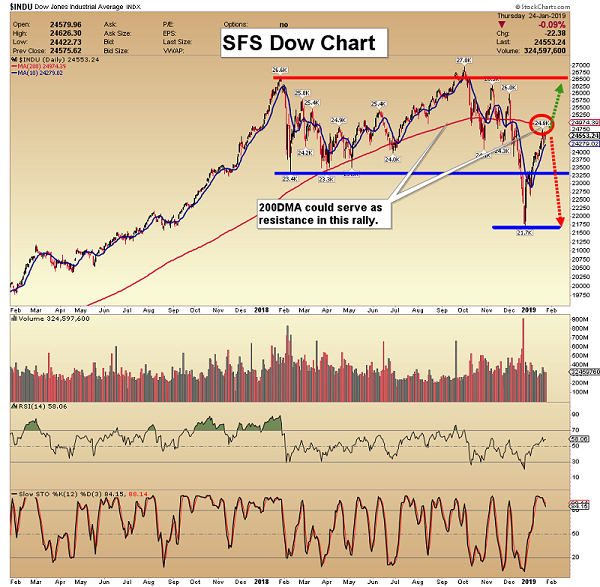
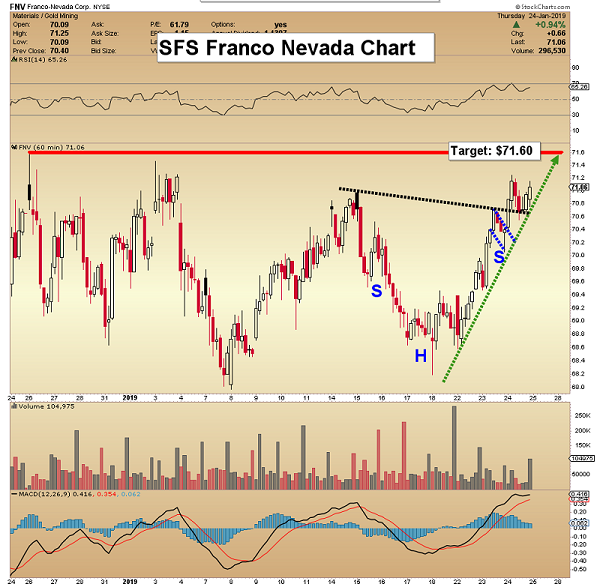
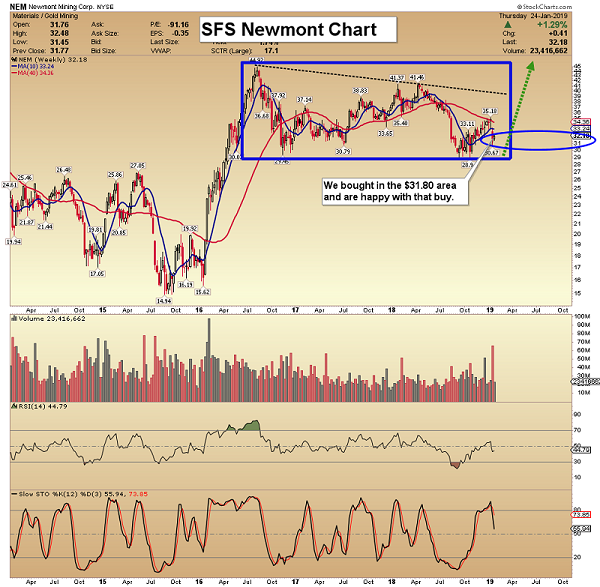
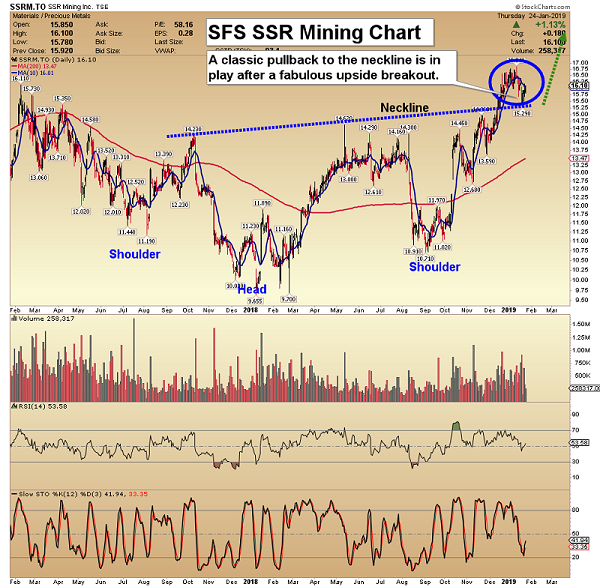
SF60 Key Charts, Signals, & Video Analysis

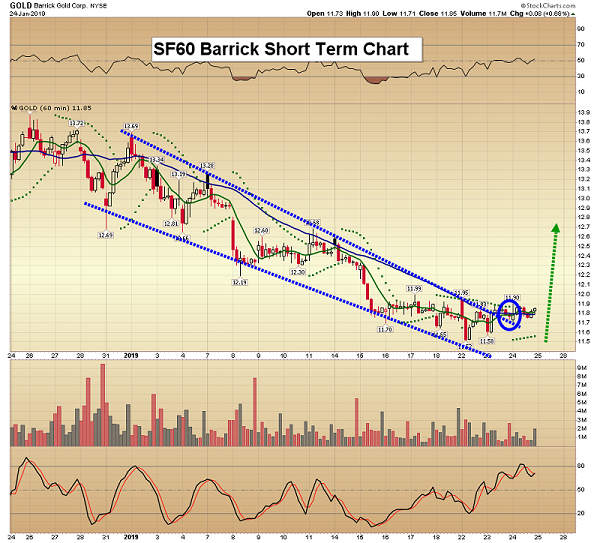
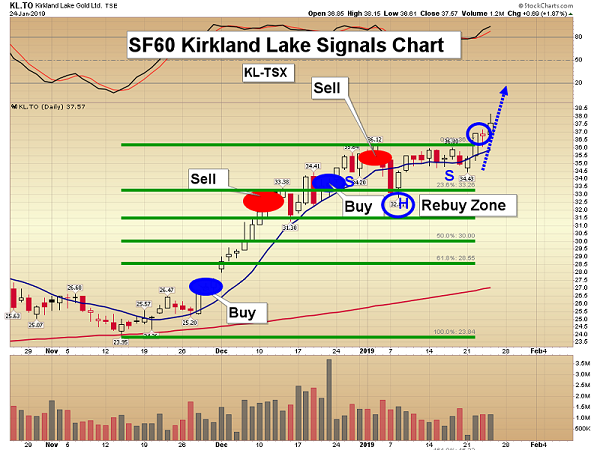
SF Trader Key Charts, Signals, & Video Analysis
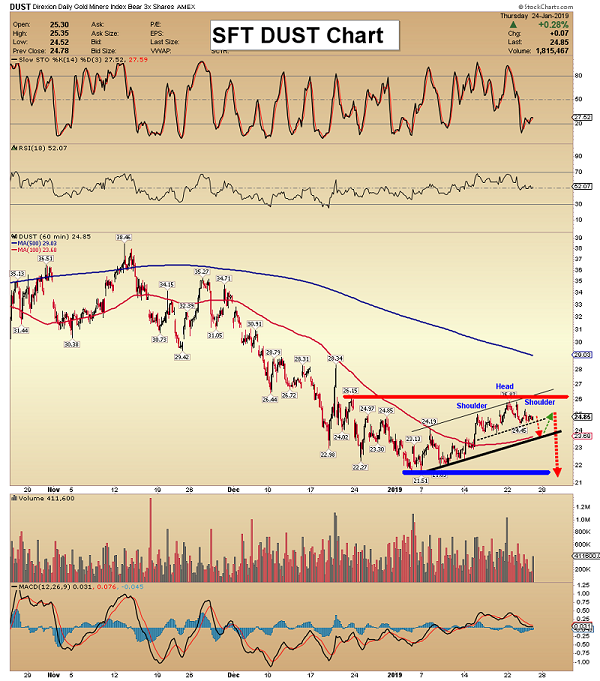
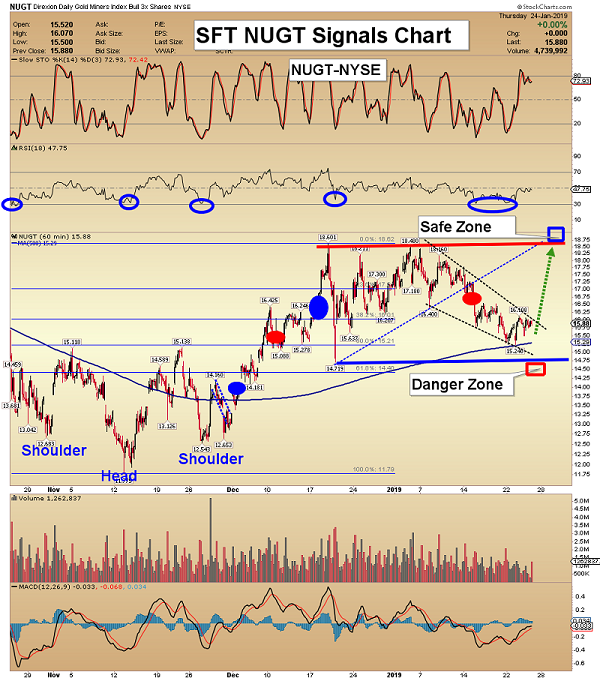
SFJ Key Charts, Signals, & Video Analysis
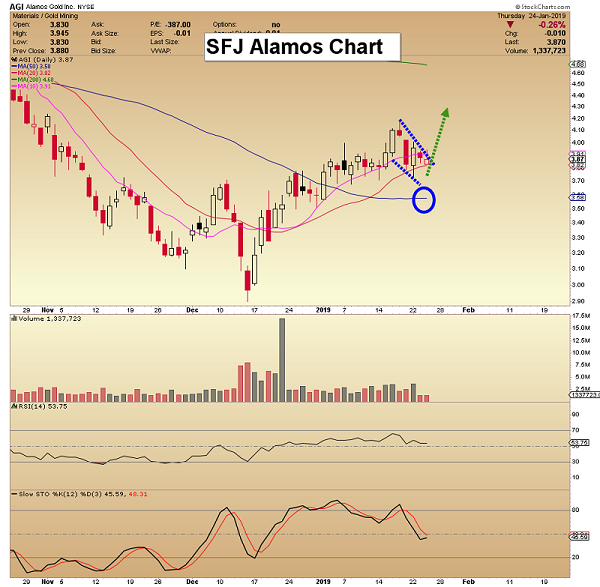
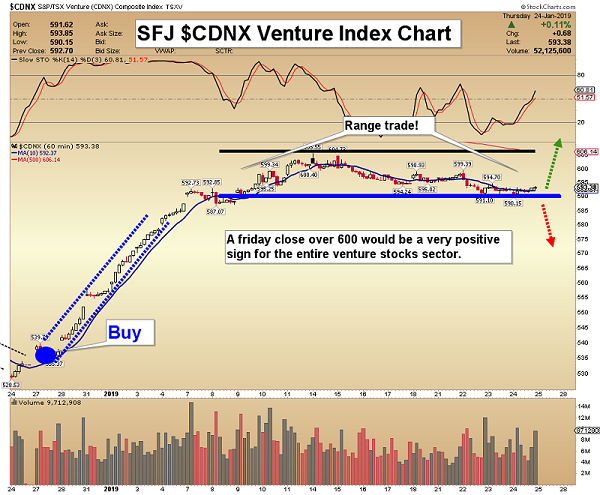
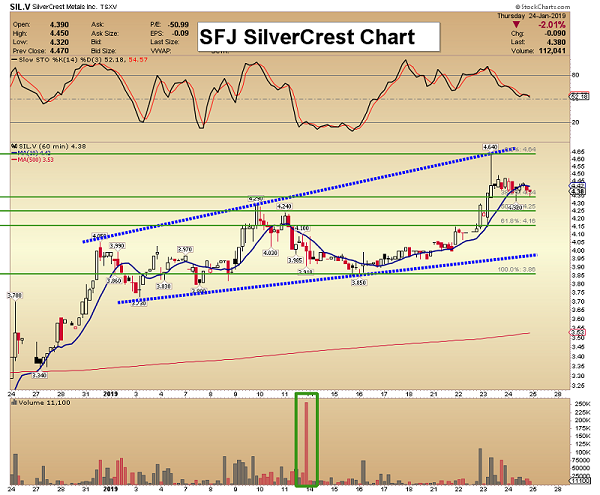
Thanks,
Morris Hubbartt
Unique Introduction For Website Readers: Send me an email to signals@superforcesignals.com and I’ll send you 3 of my next Super Force Surge Signals free of charge, as I send them to paid subscribers. Thank you!
Stay alert for our Super Force alerts, sent by email to subscribers, for both the daily charts on Super Force Signals at www.superforcesignals.com and for the 60 minute charts at www.superforce60.com
About Super Force Signals:
Our Super Force signals are created thru our proprietary blend of the highest quality technical analysis and many years of successful business building. We are two business owners with excellent synergy. We understand risk and reward. Our subscribers are generally successful business owners, people like yourself with speculative funds, looking for serious management of your risk and reward in the market.
Frank Johnson: Executive Editor, Macro Risk Manager.
Morris Hubbartt: Chief Market Analyst, Trading Risk Specialist.
Email:
by Peter Epstein
CEO Robert Mintak has 2 unconventional lithium projects in the U.S., one of which he believes is de-risked more than most lithium projects around the world due to infrastructure, permitting, jurisdiction and other key factors. While Robert can’t know for sure until Standard Lithium releases a Preliminary Economic Assessment (PEA), it seems likely that cap-ex will be low compared to conventional brine projects. For reasons explained below, op-ex is likely to be in the bottom half of the industry cost curve. The Company’s goal is to be in the bottom quartile.
Standard Lithium is on a clear path to signing a JV with giant German chemical company, LANXESS. If the JV is consummated, LANXESS will be committed to funding commercial development. This would be a tremendous de-risking event for the project and for Standard Lithium. Funding has been a huge challenge for lithium brine projects around the world. Please continue reading to learn more about this unique U.S. lithium project which could reach initial production in 2 years, 2021.
Peter Epstein: Please explain Standard Lithium to readers who are unfamiliar with your company:
Robert Mintak: We are an integrated technology and specialty chemical company. We are listed on the TSX-V as a mining exploration company but we are not exploring, you won’t see any new mineral discovery announcements coming any time soon. Our business model is simple and somewhat unconventional compared to our peers, we believe the fastest way to go into production and to limit investor risk is to form strategic partnerships that allow us to piggyback off the existing infrastructure and investment of massive operating commercial brine assets in the USA.
I have been involved in the lithium sector for the better part of the past decade. My experience and successes in the lithium sector have been in forging strategic relationships and partnerships with large multinational companies and stakeholders. Previous to Standard Lithium at Pure Energy I brought POSCO, Tenova Bateman, SRI and Tesla to the table, at Standard Lithium we have continued that dynamic with the agreements and partnerships executed including NYSE listed Tetra Technologies and of course our announced planned JV with LANXESS.
Epstein: How is your proprietary process different from lithium brine operations like those found in Argentina?
Mintak: First, I would like to state that the project drives the process. Every lithium brine project globally is by and large wholly unique. Not only the chemistry of the brine, when developing the process flow sheet, as a project builder you need to consider access to and cost of, chemical reagents, water, power.
Permitting, extraction & re-injection of brine, access to land and a skilled workforce arefundamental considerations before you even begin bench-scale testing. Trying to force an extraction technology on a project is akin to the square peg round hole analogy.
Going back to your question, our patent-pending selective extraction, technology, we call “LiSTR” vis-a-vis a typical Argentine brine project that would use either solar evaporation ponds or a modified version of solar evaporation with ion exchange. As I mentioned, the project drives the process.
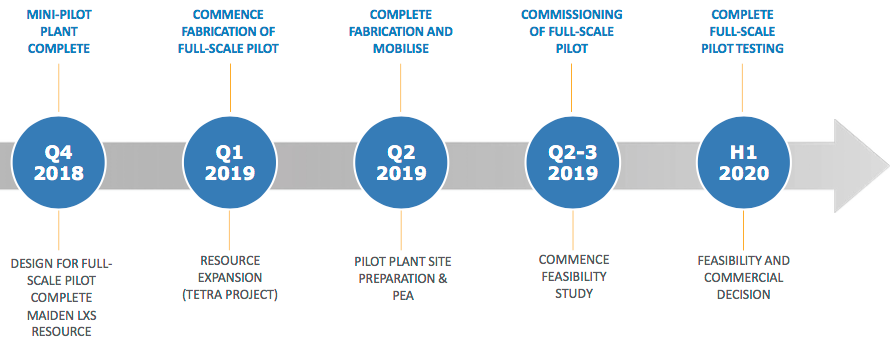
Mintak: It rains in south Arkansas, the land is hilly and forested, evaporation ponds are not an option. There has been significant work done over the years, by researchers, universities, large chemical companies etc. on lithium extraction processes and so we stand on the shoulders of giants or as we like to say, ‘we are boldly going where others have already gone’.
A unique advantage in south Arkansas is access to large volumes of raw brine to process test. Unlike our peers, we can literally open a spigot and fill large IBC’s or totes with brine and ship to our facility for process testing. We do not need to permit a well, or get extraction permits. This cut months off the development timeline and allowed us to test a number of existing extraction processes including, but not limited to; solvent extraction, a variety of ion exchange resins, nanofiltration, and floatation.
Through this test work, we have developed a proprietary process that uses a solid ceramic adsorbent material with a crystal lattice that is capable of selectively pulling Li + ions from the waste brine after it has gone through the bromine-extraction step. The ceramic adsorbent materials are mounted in stirred-tank reactors that contain brine. In the second step, the adsorbent releases the Li + ions for recovery. Importantly, the Li-extraction process takes advantage of the fact that the brine leaves the bromine process heated to ~70°C.
This means that no additional energy is required, the reaction kinetics for the adsorption is suitable. The process is capable of reducing the time required for Li extraction from many months (with the evaporation ponds) to hours, and is capable of producing a high-purity lithium chloride solution for further processing into battery quality compounds. The LiSTR process is designed to be scalable at each stage, from bench scale – mini-pilot- demonstration – commercial. We are using technologies and processes used in other industries, we are not reinventing the wheel, just turning it.
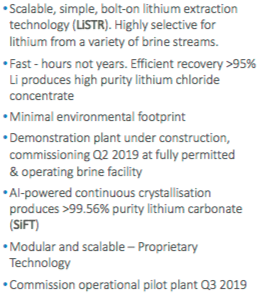
Epstein: How might your cap-ex compare to that of lithium brine projects? For instance, there are 6 projects at PEA-stage, or more advanced, with an average cap-ex of C$540M:
Mintak: We have not published a PEA, so I cannot comment directly on cost comparisons other than pointing to the existing infrastructure at the project. The well-fields are in place and currently producing and circulating 125 million barrels of brine annually. The pipelines are in place, as is power and water. Road and rail is at the site. This is a bolt-on technology to existing chemical plants.
Epstein: How might your op-ex/tonne compare to that of lithium brine projects?
Mintak: Again, we have not yet published a PEA, but we are targeting the lowest quartile cost of production for lithium carbonate. We have confidence that this is achievable as the primary cost inputs are very attractive in south Arkansas, power and water are plentiful and inexpensive. Chemical reagents are produced in or shipped in close proximity to south Arkansas, the region is well connected to the Houston shipping channel. At the project level, we can leverage the buying power of a global chemical company when procuring materials and service agreements.
Epstein: Please describe who LANXESS is. In what ways (if any) is LANXESS already helping you?
Mintak: LANXESS is a global specialty chemical company based in Cologne, Germany. They operate 74 chemical plants around the world, 19,000 employees. 2017 revenue around $11 billion. They acquired Chemtura in 2017 for $2.57 billion which included the Arkansas bromine business.
Current land operations in southern Arkansas encompass more than 150,000 acres, 10,000 brine leases, and surface agreements and 250 miles of pipelines. Their three bromine extraction plants currently employ approximately 500 people and they process and reinject 125 million barrels of brine annually (over 5 billion gallons)
We have signed a binding MOU and a general term sheet for a planned JV with LANXESS for the phased development of the south Arkansas project with the goal of producing battery quality lithium materials on a mass scale from brine that is a by-product of existing bromine production facilities run by LANXESS and from 30,000 acres of undeveloped brine leases that Standard Lithium holds.
As part of the binding MOU, we will locate and operate our pilot plant at one of LANXESS’ chemical plants in south Arkansas. We will connect the plant into their brine pipeline system, post bromine extraction, and demonstrate (on a continuous basis) our selective lithium extraction process. We will also be locating our AI-powered lithium carbonate crystallization pilot plant at the site in south Arkansas.
The MOU we have struck with LANXESS allows us to leverage their massive infrastructure investment to de-risk our processing technology without having to spend 10’s of millions of dollars on resource development and the years of time that would entail. The planned JV with LANXESS includes a commitment from them for commercial project financing (subject to proof of concept and a positive PFS). That is a very important differentiator between Standard Lithium and our peers.
Epstein: In addition to LANXESS, you have been working with a number of other parties, please explain.
Mintak: As a development company, managing the runway and executing on our business plan requires strategic planning. We have taken the stance that we can accomplish more and in a more cost-effective manner, through strategic partnerships and agreements. In south Arkansas, we secured the only available large brine lease package with our agreement with NYSE listed Tetra Technologies.
For our pilot plant development, we are working with two global brands, Salt Works Technologies in Richmond B.C. and Zeton in Burlington Ontario. For analytics and research, we are working with two professors from the fine chemical/pharma departments at the University of British Columbia.
Epstein: What’s the status of your pilot plant, and what are the next steps?
Mintak: Two pilot plants. We have two pilot plants in development. “LiSTR”, the selective extraction demonstration pilot plant is under construction in Burlington Ontario. Zeton is a global leader in pilot plant construction. The plant will be shipped from Zeton to south Arkansas in Q2 of this year and will be located at LANXESS’ Southern Bromine Extraction plant.
The site has virtually everything required to operate in place; steam, water, power, and the demo plant will connect to the existing brine feed and disposal pipeline system. We intend to run this plant in a continuous operating state, not in a batch process. We expect to run the plant through Q3/4 of 2019 and Q1 of 2020. The results of this work will feed into a Feasibility study targeted to be completed in Q2 2020.
The second pilot plant is our “SiFT” Lithium Carbonate Crystallisation Pilot Plant which is being built by Saltworks Technologies Inc., at their facility in Richmond, British Columbia, Canada. The crystallisation technologies used today in the industry were developed in the mid-twentieth century and are suited for producing technical grade compounds. As higher and higher purity compounds are needed by cathode makers the industry needs to evolve.
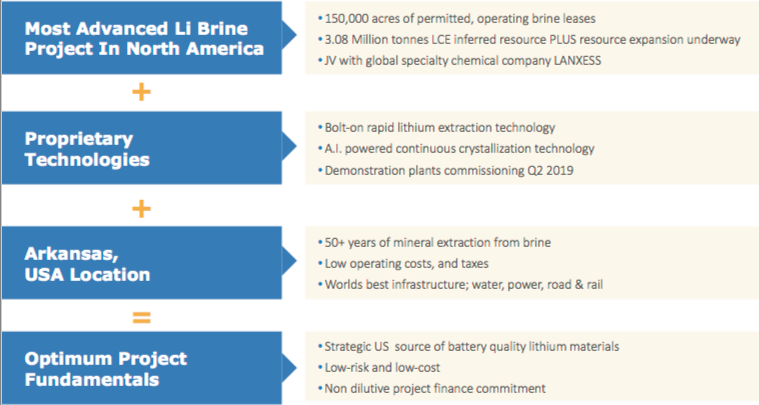
Mintak: The SiFT process has been developed by Prof. Jason Hein at the University of British Columbia and introduces advances and technologies from the pharma and fine chemical world to the lithium battery material world. It integrates Artificial Intelligence (AI) enabled high-speed, multi-image photo-microscopy and computer image recognition for crystal size and shape that acts like an auto-pilot, continually monitoring and optimizing the process. We have an operating prototype pilot plant that we are currently testing. The next step is to build a demonstration-scale plant that we will ship to Arkansas in the Q3 of 2019.
Epstein: Most conventional brine projects are planned for about 20,000-30,000 tonnes of Lithium Carbonate Equiv. (“LCE)/yr. Will your project be able to scale up to that range?
Mintak: Yes, that is an achievable production target based upon current commercial brine production volumes, with an expansion opportunity from our undeveloped brine leases.
Epstein: Please describe Standard Lithium’s near-term catalysts.
Mintak: The immediate near-term catalysts to watch for are a PEA in late Q1 or early Q2 and of course, our pilot plant(s) being moved to site and commissioned in the first half of this year. Investors can also expect further details on our strategic agreement with LANXESS.
Thank you Mr. Mintak for a detailed review of Standard Lithium (TSX-V: SLL) / (OTCQB: STLHF).
Peter Epstein – January 25, 2019
Disclosures: The content of this interview is for information only. Readers fully understand and agree that nothing contained herein, written by Peter Epstein of Epstein Research [ER], (together, [ER]) about Standard Lithium, including but not limited to, commentary, opinions, views, assumptions, reported facts, calculations, etc. is not to be considered implicit or explicit investment advice. Nothing contained herein is a recommendation or solicitation to buy or sell any security. [ER] is not responsible under any circumstances for investment actions taken by the reader. [ER] has never been, and is not currently, a registered or licensed financial advisor or broker/dealer, investment advisor, stockbroker, trader, money manager, compliance or legal officer, and does not perform market making activities. [ER] is not directly employed by any company, group, organization, party or person. The shares of Standard Lithium are highly speculative, not suitable for all investors. Readers understand and agree that investments in small cap stocks can result in a 100% loss of invested funds. It is assumed and agreed upon by readers that they will consult with their own licensed or registered financial advisors before making any investment decisions.
At the time this interview was posted, Peter Epstein owned shares in Standard Lithium and it was an advertiser on [ER]. Readers understand and agree that they must conduct their own due diligence above and beyond reading this article. While the author believes he’s diligent in screening out companies that, for any reasons whatsoever, are unattractive investment opportunities, he cannot guarantee that his efforts will (or have been) successful. [ER] is not responsible for any perceived, or actual, errors including, but not limited to, commentary, opinions, views, assumptions, reported facts & financial calculations, or for the completeness of this article or future content. [ER] is not expected or required to subsequently follow or cover events & news, or write about any particular company or topic. [ER] is not an expert in any company, industry sector or investment topic. [ER] may buy or sell shares in Standard Lithium and other advertising companies at any time.
Guest Post by Bill Powers
January 11, 2019
Adrian Day of Adrian Day Asset Management is a seasoned investor, speaker, author, and adviser. In this interview, Adrian shares key takeaways from 2018 that affect the resource sector and offers his commentary on the Barrick-Randgold merger and its significance. Adrian also provides general insights on mergers and acquisitions within the mining sector, what he looks for in a junior royalty company, and his outlook on copper and copper mining stocks. Dispersed throughout the interview, Adrian discusses five mining stocks that he likes and which he thinks present an exceptional investment opportunity right now.
Bill: Welcome back and thanks for tuning in. You’re listening to the Mining Stock Education podcast and I’m Bill Powers, your host. For this episode, I’m joined by Adrian Day of Adrian Day Asset Management. Adrian is a well-known investor, speaker, author, and adviser when it comes to resource investing, and as I’ve said previous times on this podcast, Adrian wrote the first book that I ever read on resource investing and helped to pique my interest in this niche sector. Well, my last interview with Adrian was about two years ago at PDAC 2017, but Adrian joins me again today, so Adrian, thanks for taking the time to come on the podcast and share your insights.
Adrian: Well, thank you very much, and thank you for the nice comments, as well.
Bill: Let’s talk about the resource sector, first last year, as you peer back over 2018, can you recap for us some of the highlights, and important events that you see, and their significance?
Adrian: As I’m sure most of the listeners know, most resources were down during the year. Resources are a tricky thing because all of the indices are different, and most of the indices are actually commodity indices, which will therefore include a lot of soft commodities like grains and cattle and so on, which most of the people who follow resources are not really interested in, but nonetheless, most of them were down last year, the entire group was down 13%, and that’s even though some of the soft commodities were up, but clearly the most important things were the continued strength in the dollar for most of the year, other things being equal as we know, and things are never equal, but other things being equal, any time you price something in dollars, if the dollar is strong, the dollar price of that commodity is weaker, obviously.
The second major factor was the growing, ongoing tariff war between the U.S. and China in particular, and concerns that that might lead to a swelling global economy, so it’s the tariff war itself, but it’s also concerns of what it might lead to. And then of course, the third thing was the ongoing, the step up in I hate to call it tightening, but interest rate increases by the federal reserve. As you know, they announced that they had stopped QE and we’re going to start tightening back in 2015, and we saw one small rate hike at the end of this 2015 in December, and then a whole year later, we saw another one, so those are very slow in coming, but last year, we had four raises, and so it appeared perhaps that the fed was going to continue pushing rates up, so all those three, and that of course, also not only is that raising the cost of capital for a capital-intensive industry, so that’s a negative in and of itself, but secondly, the concern of raising rates too much might lead to a slowing economy again.
So those three factors, I think, were the main things that just pushed commodities down, and they’re all macro. I’m not talking anything micro, because I think last year the macro, other than perhaps for oil, I think the macro was far more important than the micro last year.
Bill: Within the major miners last year, we saw Barrick and Randgold merge. What’s your commentary on their merger and its significance?
Adrian: Well, it’s interesting because there was, as you know, no premium offered. Barrick obviously approached Randgold. I think it means more to Barrick than it did to Randgold, but there was no premium offered, which was very unusual, and Barrick has suggested, and Bristow from Randgold has echoed that, that we’re likely to see more mergers, more no-premium mergers as the industry consolidates. This is a very, very, for the size of the industry, it is an extremely fragmented industry, both among seniors and even more so among juniors. Very, very fragmented. That is inefficient because if you have 20 companies of a $2 billion size, you’ve got 20 managements to support. It’ll be interesting to see what happens with the Randgold-Barrick, I know that’s not what you were asking me about, but the most important thing to watch there, I think, is the difference in styles between Mark Bristow and Randgold and John Thornton and the masters of the universe at Barrick.
It’ll be interesting to see if they can consolidate or if there’s going to be a culture clash, but that’s a different question. I think we’re going to see consolidation. We have to. We’re going to see it among juniors as well. The difficulty always is if you don’t have strong asset synergies, then your synergies have to come, your benefits have to come from cost savings, which means reducing overlapping managements, essentially, and most people who run companies don’t want to voluntarily give up their jobs, and that is, I think, the biggest problem we have in not rationalizing the industry, particularly at the junior side.
Bill: Unless there’s a large premium and there’s some incentive for management, a windfall, would you say, at the junior level? It’s just that windfall that management would get that would cause them to acquiesce and give into such a merger?
Adrian: No, absolutely, and I think you’re more likely to see that kind of premium when a company, let’s say an exploration company, makes a discovery, and another company wants that discovery because it’s synergistic with something they have, and they’ll offer a premium. I was thinking more, and I don’t particularly want to mention names, because I don’t want anyone to get the wrong impression, but you look at a lot of, let’s say exploration companies, that might be doing good work, but just haven’t made a discovery, and you might have a company, an $8 million market cap, a $12 million market cap, a $10 million market cap, each of those companies has their own managements plus their own regulatory requirements and everything else, and typically if the company is a $10 million market cap, I would say typically 75% of the money they raise goes into overhead, not into the ground.
So if you combine three or four or five companies of $10 million, $15 million each, first of all, you get something that’s a little bit more liquid and therefore more open to more investors or more investors are open to it, $200 million market cap, let’s say. Still small but not micro, and maybe you can reduce, if you have a $200 million market cap, you can reduce $150 million overhead. You can reduce that to $100 million or $75 million, which means more of the money you raise can actually go into the ground, and so it’s not that any of these companies, in many cases, it’s not that any of these companies are doing bad work or are crooks, that’s a totally different issue. I’m talking about good companies with good managements doing good work, but if you’re only $10 or $20 million market cap, inevitably you have to keep raising money, and inevitably a lot of that money, a majority of that money has to go to just staying alive, regulatory fees, compliance fees, filing fees, et cetera, et cetera.
That’s if they’re not overpaying themselves or anything. Again, we’re not even getting to the companies where they overpay. We’re just talking about good companies doing good work, but if they don’t make a discovery, nobody is going to offer them a premium. Why would you offer a premium to someone that doesn’t have a discovery and doesn’t offer you particular synergies? There’s a lack of incentive for these companies to merge because nobody who went out, some of them were 15 years with Placer Dome and again, I’m not talking about anyone in particular, this is a hybrid individual, and he got tired of a big company and he went out and started his own company and raised some money. He doesn’t want to give up his company, and that’s a problem.
Bill: Still talking about mergers and acquisitions except from the investor’s perspective and where they can find the best value in 2019, I’ve spoken to Rick Rule a couple times over the past year and he points out that he thinks one of the most consistent and best opportunities for resource investors is trying to locate those takeover targets before they’re taken out. Would you agree with that and is that one of the places where you’re looking for your investment dollars in 2019?
Adrian: Well, far be it from me to disagree with Rick Rule. I think how I see it is I look at potential takeovers as icing on the cake, so I rarely, not never, I rarely buy a company simply because I think it’s going to get taken over because all too often, one can be disappointed, or it can frankly just take too long before that comes to pass, but if I like a company, I like the management, I like the property, I like what they’ve got anyway, then a takeover can be icing on the cake, and we do have several companies we own, but I expect that I’m fully expecting to get taken over at some point, and frankly, over the last couple of years, we’ve had four, five that have been taken over. Yeah. We’ve got several, and I don’t know if you want names?
Bill: Yeah. Please provide names. What’s of interest to you? You make some of your positions public through your writings or through interviews like this. Can you comment on any of your positions that you’ve made public and some of them that you think are the best value right now?
Adrian: Yeah. I’ll mention on the junior side, I’ll mention a couple, and this one gets back to takeover. Almaden has a great project called Ixtaca in Mexico. It’s a gold-copper project. They’ve just completed a final feasibility. They’ve applied for permits. Almaden is a junior company, very small company. Good people. One would not typically expect them to put this project into production. It’s a very low capex project, a very simple project to run metallurgically, so Almaden is suggesting that in fact they might put it into production themselves if they don’t get an attractive enough offer because it is a simple project and so on.
We own it because we like the project, we like the economics. The thing is selling at about a fifth of the value of … Don’t quote me. It’s even less than a fifth of the value of the feasibility study. At the same time, it’s the kind of project that I wouldn’t be surprised if someone was interested in taking over. 50% silver is very attractive to a lot of silver companies, where primary silver mines are increasingly rare, so this is an attractive project from that point of view, and it’s in Mexico, which despite everything about the new administration, Mexico still remains one of the best mining jurisdictions in the world, so I’m just looking this up. It’s got an after-tax value of $310 million. It’s got a market cap of $80 million.
I think there’s a lot of room there for someone to come in and take the company over, so again, we don’t own it just because we think it’s going to get taken over, but we think there’s a strong possibility that it might get taken over.
Bill: So you like royalty companies. That’s well known. You often in many interviews talk about some of the larger billion dollar plus royalty companies, but of recent years there’s been more of the smaller junior royalty companies come up. Can you talk about what you look for in a junior royalty company, and what are your general comments on, let’s say, the sub-$500 million market cap and below royalty space right now?
Adrian: Yeah. Good question. The first thing I look for is the same thing I look for in any junior company, which is management. You’ve got to have a strong management, and strong management means obviously a lot of things. A management that can execute. A management that has a good business plan and has vision, can execute, can talk to the market, and so on. That’s number one, and number two is balance sheets. You want a company that is able to raise money because it has connections, does not overspend. That’s important. And so when you’re looking at the thing with royalties is there’s a huge difference in valuation between a small royalty and a large royalty.
So if you look at my favorite junior, which would be Metalla. Metalla is a $70 million market cap. Let me just see what the … We don’t even have a P/E ratio. I’m just looking at a metric so we can compare. Price to cash flow of 26, and if we looked at Franco-Nevada, we get a price to cash flow of about the same, but on other metrics, the bigger ones are a lot smaller, on enterprise value, and so on. And so you buy a junior rather than a senior because you think they have the ability to grow and the ability for that valuation to expand, so you want to look at a company that has been able to execute. Metalla, for example, has been around about a little over two years now, two and a half years, and they’ve managed to get four producing royalties, a pipeline of about 14 or 15 in various stages from exploration to developmental, and near-term production, and in fact, they’ve actually introduced a dividend now. The dividend yield is about 2.3% right now. It’s an attractive dividend yield in and of its own right. It’s unusual for a growing junior to pay a dividend.
Bill: Is that the smallest market cap company in the junior space that pays a dividend? You may not know it offhand, but that strikes me as well.
Adrian: It’s definitely one of. I know there’s been one or two that I think had to stop the dividend because it just didn’t make sense. In the case of Metalla, they’re paying a percentage of their revenue as a dividend, so there’s absolutely no reason why they shouldn’t be able to sustain paying a dividend, and I think the idea, again, it’s unusual, but the idea was to show that the revenues that they had achieved were actually sustainable. So you want a royalty that’s growing and that can add various projects and get a diversity of royalty income coming in. Again as I mentioned, Metalla has four producing royalties. Franco has something like 43, so it’s a somewhat different scale, but the idea is that they will build up that revenue stream, and the diversity of the revenue stream, and potentially this would be a takeover candidate at some point for a senior royalty company that has difficulty adding to its royalty base, but that’s maybe two or three years away from now. That’s not an immediate prospect. We own Metalla right now because it’s a solid company, good balance sheet, great management, and it’s growing.
Bill: Would you say that the competition amongst those sub-$500 million dollar market cap junior royalty companies is stiffening, that it’s more competitive for these deals?
Adrian: It’s getting more competitive. For the larger royalties, it’s extremely competitive, as you know. They all look at the same things, Franco, Royal, Wheaton, and Osisko to a large degree, to some degree, but if a royalty is available, they’re all looking at it, and no company is going to do a private deal on a half billion dollar royalty. It always go out to auction or they’ll talk to others, and frankly who gets it depends really on who happens to have the cash at the time and for whom it most logically fits. If someone has just done two big copper deals, a gold byproduct from big Chilean copper mines, they may not be willing to pay up for another billion dollar Chilean copper mine byproduct credit royalty, if you understand what I mean, but sometimes the returns on these deals at current prices are extremely low.
There was one deal recently, a large deal, over half a billion, with a stated return of 1.1%, and it wasn’t necessarily a bad deal. It was a 60 or 70 year mine life, and it was a mine with a lot of upside potential, but nonetheless, that just gives you an indication of how competitive that sector is. When Metalla started, they were really able to … I think it’s true to say that for smaller deals, it’s sometimes able to do a transaction between a royalty company and a company without that project going out to auction to other companies. It has been possible, and so you see a particular company that you think you can do a transaction with, it’s been possible to do it, but I think increasingly, companies are wanting to shove their deals to everybody, and there are more juniors out there, so that sector is going to get a little bit more competitive.
But you know, there aren’t that many companies at the sub-$100 million. People often think of Sandstorm as a small one, but Sandstorm is $850 million market cap, so it’s small compared with Franco, but that’s 10 times larger than Metalla, so at the moment, and I don’t mean to keep harping on Metalla, but at the moment, a company of that size can be a lot more nimble than most of the market, and frankly, they can look at deals that other companies aren’t interested it.
Bill: I was talking to a mining engineer recently, and he said that even though investors looking at these deals may see a 15% IRR, internal rate or return, there’s not a lot of 15% internal rate of return projects out there. Would you agree with that?
Adrian: For royalties or for projects generally?
Bill: For royalties in particular.
Adrian: Definitely for royalties. No question. If you have a 15% IRR on a royalty that is acquired, or created, there’s probably something wrong with it, which it might be in the Sudan or whatever. Any double digit rate of return on a royalty is pretty tough.
Bill: Adrian, before you go, I’d like to get your comments on copper. That’s a metal that you like. Two years ago when I first interviewed you, in fact, you told me that copper was your number one after the precious metals. What’s your perspective on copper right now? We saw copper fall from about $3.30 a pound at the peak, halfway through last year, and now it’s close to 52 week lows, trading around $2.67 per pound. We have the trade talk and the trade truce supposedly between the US and China right now. Can copper in your opinion fall even lower in 2019? We know that there’s the supply deficit ahead of us here, but what about copper in 2019, and in particular, what about the copper equities? Could the copper equities even go lower?
Adrian: Well, things can always go lower. That’s one of the things you certainly learn in the resource business, resource investing, that however cheap they are, however cheap they appear, undervalued they appear, they can always go lower. Copper was interesting last year because as you mentioned, copper actually had a quite strong first half of the year, so it really struck me that copper was really beginning to turn around until the tariff trade dispute really heated up, and that’s what knocked it back. Copper remains after gold, it remains my favorite metal and my favorite base metal, and it does face that near-term production deficit, even without a pickup in demand. Now of course, you don’t want demand to collapse because of a global recession or a Chinese recession, but you don’t need a great pickup in demand for copper to move into a deficit.
You look at big copper mines are very rare. One has to really emphasize this. A big copper mine is very, very rare, and Richard Adkerson, the CEO of Freeport, on the latest conference call, mentioned something really fascinating. Despite the fact that we had that super cycle from 2001 for 10 years, when China was developing and all the base metals including copper were going crazy, not a single new copper mine has joined the list of top 10 producers or top 10 in reserves. Not a single one, despite the fact that we had that super cycle and despite the fact that people were spending money looking. Not only are they rare, but they take time to develop. Freeport has recently announced that apart from a couple of mines already in development, they are not giving the go-ahead to any new mines until the copper price looks more certain.
He said it would take a minimum of five to seven years for another mine to commence production from the time they give the go-ahead, and the way he put it was even a shovel-ready mine, five years minimum from the time the go-ahead is given. He indicated, and I think it’s true, that that stands, so no new mines is true for most of the global, major copper miners in the world. And so you can look ahead with a fair degree of certainty, a high degree of certainty, in fact, on what the potential production next year, the year after, three, four, five years from now, you can look ahead five years with a high degree of certainty what the potential production is going to be, because there’s going to be nothing producing copper in 2023. Nothing that we don’t already know about, right?
On the other hand, there’s a bigger chance of downside surprises. Some of the big copper mines start depleting quicker than we thought, there’s an earthquake in Chile that causes disruptions-
Bill: The union strikes.
Adrian: Union strikes, et cetera. The surprises with copper production are likely to be on the downside, not on the upside, so absent a collapse in demand, we are going to see shortages in three or four years’ time, and that’s got to mean higher prices. We are accumulating copper companies. I think you do need a company with low-cost mines so they can withstand short-term weakness, continue to withstand any continued weakness, and a lot of these mining companies do have their own peculiar problems, but we like Freeport a lot. That’s the largest outside the Chilean government-owned Codelco, it’s the largest private, publicly traded copper company in the world.
Freeport I think is very, very cheap, and they’ve cleaned up the balance sheet tremendously. They’ve done a superb job at cleaning up the balance sheet. Lundin which again has a great balance sheet. I wouldn’t call Freeport’s great, by the way. I’d just say they’ve done a good job cleaning it up. Lundin on the other hand, Lundin Mining does have a great balance sheet. They’ve got a lot of cash. They’re in a position to buy something if something good comes along. As you know, they tried to buy the Timok and they tried to buy Nevsun, but that didn’t work. They got trumped. Frankly, an unusual idea, I like Zijin, which is the Chinese company that purchased Nevsun, the largest gold-mining company in China, but a large, diversified mining company. Gold is their largest asset but copper is about half of what they have in gold and they want to increase their copper, and they also have some zinc mines they’ve bought.
They recently did a secondary offering just last week in order to finance the Nevsun purchase. Stock fell sharply from nearly 3.20 down to 2.76. I think it’s a good buy at today’s price, and it pays a dividend at 3% or something, 4% now. 4%, sorry, at today’s price.
Bill: Adrian, if I could do one follow-up question on copper, you’re a long-term investor, so you’re not in it for short-term trading, but for the short-term trading speculators listening to us, with the trade negotiations between the U.S. and China occurring right now, do you think specifically the copper equities and the junior equities, what’s being priced into those equities now? In other words, is there a lot of downside? If the trade talks fall apart between the U.S. and China, how much downside is still left in some of these depressed equities?
Adrian: Good question. I don’t think there’s a lot of downside left anymore. You look at the major ones and they are selling very close to their lows. You look at the juniors, which were slammed on tax loss selling as well as the macro scenario we’ve discussed. I don’t think there’s a lot of downside left. Obviously, if there was an abrupt end to trade talks with some nasty tweets on either side, the stocks would fall, no question, but I don’t think there’s a major sustained downside at this point.
Bill: Well, Adrian, before you go, is there any contact information or ways people could follow you?
Adrian: Oh, thank you. I appreciate that. Yeah. The best thing is to look at the website first, which is www.adriandayassetmanagement.com, all one word.
Bill: Adrian, thank you for the conversation. I appreciate you joining me on the podcast. Have a great day.
Adrian: Thank you. I appreciate it.
About the Author: Bill Powers is the host of the Mining Stock Education podcast which interviews many of the top names in the natural resource sector and profiles quality mining investment opportunities. Bill is an avid resource investor with an entrepreneurial background in sales, management, and small business development. His latest interviews can be found at MiningStockEducation.com.
The dovish Federal Reserve lit a fire under gold and its miners’ stocks this week. As universally expected the FOMC hiked rates for the 9th time in this cycle. But it also lowered its 2019 rate-hike outlook bowing to the stock-market selloff. Traders dumped gold initially thinking that wasn’t dovish enough. But market reactions to the FOMC formed over a couple days, and gold surged overnight. Its post-Fed rally has great potential.
Gold-futures speculators dominate gold’s short-term trading action. They punch way above their weight in capital terms thanks to the extreme leverage inherent in gold futures. This week, the minimum margin for trading each 100-ounce contract controlling $125,000 worth of gold at $1250 was just $3400! These traders can run crazy maximum leverage as high as 36.8x, compared to the stock markets’ legal limit of 2x.
At 10x, 20x, or 30x leverage, every dollar of capital deployed in gold futures has 10x, 20x, or 30x more price impact on gold than a dollar invested outright. Further compounding speculators’ hegemony over gold prices, gold’s world reference price derives directly from US gold-futures trading. Naturally extreme leverage means extreme risk. At 37x a mere 2.7% gold move against positions wipes out 100% of capital risked!
In order to survive, gold-futures traders are forced to have an ultra-short-term focus. Their time horizons are measured in hours, days, and maybe weeks instead of months and years. And there is nothing that motivates them to trade aggressively like meetings of the Fed’s Federal Open Market Committee. Gold volatility often surges in their wakes, as speculators watch the U.S. dollar’s reaction and do the opposite in gold.
Gold-futures speculators are convinced Fed rate hikes are bearish for gold because they are bullish for the US dollar. They logically reason that the higher prevailing US interest rates, the more attractive the US dollar becomes relative to other currencies. And a stronger dollar usually means weaker gold since they are competing currencies. That all sounds rational, but the big problem is history doesn’t bear this out.
The FOMC started today’s rate-hike cycle way back in mid-December 2015, raising the federal-funds rate for the first time in 9.5 years. Gold-futures speculators fled leading into that, ultimately crushing gold to a deep 6.1-year secular low of $1051 the day after. But that oversold extreme marked the birth of a new bull market that would catapult gold 29.9% higher over the next 6.7 months! That same bull persists today.
In the 3.0 years since which includes this week’s 9th Fed rate hike of this cycle, gold is still up 18.1% and the US Dollar Index is down 2.1%. That’s no anomaly either. This is actually the Fed’s 12th rate-hike cycle since the early 1970s. During the exact spans of the prior 11, gold averaged strong gains of 26.9%! That was an order of magnitude higher than the stock markets’ 2.8% average gains per the flagship S&P 500.
Gold-futures speculators either don’t know market history or their extreme leverage forces them to run as a herd no matter how irrational that stampede is. They can’t afford to be wrong for long or risk suffering catastrophic losses. This week they apparently expected the FOMC to prove even more dovish on future rate hikes than it was. That led to volatile gold action surrounding this latest critical Fed decision on rates.
The FOMC meets 8 times per year, about every 6 weeks. But up until now, only every other meeting was accompanied by a Summary of Economic Projections and followed by the Fed chairman holding a press conference. That meant the Fed was only “live”, likely to hike rates, once a quarter at that every-other meeting. Incidentally Jerome Powell will start holding press conferences after every meeting starting in January.
That decision was made in mid-June, it had nothing to do with the recent stock-market volatility. Since the Fed doesn’t want to spook traders and ignite selloffs, rate hikes are well-telegraphed in advance. 3 weeks after each FOMC meeting, its full minutes are released. They are long and detailed, offering all kinds of clues about whether top Fed officials are thinking about hiking rates at the next FOMC meeting.
Market-implied Fed-rate-hike odds are always available through federal-funds futures trading. The big wildcard at each live FOMC meeting is a part of the SEP known as the “dot plot”. It collates where each individual top Fed official personally expects the federal funds rate to be in each of the next several years and beyond. It’s literally a bunch of dots plotted on a table, hence the name. It can really move gold futures.
Though Powell and other FOMC members stress the dot plot is not an official rate-hike forecast or outlook by the Fed, traders universally use it as such. A hawkish dot plot implies more future rate hikes than the previous one, and dovish less. Gold, currency, and stock-index futures speculators trade aggressively based on the quarterly changes in the dot plot. FOMC statements and press conferences also play roles.
At the FOMC’s previous meeting accompanied by a dot plot in late September, those forecasts implied top Fed officials expected this week’s rate hike, another 3 in 2019, and 1 final one in 2020. But market conditions were way different then. That decision came just 4 trading days after all-time record highs in the lofty euphoria-drenched U.S. stock markets. Top Fed officials are boldly hawkish when stocks look awesome.
In early October Powell doubled down on this hawkishness, saying in an evening speech that the federal-funds rate was “a long way from neutral at this point, probably” and that “We may go past neutral.” The very next day the stock markets started sliding and haven’t looked back since. By this Monday that selloff had gradually mushroomed into a moderate 13.1% correction in the S&P 500. Many blame it on Fed hawkishness.
Facing withering criticism led by president Trump himself, Powell tried to walk back his own many-more-rate-hikes-to-come outlook in late November after the S&P 500 had passed the 10% correction threshold. Powell said “Interest rates are still low by historical standards, and they remain just below the broad range of estimates of the level that would be neutral for the economy…” Stock selling was softening the Fed.
While traders fully expected the rate hike of this cycle Wednesday, they were sure the dot-plot outlook of future rate hikes would be far more dovish than late September’s 5 including this week’s. Gold rallied nicely in anticipation, climbing from $1214 before Powell’s second speech to $1249 the day before this latest FOMC meeting. In the hours before this new dot plot’s release, gold was bid to a new upleg high of $1261.
Market expectations were for just 1 rate hike in 2019 compared to the previous 3 implied, followed by an actual rate cut in 2020! That seemed excessive, so I figured top Fed officials would kill one of the hikes next year leaving 2 in 2019 and remove 2020’s lone hike as well. While this latest dot plot was indeed dovish as expected, it wasn’t dovish enough. 2019’s outlook shrunk to 2 more hikes, and 2020’s kept that final one.
So instead of going from 4 future hikes down to 1 or 2 as hoped, the dot plot only retreated from 4 to 3. Both dollar-futures and gold-futures speculators expected more dovishness, leading to moderate gold selling after the dot plot. Gold fell from $1251 just before its release to $1242 a couple hours later, and closed 0.6% lower on the day. Stock markets fared worse, the S&P 500 falling 1.5% to a new correction low!
But the impact of FOMC decisions usually takes a day or two to settle out. They are released at 2pm New York time when Asian and European markets are closed. So until foreign traders get their chances to react to the Fed, the market outcome isn’t known. Even American traders have to get past their initial kneejerk reactions, so the next trading day following the FOMC is crucial as actual implications sink in.
Gold was slowly bid heading into Thursday in Asian markets, heading back up near $1248 by the time Europe was opening. And then gold quickly surged to $1256, a new closing upleg high. In U.S. afternoon trading the day after this FOMC decision, gold surged as high as $1266! Top Fed officials’ future rate-hike outlook falling from 4 to 3 might not have been dovish enough, but it was still certainly dovish absolutely.
Seeing the Fed waver on future rate hikes in response to the mounting stock-market selloff this quarter is super-bullish for gold and its miners’ stocks going forward. Both gold-futures speculators and normal investors remain way under-deployed in gold, with vast room to buy. Odds are this week’s dovish FOMC will accelerate major gold and gold-stock uplegs. That’s happened after past Fed rate hikes in this cycle too.
This first chart superimposes gold prices over the total gold-futures long and short contracts speculators hold, which are rendered in green and red respectively. All 9 Fed rate hikes of this cycle are highlighted in blue. Gold has often surged strongly on gold-futures buying in recent years following FOMC rate-hiking decisions, or more precisely dot-plot changes in the future rate-hike outlook. Gold is set up to surge again.
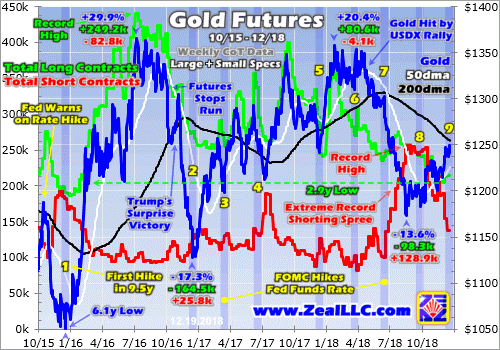
Again, this entire gold bull was born the day after the Fed’s first rate hike of this cycle, resulting in that big initial 29.9% gold upleg over 6.7 months in essentially H1’16. That left gold overbought so it started to correct like normal. But that was greatly exacerbated by Trump’s surprise election victory which ignited a monster stock-market rally on hopes for big tax cuts soon. Investors aggressively fled gold to chase stocks.
But gold bottomed in mid-December 2016 the day after this cycle’s second rate hike, and soon started surging sharply higher. Yet gold-futures speculators didn’t learn their lesson, and continued to dump gold heading into FOMC decisions with expected rate hikes. Gold rallied strongly immediately out of the 3rd, 5th, and 6th hikes of this cycle, and soon after the 4th and 8th. Rate hikes have definitely proven bullish for gold!
The 7th rate hike in mid-June 2018 was a major exception. Gold fell sharply in subsequent days as gold-futures speculators lapsed into a stunning extreme record orgy of short selling. Initially sparked by a U.S. dollar rally, that epic gold-futures shorting soon took on a life of its own driving total short contracts to their highest levels ever by far! That ultimately blasted gold to a deep and unsustainable 19.3-month low in mid-August.
Most of that shorting spree has been covered since, fueling most of gold’s young upleg since. But the long-side gold-futures speculators who control much more capital than short-side guys have barely started to buy. Short covering is legally mandated to repay the debts incurred by borrowing to short sell. But long buying is totally voluntary, speculators have to believe gold is heading higher to make leveraged bets on it.
At the end of November the day before Powell’s about-face on how far rates were from neutral, the total gold-futures longs held by speculators had crumbled to just 204.9k contracts. That was a serious 2.9-year low, levels last seen in late January 2016 just as this gold bull was starting to march higher. So gold-futures speculators are nearly as under-deployed in gold as they were near the end of its last secular bear!
That leaves vast room for them to buy to reestablish normal positions. Back in essentially the first half of 2016, speculators added 249.2k longs while covering 82.8k shorts to help catapult gold 30% higher. It’s amazing to see similar long-buying potential today, with speculators’ total longs running just 7% up into their past year’s trading range. We’re nearing the tipping point where short covering ignites far-bigger long buying.
Gold bull uplegs have 3 distinct stages that trigger and unfold in telescoping fashion. They all start out of major lows with that mandatory gold-futures short covering, the first stage. That eventually pushes gold high enough for long enough to entice long-side gold-futures speculators to return, the second stage. I suspect this week’s dovish FOMC meeting could prove the catalyst that ignites big stage-two gold buying.
This latest dot plot may not have been dovish enough for traders, but Fed dovishness will snowball with stock-market weakness. The lower the stock markets slide, whether or not Fed hawkishness is really to blame, the more pressure on the FOMC to slow or even stop its future-rate-hike tempo. Gold-futures speculators will crowd into gold to chase its upside momentum with their feared rate-hike boogeyman fading.
But all the stage-one and stage-two gold-futures buying that fuels young gold uplegs is just the prelude to far-larger stage-three investment buying. After gold’s upleg grows large enough and lasts long enough to spawn investor interest, their capital inflows soon dwarf anything the gold-futures speculators could ever manage. There’s also precedent in this cycle for Fed rate hikes soon leading to surging gold investment demand.
A great high-resolution proxy for gold investment-demand trends is the amount of physical gold bullion held in trust by the dominant GLD SPDR Gold Shares gold ETF. It effectively acts as a conduit for the vast pools of American stock-market capital to slosh into and out of gold. Just a couple weeks ago I wrote an essay on how GLD works and why it is critically important to gold prices, especially during stock selloffs.
This next chart looks at GLD’s holdings superimposed over the gold price, with all 9 Fed rate hikes of this cycle highlighted. While gold-futures trading usually dominates gold prices, it is still easily overpowered by material flows of American stock-market capital into or out of gold via GLD. Investors have started to return to gold again on the stock-market selloff, and this prudent reallocation should accelerate on Fed dovishness.
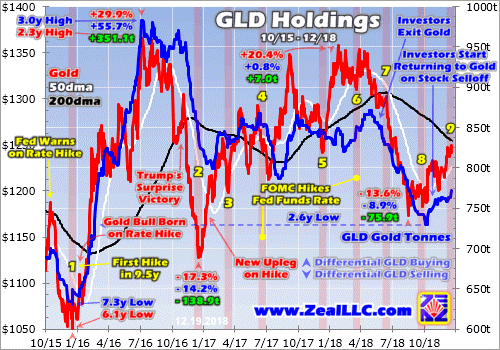
The last time American stock investors were worried enough about stock-market selloffs to redeploy into gold for refuge was that first half of 2016. Since gold is a rare counter-moving asset that tends to rally as stock markets weaken, investment demand soars when the S&P 500 slides long enough to ignite serious concerns. We’re certainly getting to that point again, as worries are mounting about this latest major selloff.
Gold went from being left for dead in mid-December 2015 to surging 29.9% higher in just 6.7 months solely on American stock investors returning! This is no generalization, the hard numbers prove it without a doubt. The world’s best gold fundamental supply-and-demand data comes from the venerable World Gold Council. It releases fantastic quarterly reports detailing the global buying and selling happening in gold.
Gold blasted higher on stock weakness in Q1’16 and Q2’16. According to the latest data from the WGC, total world gold demand climbed 188.1 and 123.5 metric tons year-over-year in those key quarters. That was up 17.1% and 13.2% YoY respectively! But the real stunner is exactly where those major demand boosts came from. It wasn’t from jewelry buying, central-bank buying, or even physical bar-and-coin investment.
In Q1’16 and Q2’16, GLD’s holdings alone soared 176.9t and 130.8t higher on American stock investors redeploying into gold after back-to-back S&P 500 corrections. Incredibly this one leading gold ETF accounted for a staggering 94% of overall global gold demand growth in Q1’16 and 106% in Q2’16! So there’s no doubt without American stock investors fleeing into gold via GLD this gold bull never would’ve been born.
Gold was holding those sharp gains throughout 2016 until Trump’s surprise presidential victory unleashed a monster stock-market run on hopes for big tax cuts soon. Gold was pummeled in Q4’16 as American stock investors pulled capital back out to chase the newly-soaring S&P 500. That quarter total global gold demand per the WGC fell 103.4t YoY or 9.0%. GLD’s 125.8t Q4’16 holdings draw accounted for 122% of that!
Fast-forward to summer 2018, and investors again started shifting out of gold to chase euphoric U.S. stock markets nearing new record highs. That forced GLD’s holdings to a deep 2.6-year low, investors hadn’t been so underinvested in gold since early in this bull market when they started flooding back in helping to catapult gold sharply higher. That gives them massive room to buy back in since their allocations are so low.
This mass exodus of American stock-market capital out of gold via GLD ended in mid-October the exact day the S&P 500 started plunging in what’s grown into this newest correction-grade selloff! Ever since GLD’s holdings have continued recovering on more capital inflows, helping to drive gold higher. This trend should only accelerate as stage-two gold-futures long buying on Fed dovishness further lifts gold prices.
Investors are often as momentum-driven as futures speculators, but over much-longer time horizons. So as this young gold upleg grows, gold is going to look much more attractive to them. Their desire to chase its upside performance is really intensified by material stock-market weakness. That makes gold stand out as not just a safe-haven capital-preservation hedge, but a way to grow wealth while everything else burns.
And as goes gold, so go the stocks of its miners. Last week I wrote a whole essay detailing the imminent major upside triple breakout in gold stocks likely to be triggered by a dovish FOMC. That indeed started to happen this week before the Fed, as this updated GDX chart shows! The GDX VanEck Vectors Gold Miners ETF is the leading gold-stock investment vehicle and benchmark, and remains poised for massive gains.
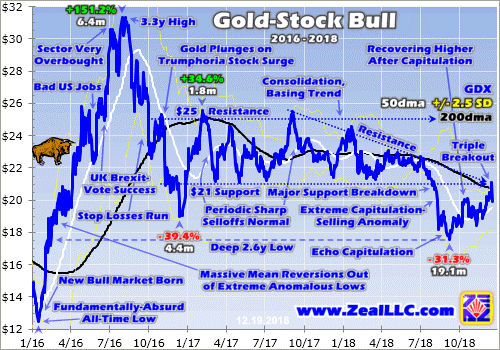
Three major resistance zones have converged at GDX $21. They include its 200-day moving average, past-year descending-triangle overhead resistance, and the old consolidation basing trend’s support. In anticipation of a gold rally on a dovish Fed, GDX closed above $21 on Tuesday. And in the hours before that FOMC decision Wednesday, it hit $21.47 intraday which was very-bullish decisive-breakout territory.
But when futures speculators bid the U.S. dollar higher and pushed gold lower on this latest dot-plot rate-hike outlook not being dovish enough, the gold stocks reversed hard. GDX plummeted a staggering 7.3% intraday across that FOMC decision! It closed 5.4% lower, making for absurd 9.0x downside leverage to gold’s small 0.6% Fed Day loss. That was a wildly-irrational downside anomaly that never should’ve happened.
In trying to figure out why after Wednesday’s close, I waded through dozens of gold stocks to see if there was some adverse news besides a not-dovish-enough FOMC. There was nothing. But provocatively in after-hours trading soon after the U.S. stock-market close, many if not most of the gold stocks had already regained 2/3rds to 3/4ths of that day’s crazy losses! So traders realized that kneejerk selloff wasn’t righteous.
Indeed right out of the gates Thursday GDX surged 4.1% higher erasing over 7/10ths of the extreme Fed Day losses. Remember market reactions to FOMC decisions usually aren’t fully apparent until the entire next trading day, after the implications have sunk in and overseas traders have reacted. Gold stocks’ major-upside-breakout thesis portending a powerful new upleg remains intact, the Fed likely accelerated it.
The beaten-down gold miners’ stocks remain the last cheap sector in the entire stock markets, a coiled spring ready to soar as gold returns to favor. The more shorts covered and longs bought by gold-futures speculators, and the more capital investors allocate back into gold, the greater the upside the gold miners’ stocks have as gold powers higher. Their potential gains are enormous, dwarfing anything else in 2019.
Again the last time major stock-market weakness rekindled gold investment demand was essentially the first half of 2016, when gold powered 29.9% higher. That drove a parallel monster 151.2% gold-stock upleg per GDX, making for huge 5.1x upside leverage. The gains in major gold stocks generally amplify gold upside by 2x to 3x, and smaller mid-tier miners with superior fundamentals tend to do much better than that.
The key to riding any gold-stock bull to multiplying your fortune is staying informed, both about broader markets and individual stocks. That’s long been our specialty at Zeal. My decades of experience both intensely studying the markets and actively trading them as a contrarian is priceless and impossible to replicate. I share my vast experience, knowledge, wisdom, and ongoing research through our popular newsletters.
Published weekly and monthly, they explain what’s going on in the markets, why, and how to trade them with specific stocks. They are a great way to stay abreast, easy to read and affordable. Walking the contrarian walk is very profitable. As of Q3, we’ve recommended and realized 1045 newsletter stock trades since 2001. Their average annualized realized gains including all losers is +17.7%! That’s double the long-term stock-market average. Subscribe today and take advantage of our 20%-off holidays sale!
The bottom line is this week’s FOMC decision is very bullish for gold and its miners’ stocks going forward. While only seeing 1 of 3 projected 2019 rate hikes axed wasn’t considered dovish enough, it still showed the Fed’s hawkish resolve is cracking. That dovishness will mount the longer stock markets remain weak, further shortening and shrinking this rate-hike cycle. That green lights capital returning to gold in a big way.
There is massive room to buy back in, with both speculators’ gold-futures longs and stock investors’ gold held via GLD just modestly above major multi-year lows. Dovish Fedspeak, weaker stock markets, and higher gold prices will really motivate them to reestablish normal gold positions and portfolio allocations. The gold miners’ stocks will be the major beneficiaries of higher gold prices, nicely leveraging gold’s gains.
Adam Hamilton, CPA
December 21, 2018
Copyright 2000 – 2018 Zeal LLC (www.ZealLLC.com)
If you would like to receive our free newsletter via email, simply enter your email address below & click subscribe.
 Follow us on Twitter
 Become our facebook fan
CONNECT WITH US
Tweets
Tweet with hash tag #miningfeeds or @miningfeeds and your tweets will be displayed across this site.
MOST ACTIVE MINING STOCKS
Daily Gainers
 CMC Metals Ltd. CMC Metals Ltd. |
CMB.V | +900.00% |
 Eden Energy Ltd Eden Energy Ltd |
EDE.AX | +200.00% |
| GoviEx Uranium Inc. |
GXU.V | +42.86% |
| Eagle Nickel Ltd. |
ENL.AX | +41.67% |
| Citigold Corp. Limited |
CTO.AX | +33.33% |
| Mount Burgess Mining NL |
MTB.AX | +33.33% |
| Exalt Resources Limited |
ERD.AX | +31.94% |
| Casa Minerals Inc. |
CASA.V | +30.00% |
| Cariboo Rose Resources Ltd |
CRB.V | +28.57% |
| Belmont Resources Inc. |
BEA.V | +28.57% |


