Everyone has different reasons for investing or speculating in the resource sector. I believe, for the majority of the participants, it’s the allure of 10 baggers that attract them to the juniors.
While the appeal to windfall profits is attractive to almost anyone, I believe it’s exactly this mindset that keeps many investors from actually realizing the gains they are given in the market.
Too many times, I have spoken to fellow investors who haven’t taken money off the table when it’s there, and are left holding the bag until the market turns or the company successfully answers the next unanswered question.
First, if you are an investor who can stomach the ebb and flow of the market then taking a long-term position in juniors can work. Secondly, and key to the first point, it can only work if you are right about the junior company in which you are invested. Will they continue to get ‘yes’ answers as they pursue the development of their mineral deposit?
The juniors draw much of the attention in the resource market, however, I think that there are larger companies that have big upside potential, pay a dividend, and are actual investment-grade companies.
Let’s take a look at one of them!
Altius Minerals Corporation
I’m very bullish on both precious and base metals moving forward. However, the pragmatist in me is especially drawn to the base metals, as their value proposition in today’s society is so easily understood.
Today, I have for you an interview with Chad Wells, VP of Corporate Development of Altius Minerals Corporation (ALS:TSX). Altius is the sector’s only diversified base metal royalty and project generation company.
Currently, Altius has 15 producing royalties in copper, zinc, nickel, potash, iron, thermal and metallurgical coal. In addition, the project generation side of their business has drastically grown in overall equity value since 2016, moving from roughly $22 million to $68 million at September 30.
There are 54 new projects since Q1 2016 within Altius’ project generator portfolio and these will not only be the source of cash through equity sales in the future, but more importantly, will be the source of new cash flow by way of the royalties that are associated with most of the projects in their portfolio.
In my opinion, Altius is the best example of intellectual capital and how people are, by far, the most important commodity in any business.
As Wells mentions in our conversation,
“We’re a group that sticks to our guns, and believes in our own reasoning and rationale. At the end of the day, it’s about relying upon your own technical expertise and surrounding yourself with the right people that are willing to give you the right opinion that is unbiased, genuine and legit.”
I have long been an Altius shareholder and, in my opinion, would say that if I could only own one company in the sector, it would be Altius Minerals, hands down.
Altius Minerals (ALS:TSX)
MCAP – $556 M (at the time of writing)
Shares – 43.0 million
Annual Dividend – $0.16 / share
Outstanding Debt – $120 million
Cash and Public Equity Holdings – $180 million ($33.8 million cash)
2018 Royalty Revenue Guidance – $64M to $69M
Brian: In my conversation with Brian (referring to CEO Brian Dalton) last November, he was super bullish on iron ore and, over the course of the year, Altius has taken big steps to capitalize on the iron ore market. First in March, by increasing your position in Alderon Iron Ore and, most recently in Q3, increasing your position in Labrador Iron Ore Royalty Corporation.
Can you please explain the opportunity you see in the iron ore market?
Chad: We’ve been a mainstay player in the Labrador Trough since 2004 and 2005. Originally, it was from an exploration perspective where we generated projects and sold them on to third parties. Alderon Iron Ore was created during that time, as a part of that strategy, and lead to us becoming very intimate with the iron markets. The Labrador Trough iron ore fits a niche portion of the global marketplace.
Brian (referring to Altius CEO Brian Dalton) has an innate ability to see around corners so he’s been predicting a bifurcation happening in the broader iron ore market this past few years for high grade iron ore with low impurities, compared to the lower grade, higher impurity stock coming out of the Pilbara. A lot of it’s being driven by Chinese pollution standards and emissions targets through their steel mills. You’ve seen the Chinese cut significant volumes of steel production last year because mills were burning lower purity met coal and iron ore.
That’s led to a premium for the high grade, low impurity products. While the quoted price for iron ore, let’s say is at $70 per ton, the high grade Trough products are getting better than $100 per ton, while low grade is trading at a discount.
Brian recognized the separation that was coming in the market between high and low grade long before the broader market did. For us, it spawned an investment thesis to buy a substantial share position in Labrador Iron Ore Royalty Company (LIORC) mainly accumulated with the Fairfax preferred money starting in early 2017. LIORC has a 7% gross revenue royalty on Iron Ore Company of Canada’s (IOC) Carol Lake operations, as well as a 15% equity stake. LIORC is a passive type issuer, taking the money that they get from the royalty and then dividending most of it straight to shareholders.
For us it was the opportunity to have exposure to a royalty on a premier iron asset in Labrador, at a time when we thought the market was going to start to take recognition of that.
Over the last year, we increased our Labrador Iron Ore Royalty Corporation holdings substantially. If you look at our average price, which was around $17 a share before we bought the most recent addition of another .4%, LIORC stock traded last week as high as $31. At the same time, the yield of the dividends that we’ve realized off the asset are quite pronounced. And of course, we treat it as royalty income, effectively, in our per annum royalty revenue. So it fills out some of that diversified commodity exposure. So it’s been really good.
Alderon was much more strategic. We were a founder, having discovered the underlying Kami deposit way back in 2005-06. Our recent doubling up, if you will, on Alderon, goes back to this bifurcation in the iron ore market thesis, which we believe is a real thing and that’s going to last. It’s also worth mentioning that we bought the additional $5 million stake from Liberty when we agreed to a friendly transaction buying out the balance of the potash royalties that we’d held together in a JV.
With that comes the reality that you’re playing Carol Lake, through LIORC. Also, we have a convertible debenture with Champion Iron. Champion is the company that bought the Bloom Lake assets for $10 million in cash plus assumed liabilities of around $43 million from Cliffs, who had sunk nearly US$3 billion of capital into the project during the last iron bull.
The way we see things playing out in the Trough, we believe IOC brings a lot of transparency and reality to the broader marketplace, of the niche, that Labrador iron fits. We think that spills over into Champion, which is a very high margin operation right now, but is flying under the radar. We think the market will take credence and recognition there.
And as this market continues to want more high grade, low impurity iron ore, the next shovel ready project in that district is Kami. For us to buy that stake, on favourable terms, in Alderon from Liberty, brings us back to being that major shareholder with a big stick , it makes a lot of sense for us strategically.
If you reflect back to the last cycle, it was the asset that would have tore the lid off the can for Altius as a royalty generative business. The thing that most of the marketplace doesn’t realize today is that Altius is a different type of royalty company. It’s not a Franco or a Wheaton, who grows through acquisition. We actually grow our royalty portfolio organically and Alderon is one example of that.
In the past bull market in iron, around 2011, when we thought that Kami was going to get built, Alderon raised a bunch of money with the Chinese partner, Hebei Group. It almost got through the window in the sense of raising the capital to build a new mine. If that had to have happened, not only would we made a couple hundred million on the equity, but we would have had an underlying royalty on that asset at 3% gross royalty that based on the feasibility numbers of the assessment at the time, it would have generated about $25 million per year of royalty revenue for Altius for 20+ years. The reason it didn’t happen is because the iron ore bull market ended so quickly when prices dropped from around $130 per tonne to levels less than half that. If you add the premiums to the current spot, we’re edging closer to $100+ again.
Alderon is an extraordinary opportunity of optionality and because of what’s happened in the bigger iron ore market and because of the strategic significance of Labrador iron product in general, I think it happens this cycle.
Kami still needs a billion dollars in capital to get it done, but consider what’s going on with Rio Tinto and IOC and the rumors of them IPO-ing their IOC stake, and, again, the success of Champion in restarting Bloom, and it seems a reasonable bet that Alderon will raise the capital this time around. It might get built. If it does, it will differentiate Altius from all of the others because the net asset value just from the royalty aspect that gets created from nothing, is profound.
Brian: That leads into my next question, generally speaking, in your opinion, how difficult is it to raise $1 billion to develop a mine, today?
Chad: Very difficult and, in saying that, today’s market is probably not the one to do it in. Will that market come? Of course it will. One thing that’s going to be very apparent in what I’ll call the pending bull cycle in commodities, is that the story is going to be about supply this time around, not demand.
What we’ve seen happen is the world has not developed enough copper, nickel and high grade iron ore mines to sustain just the static needs of society. So ultimately, it’s going to be a supply crunch and there’s just not going to be enough supply out there.
So that will incentivize commodity pricing, and incentivize capital, and more mines will get built. So will it happen? It will. The iron ore business is a bit different, because there is a lot of iron ore that came on through the last cycle through investment. But most of it is in this low grade or medium grade stuff. So it doesn’t have the strategic niche of this high grade, low impurity ore, which quite frankly, the Chinese need.
So is the capital there today? Probably not. Will it come? It will. Also, I’d say you don’t necessarily have to think that these things are going to be built by the market. There’s a lot of diversified miners out there that have good balance sheets, have made a lot of money here in the last few years, again, and are going to be looking for shovel-ready assets to acquire to develop themselves. Maybe some of these things get built in different ways, not necessarily going to be through the capital market conventions of a bull market, if you will.
Brian: Earlier this year, Altius entered the lithium market with the investment in a closed end limited partnership with Lithium Royalties Corporation. The deal gives Altius the rights to buy up to 10% of selected royalty direct investments.
Generally speaking, what criteria is Altius looking for in terms of the ideal investment in the lithium space? For example, does the lithium deposit type or jurisdiction matter?
Chad: We’ve always been a group that has focused on exploration and investment in bread and butter commodities, which lithium would not fit. We’ve seen a lot of these specialty themes over the years and we haven’t invested in them because their supply and demand fundamentals have been so wonky that we just weren’t comfortable with the volatility.
In the case of lithium and the battery metal craze in general, I’d say we missed it with lithium. We didn’t necessarily believe that it was going to be one of these bread and butter commodities. I think we’ve come to realize that it is something that we should have spent more time investing in earlier through our exploration business, but we didn’t. Because regardless of how much we try to minimize the forecasts of different battery chemistries in the EV build-out scenario, you just can’t ignore lithium. And the big correction in the pricing this year gives us a more comfortable entry point to be buying when prices are not so near the top. So it is a bit of a catch up game.
What we did do this year is we partnered with expertise. The guys at Lithium Royalty Corp., especially Ernie Ortiz, the CEO of that ship, he’s a specialist in the lithium world. He’s been an authority in lithium for many years starting as one of the first sell side analysts to take apart the EV forecasts as the story was unfolding for the future demand of lithium.
So, again, what Altius decided, in this case, is to partner with some really smart people who had the groundwork laid and had the best-in-class assets sized up and deals templated. We are investing basically side by side with them through an equity position into that company and our royalty co-vestment rights are pro rata with our equity ownership. But we can pick and choose which ones we actually fund – we don’t have to participate in every one of them, and in fact, haven’t participated in every one so far.It is a different way for us to do it, as typically we’ve always been the front men running our own ship, whether it’s a particular jurisdiction or a particular commodity or a particular idea. In this case, we weren’t the first men running, so we partnered with the first man running.
Brian: Warren Buffett is famous for saying, “You must learn from mistakes, but they don’t have to be your own.” I was wondering if you could parlay that into the 20-year history of Altius.
Are there any lessons in particular that stand out to you?
Chad: Absolutely. It’s all lessons. I’ll focus on my side of the business, exploration and project generation. In the last bull cycle, we made $200 million plus through our project generation efforts. How did we do that?
We took geological real estate that we had generated with boot and hammer prospecting and came up with big context and big ideas. Then, we effectively sold it on to a third party. In the case of where we made the money selling on to a third party, it was a market participant. What we did is we exchanged geological real estate which is generally illiquid for shares in a fairly liquid company on a stock exchange, versus up until that point in time, let’s say the first 10 years of Altius, we spent a lot of our time doing exploration deals with major miners.
Though that gave us a lot of technical credibility in the product that we generated and we were able to attract those third party endorsements, it was an illiquid business. What I mean is that even though you did a deal, you weren’t able to monetize your minority residual stake in the assets.
So the big learning experiment that we had when we look back at the last bull cycle is related to the way that we made money, it was actually trading geological real estate for shares. So when we enter this bull cycle, I don’t know that I’d call it a bull cycle yet, the phone started to ring. All of a sudden, here we were as an exploration group, we had assembled projects in nine jurisdictions globally from 2012 to 2016, when nobody gave a crap about the mining resources business, and certainly weren’t doing exploration. We were able to waltz into world-class jurisdictions, build meaningful land positions, generated a lot of geological real estate, and basically we sat on it and waited for the market to turn.
Since that time, we’ve sold 54 (working on 57!) projects and 17 different agreements in less than 24 months. It’s been extraordinary. I didn’t think it could get so good for us. Every deal we’ve done, except for one that we haven’t announced yet, is that we took our geological real estate, we’d trade it for shares in a third party junior company, or in special circumstances, we even facilitated the IPO of new entities.
Where at the same time, though, where did we end up? We ended up with a big share position in a company that now held the assets that we generated, while at the same time we retained blanket royalties to the underlying projects. Long term sewed up in terms of the mining operations, we get kicked back on our royalties, while at the same time, we’re so early into the cycle we’re effectively getting seed stock in juniors that go to explore our projects.
So these positions expose us to discovery opportunity off of our balance sheet, on somebody else’s balance sheet, at the seed level. It’s beautiful! So if you look at our juniors portfolio today, we’re sitting on 27 juniors with a value of about $65 million at the end of September.
I can’t make a promise, but I’ll say to you I have extraordinary belief that that $65 million will be worth the market capitalization value of the entirety of Altius, roughly $600 million, through the cycle.
We’re seeded up on the right deals, at the right time, in the right commodities and right projects that those things are going to deliver value.
It’s a cyclical business, you need to be able to, to some degree, trade those cycles. We’ve been able to create fundamentally long-term royalties that punch through the cycles, that we can realize on over 10, 20, 30 year increments. At the same time, we’re getting seeded up on equity that we can monetize and put a big surplus of cash into the bank, so when the market rolls over again, we can put it to work.
So, really, it was about realizing it’s all about liquidity and timing.
Brian: That’s a great answer.
The ramifications of confirmation bias should be a major concern for all investors, as human nature dictates that we love to reaffirm our beliefs with confirming evidence. As a manager, the same concern can be said for “yes” men; people who continually support the boss regardless of whether they think they are right.
Personally, in my career as a manager in steel manufacturing, I quickly learned how important it was to surround myself with people who weren’t afraid to tell me what they thought about the projects that were being proposed or the direction that I wanted to take.
In your experience, how important is it to find or listen to disconfirming information?
Chad: The resources sector more than in any other, you shouldn’t run with the herd. You have to go against it. The reality is that this business in general – exploring, mine development, mine construction, mine production – is extremely tough and tedious.
Additionally, you’ve got to realize that there’s a lot of different tiers and categories of humans that benefit from a story advancing versus not advancing. So, a lot of times, you’re always encouraged to keep spending and spending and spending, because to some degree it’s the mentality to keep things going.
We don’t get into that type of philosophy. We’re a group that sticks to our guns, and believes in our own reasoning and rational. At the end of the day, it’s about relying upon your own technical expertise and surrounding yourself with the right people that are willing to give you the right opinion that is unbiased, genuine and legit.
The resource sector is like no other, it is feast or famine, it’s a herd mentality. To succeed you have to genuinely and truly be a contrarian. You have to be a no man versus a yes man.
Concluding Remarks
Altius Minerals is the cornerstone of my personal portfolio and will remain that way for the foreseeable future. In Altius, I see minimal downside risk outside of a broader market crash, which, in reality, would negatively affect just about every company’s share price.
Further, the upside potential from their project generation business looks very promising. First, looking at their development stage royalties projects: Excelsior Mining’s Gunnison copper project, Alderon Iron Ore’s Kami project or Evrim’s Cuale project, there is a lot of potential cash flow that could be soon flowing in Altius’ direction.
On the exploration side of their equity portfolio, you have Adventus Zinc Corporation (ADZN:TSXV), Aethon Minerals (AET:TSXV), Antler Gold (ANTL:TSXV), and Sokomon Iron (SIC:TSXV) to name just a few. Additionally, you have their latest spin out, Adia Resources, which is partnered with De Beers in the exploration for diamonds in Manitoba.
There are no guarantees in life, however, I believe that if you look at the short and long-term prospects of Altius, I think you will agree that they look tremendously bright.
Don’t want to miss a new investment idea, interview or financial product review? Become a Junior Stock Review VIP now – it’s FREE!
Until next time,
Brian Leni P.Eng
Founder – Junior Stock Review
Disclaimer: The following is not an investment recommendation, it is an investment idea. I am not a certified investment professional, nor do I know you and your individual investment needs. Please perform your own due diligence to decide whether this is a company and sector that is best suited for your personal investment criteria. I do own shares in Altius Minerals, Adventus Zinc Corporation, Aethon Minerals, and LIORC. All Altius Minerals analytics were taken from their website and press releases. I have NO business relationship with Altius Minerals or any of the other companies mentioned in this article.
The major silver miners’ stocks have been largely abandoned this year, spiraling to brutal multi-year lows. Such miserable technicals have exacerbated the extreme bearishness plaguing this tiny contrarian sector. While profitable silver mining is challenging at today’s exceedingly-low silver prices, these miners are chugging along. Their recently-reported Q3’18 results show their earnings are ready to soar as silver recovers.
Four times a year publicly-traded companies release treasure troves of valuable information in the form of quarterly reports. Companies trading in the States are required to file 10-Qs with the US Securities and Exchange Commission by 40 calendar days after quarter-ends. Canadian companies have similar requirements at 45 days. In other countries with half-year reporting, many companies still partially report quarterly.
Unfortunately the universe of major silver miners to analyze and invest in is pretty small. Silver mining is a tough business both geologically and economically. Primary silver deposits, those with enough silver to generate over half their revenues when mined, are quite rare. Most of the world’s silver ore formed alongside base metals or gold. Their value usually well outweighs silver’s, relegating it to byproduct status.
The Silver Institute has long been the authority on world silver supply-and-demand trends. It published its latest annual World Silver Survey covering 2017 in mid-April. Last year only 28% of the silver mined around the globe came from primary silver mines! 36% came from primary lead/zinc mines, 23% copper, and 12% gold. That’s nothing new, the silver miners have long produced less than a third of world mined supply.
It’s very challenging to find and develop the scarce silver-heavy deposits supporting primary silver mines. And it’s even harder forging them into primary-silver-mining businesses. Since silver isn’t very valuable, most silver miners need multiple mines in order to generate sufficient cash flows. Traditional major silver miners are increasingly diversifying into gold production at silver’s expense, chasing its superior economics.
So there aren’t many major silver miners left out there, and their purity is shrinking. The definitive list of these companies to analyze comes from the most-popular silver-stock investment vehicle, the SIL Global X Silver Miners ETF. In mid-November at the end of Q3’s earnings season, SIL’s net assets were running 6.6x greater than its next-largest competitor’s. So SIL continues to dominate this tiny niche contrarian sector.
While SIL has its flaws, it’s the closest thing we have to a silver-stock index. As ETF investing continues to eclipse individual-stock picking, SIL inclusion is very important for silver miners. It grants them better access to the vast pools of stock-market capital. Differential SIL-share buying by investors requires this ETF’s managers to buy more shares in its underlying component companies, bidding their stock prices higher.
In mid-November as the silver miners were finishing reporting their Q3’18 results, SIL included 23 “Silver Miners”. Unfortunately the great majority aren’t primary silver miners, most generate well under half their revenues from silver. That’s not necessarily an indictment against SIL’s stock picking, but a reflection of the state of this industry. There aren’t enough significant primary silver miners left to fully flesh out an ETF.
This disappointing reality makes SIL somewhat problematic. The only reason investors would buy SIL is they want silver-stock exposure. But if SIL’s underlying component companies generate just over a third of their sales from silver mining, they aren’t going to be very responsive to silver price moves. And most of that ETF capital intended to go into primary silver miners is instead diverted into byproduct silver miners.
So silver-mining ETFs sucking in capital investors thought they were allocating to real primary silver miners effectively starves them. Their stock prices aren’t bid high enough to attract in more investors, so they can’t issue sufficient new shares to finance big silver-mining expansions. This is exacerbating the silver-as-a-byproduct trend. Only sustained much-higher silver prices for years to come could reverse this.
Silver miners’ woes are really exacerbated by silver’s worst performance in decades. In mid-November silver sunk to a 2.8-year low of $13.99. That naturally dragged down SIL to a similar 2.7-year low. But relative to gold which usually drives it, silver was faring far worse. The Silver/Gold Ratiosunk to 85.9x in mid-November, meaning it took almost 86 ounces of silver to equal the value of a single ounce of gold.
The SGR hadn’t been lower, or silver hadn’t been more undervalued relative to gold, since all the way back in March 1995! That’s pretty much forever from a markets perspective. With silver languishing at an exceedingly-extreme 23.7-year low relative to gold, it’s hard to imagine it doing much worse. So the silver miners are weathering one of the toughest environments they’ve ever seen, which we have to keep in mind.
Every quarter I dig into the latest results from the major silver miners of SIL to get a better understanding of how they and this industry are faring fundamentally. I feed a bunch of data into a big spreadsheet, some of which made it into the table below. It includes key data for the top 17 SIL component companies, an arbitrary number that fits in this table. That’s a commanding sample at 96.9% of SIL’s total weighting!
While most of these top 17 SIL components had reported on Q3’18 by mid-November, not all had. Some of these major silver miners trade in the UK or Mexico, where financial results are only required in half-year increments. If a field is left blank in this table, it means that data wasn’t available by the end of Q3’s earnings season. Some of SIL’s components also report in gold-centric terms, excluding silver-specific data.
The first couple columns of this table show each SIL component’s symbol and weighting within this ETF as of mid-November. While most of these stocks trade on US exchanges, some symbols are listings from companies’ primary foreign stock exchanges. That’s followed by each miner’s Q3’18 silver production in ounces, along with its absolute year-over-year change. Next comes this same quarter’s gold production.
Nearly all the major silver miners in SIL also produce significant-to-large amounts of gold! That’s truly a double-edged sword. While gold really stabilizes and boosts silver miners’ cash flows, it also retards their stocks’ sensitivity to silver itself. So the next column reveals how pure these elite silver miners are, approximating their percentages of Q3’18 revenues actually derived from silver. This is calculated two ways.
The large majority of these top SIL silver miners reported total Q3 revenues. Quarterly silver production multiplied by silver’s average price in Q3 can be divided by these sales to yield an accurate relative-purity gauge. When Q3 sales weren’t reported, I estimated them by adding silver sales to gold sales based on their production and average quarterly prices. But that’s less optimal, as it ignores any base-metals byproducts.
Next comes the major silver miners’ most-important fundamental data for investors, cash costs and all-in sustaining costs per ounce mined. The latter directly drives profitability which ultimately determines stock prices. These key costs are also followed by YoY changes. Last but not least the annual changes are shown in operating cash flows generated and hard GAAP earnings, with a couple exceptions necessary.
Percentage changes aren’t relevant or meaningful if data shifted from positive to negative or vice versa, or if derived from two negative numbers. So in those cases I included raw underlying data rather than weird or misleading percentage changes. This whole dataset together offers a fantastic high-level read on how the major silver miners are faring fundamentally as an industry. They are hanging in there quite well.
Production is naturally the lifeblood of the silver-mining sector. The more silver and increasingly gold that these elite miners can wrest from the bowels of the earth, the stronger their fundamental positions and outlooks. These top 17 SIL miners’ overall silver production slipped 2.2% YoY to 75.5m ounces in Q3’18. But their shift into more-profitable gold mining continued, with aggregate production up 1.6% YoY to 1.4m ounces.
According to the Silver Institute’s latest WSS, total world silver mine production averaged 213.0m ounces per quarter in 2017. So at 75.5m in Q3, these top 17 SIL components were responsible for 35.4% of that rate. There is one unusual situation that slightly skewed this result. SSR Mining, which used to be known as Silver Standard Resources, saw its silver production plummet 57% YoY as its lone silver mine is depleting.
The winding down of SSRM’s old Pirquitas silver mine is proceeding as forecast and has been going on for some time. This once major silver miner is morphing into a primary gold miner, which accounted for a record 94% of its revenue in Q3. Excluding SSRM, the rest of these top SIL silver miners saw their silver production retreat an immaterial 1.3% YoY. That’s pretty impressive given this year’s collapse in silver prices.
Q3’s average silver price was just $14.96, down a major 11.2% YoY. That was far-worse performance than gold, with its quarterly average merely sliding 5.3% lower between Q3’17 to Q3’18. Considering how miserable this silver-price environment is with the worst relative performance to gold in decades, the major silver miners are doing well on production. They continue to hold out for silver mean reverting higher.
Silver is likely so down in the dumps because it effectively acts like a gold sentiment gauge. Generally big silver uplegs only happen after gold has rallied long enough and high enough to convince traders its gains are sustainable. Then the way-smaller silver market tends to start leveraging and amplifying gold’s moves by 2x to 3x. But gold sentiment was so insipid over this past year that no excitement was sparked for silver.
Unfortunately at these bombed-out silver prices the economics of silver mining are way inferior to gold mining. The traditional major silver miners are painfully aware of this, and have spent years actively diversifying into gold. In Q3’18, the average percentage of revenues that these top 17 SIL miners derived from silver was just 36.9%. That’s right in line with the prior 4 quarters’ 39.3%, 35.3%, 36.8%, and 36.3%.
Silver mining is every bit as capital-intensive as gold mining, requiring similar large expenses for planning, permitting, and constructing mines and mills. It needs similar heavy excavators and haul trucks to dig and move the silver-bearing ore. Similar levels of employees are necessary to run these mines. But silver generates much lower cash flows due to its lower price. Consider hypothetical mid-sized silver and gold mines.
They might produce 10m and 300k ounces annually. At last quarter’s average prices, these silver and gold mines would yield $150m and $363m of yearly sales. Thus regrettably it is far easier to pay the bills mining gold these days. So primary silver miners are increasingly becoming a dying breed, which is sad. The traditional major silver miners are adapting by ramping their gold production often at silver’s expense.
With major silver miners so rare, SIL’s managers are really struggling to find components for their leading ETF. So in Q3’17 they added Korea Zinc, which is now SIL’s largest component at over 1/7th of its total weighting. In my decades of studying and trading this tiny sector, I’d never heard of it. So I looked into Korea Zinc and found it was merely a smelter, not even a miner. It really needs to be kicked out of SIL.
Every quarter since I’ve tried to dig up information on Korea Zinc, but its English-language disclosures are literally the worst I’ve ever seen for any company. Its homepage gives an idea of what to expect, declaring “We are Korea Zinc, the world’s one of the best smelting company”. I’ve looked and looked and the latest production data I can find in English remains 2015’s. I can’t find it from third-party sources either.
That year Korea Zinc “produced” 63.3m ozs of silver, which averages to 15.8m quarterly. That is largely a byproduct from its main businesses of smelting zinc, lead, copper, and gold. Korea Zinc certainly isn’t a major silver miner, and has no place in a “Silver Miners ETF”. No silver-stock investor wants to own a base-metals smelter! Korea Zinc should be removed, its overweighting reallocated to the rest of SIL’s holdings.
SIL investors ought to contact Global X to ask them to stop tainting their ETF’s utility and desirability with Korea Zinc. If they want it to be successful and grow, they need to stick with their mission of owning the major silver miners exclusively. Silver-stock exposure is the only reason investors would buy SIL. There is another situation investors need to be aware of with Tahoe Resources and its held-hostage Escobal mine.
Tahoe was originally spun off by Goldcorp to develop the incredible high-grade Escobal silver mine in Guatemala, which went live in Q4’13. Everything went well for its first few years. By Q1’17, Escobal was a well-oiled machine producing 5700k ounces of silver. That provided 1000+ great high-paying jobs to locals and contributed big taxes to Guatemala’s economy. Escobal was a great economic boon for this country.
But a radical group of anti-mining activists managed to spoil everything, cruelly casting their fellow countrymen out of work. They filed a frivolous and baseless lawsuit against Guatemala’s Ministry of Energy and Mines, Tahoe wasn’t even the target! It alleged this regulator hadn’t sufficiently consulted with the indigenous Xinca people before granting Escobal’s permits. They don’t even live around this mine site.
Only in a third-world country plagued with rampant government corruption would a regulator apparently not holding enough meetings be a company’s problem. Instead of resolving this, a high Guatemalan court inexplicably actually suspended Escobal’s mining license in early Q3’17! Tahoe was forced to temporarily mothball its crown-jewel silver mine, and thus eventually lay off its Guatemalan employees.
That license was technically reinstated a couple months later, but the activists appealed to a higher court. It required the regulator to study the indigenous people in surrounding areas and report back, and then needs to make a decision. The government also needs to clear out an illegal roadblock to the mine site by violent anti-mine militants, who have blockaded Escobal supplies and physically attacked trucks and drivers!
So Escobal has been dead in the water with zero production for 5 quarters now, an unthinkable outcome. This whole thing is a farce, a gross miscarriage of justice. I hope this isn’t a stealth expropriation, that Guatemalan bureaucrats will get their useless paperwork done sooner or later and let Escobal come back online. Within a year, Escobal’s silver production should return to pre-fiasco levels of 5700k ounces a quarter.
At that rate, Escobal would retake the throne of being the world’s largest primary silver mine! It would boost overall SIL-top-17 production by a massive 7.6%. Last year no one expected this unprecedented Escobal debacle to last very long, as the economic damage to Guatemala was too great. But as it drags on and on, TAHO stock has been decimated. It slumped to a brutal all-time record low in mid-November.
Sadly for long-suffering TAHO shareholders, management capitulated. In mid-November they agreed to sell the company to Pan American Silver at rock-bottom prices despite a 55% premium over that all-time low. That’s devastating for TAHO investors but a steal for PAAS, which is SIL’s 4th-largest component at 11.9% of its total weighting. That keeps Escobal’s huge production in SIL if PAAS can finesse its reopening.
Unfortunately SIL’s mid-November composition was such that there wasn’t a lot of Q3 cost data reported by its top component miners. A half-dozen of these top SIL companies trade in South Korea, the UK, Mexico, and Peru, where reporting only comes in half-year increments. There are also primary gold miners that don’t report silver costs, and a silver explorer with no production. So silver cost data remains scarce.
Nevertheless it’s always useful to look at what we have. Industrywide silver-mining costs are one of the most-critical fundamental data points for silver-stock investors. As long as the miners can produce silver for well under prevailing silver prices, they remain fundamentally sound. Cost knowledge helps traders weather this sector’s left-for-dead unpopularity without succumbing to selling low like the rest of the herd.
There are two major ways to measure silver-mining costs, classic cash costs per ounce and the superior all-in sustaining costs. Both are useful metrics. Cash costs are the acid test of silver-miner survivability in lower-silver-price environments, revealing the worst-case silver levels necessary to keep the mines running. All-in sustaining costs show where silver needs to trade to maintain current mining tempos indefinitely.
Cash costs naturally encompass all cash expenses necessary to produce each ounce of silver, including all direct production costs, mine-level administration, smelting, refining, transport, regulatory, royalty, and tax expenses. In Q3’18, these top 17 SIL-component silver miners that reported cash costs averaged $6.58 per ounce. While that surged 35.3% YoY, it still remains far below today’s anomalously-low silver prices.
There are a couple of extreme cash-cost outliers that are skewing this average, but offsetting each other. SSRM’s depleting silver mine is producing less with each passing quarter, forcing fewer ounces to bear the fixed costs of mining. Its crazy-high $17.41 per ounce in Q3 isn’t normal. But on the other side of this is Silvercorp Metals, which produces silver in Chinese mines yielding enormous base-metals byproducts.
Selling those and crediting their value across the silver ounces mined dragged down SVM’s cash costs to an unbelievable negative $3.37 in Q3! Excluding these extreme outliers, the rest of the SIL top 17 saw average cash costs of $6.40. That’s not too far above the past 4 quarters’ $4.86, $4.66, $5.05, and $3.95. As long as silver prices remain over those low levels, the silver miners can keep the lights on at their mines.
Way more important than cash costs are the far-superior all-in sustaining costs. They were introduced by the World Gold Council in June 2013 to give investors a much-better understanding of what it really costs to maintain silver mines as ongoing concerns. AISCs include all direct cash costs, but then add on everything else that is necessary to maintain and replenish operations at current silver-production levels.
These additional expenses include exploration for new silver to mine to replace depleting deposits, mine-development and construction expenses, remediation, and mine reclamation. They also include the corporate-level administration expenses necessary to oversee silver mines. All-in sustaining costs are the most-important silver-mining cost metric by far for investors, revealing silver miners’ true operating profitability.
In Q3’18 these top 17 SIL miners reporting AISCs averaged $13.53 per ounce, which also surged 39.0% YoY. Again that was skewed in both directions by SSRM’s extremely-high $22.39 on Pirquitas’ depletion and SVM’s exceedingly-low $2.54 on those huge base-metals byproducts. Without them, the rest of the top 17 averaged $13.96 AISCs. That was much higher than the past 4 quarters’ $9.73, $10.16, $10.92, and $10.93.
The lower production was definitely a factor, which is inversely proportional to per-ounce costs. Silver-mining costs are largely fixed quarter after quarter, with actual mining requiring roughly the same levels of infrastructure, equipment, and employees. So the lower production, the fewer ounces to spread mining’s big fixed costs across. The major silver miners also reported lower ore grades, exacerbating the decline.
Nevertheless, the top 17 SIL miners’ AISCs both with and without the outliers still remained under silver’s weak average $14.96 price in Q3. So even with silver faring its worst relative to gold in decades thanks to devastated sentiment, the silver mines were profitable. And interestingly the closer AISCs crowd the prevailing silver prices, the more profits leverage the miners have to silver mean reverting much higher.
In mid-November silver and SIL slumped to their lowest levels since back in January and March 2016. That was early in a new silver bull which emerged from conditions like today’s where silver was despised. Over 7.6 months between December 2015 and August 2016, silver soared 50.2% higher as gold surged in its own new bull. And with silver moving again, investors eagerly started returning to the battered silver stocks.
Thanks to that silver-bull upleg, SIL skyrocketed 247.8% higher in just 6.9 months in essentially that first half of 2016! That ought to give embattled silver-stock investors some hope. All it will take to turn silver stocks around is a typical gold-driven silver upleg, and then they will soar again. The reason that silver miners’ stocks blast dramatically higher with silver is their high inherent profits leverage to silver prices.
Assume another 50% silver upleg, which is pathetically small by historical standards, from silver’s recent secular low in mid-November. That would catapult silver back up to $21 per ounce for the first time since July 2014. At Q3’18’s top-17-SIL-stock average AISCs of $13.53, profits were just $0.47 per ounce at $14 silver. But at $21 assuming stable AISCs, they would soar an astounding 1489% higher to $7.47 per ounce!
You better believe silver-stock prices would skyrocket with that kind of earnings growth. The higher their AISCs, the greater their upside profits leverage. Now consider this same 50% silver upleg using the rolling-past-4-quarter top-17-SIL-stock average AISCs of $10.43 per ounce. That implies the $3.57 profit seen at $14 silver would only balloon 196% to $10.57 per ounce at $21 silver. So higher costs aren’t necessarily bad.
As long as AISCs are below prevailing silver prices, the major silver miners can weather anything. The closer their AISCs creep to silver, the greater their earnings growth when silver mean reverts higher. So the major silver miners’ upside from here is truly explosive as silver recovers, just like back in early 2016. And silver will power much higher soon as the record silver-futures shorts of early September continue to be covered.
While all-in sustaining costs are the single-most-important fundamental measure that investors need to keep an eye on, other metrics offer peripheral reads on the major silver miners’ fundamental health. The more important ones include cash flows generated from operations, GAAP accounting profits, revenues, and cash on hand. As you’d expect given the miserably-low silver prices, they were on the weak side in Q3.
Operating cash flows among these SIL top 17 reporting them fell 23.0% YoY to $830m, which is totally reasonable given the 2.2%-lower silver production and 11.2%-lower average silver prices. Sales fell 9.5% YoY to $2717m, with some of the silver-side weakness offset by the 1.6%-higher gold production. And cash on hand fell 9.8% YoY to a still-hefty $2419m, giving these silver miners plenty of capital to weather this storm.
The hard GAAP accounting profits looked pretty ugly though, plunging to a $243m loss from being $88m in the black in Q3’17. But most of those losses didn’t reflect operations. TAHO alone wrote off a massive $170m for the impairment of Escobal, which reflected an estimated restart date of the end of 2019. Coeur Mining reported a smaller $19m writedown for one of its mines. These two non-cash charges alone were $189m.
Without them GAAP profits would’ve sunk from $88m in Q3’17 to a milder $54m loss in Q3’18. That’s still poor, but not unexpected given the lowest silver prices seen in almost several years. Again silver-mining earnings will soar if not skyrocket as silver inevitably mean reverts higher from here. All it takes for silver to surge in major bull-market uplegs is for gold itself to power higher, and huge gold upleg fuel abounds now.
The silver-mining stocks are doing way better fundamentally than they’ve been given credit for. Their higher Q3’18 mining costs still remained below the recent deep silver lows. And the compressed gap between their AISCs and low prevailing silver prices guarantees epic profits upside as silver recovers and mean reverts higher. That will attract back investors fast, catapulting silver stocks up sharply like in early 2016.
While traders can play that in SIL, this ETF has problems. Its largest component is now a base-metals smelter of all things! And the great majority of its stocks are primary gold miners with byproduct silver production. The best gains by far will be won in smaller purer mid-tier and junior silver miners with superior fundamentals. A carefully-handpicked portfolio of these miners will generate much-greater wealth creation.
The key to riding any silver-stock bull to multiplying your fortune is staying informed, both about broader markets and individual stocks. That’s long been our specialty at Zeal. My decades of experience both intensely studying the markets and actively trading them as a contrarian is priceless and impossible to replicate. I share my vast experience, knowledge, wisdom, and ongoing research through our popular newsletters.
Published weekly and monthly, they explain what’s going on in the markets, why, and how to trade them with specific stocks. They are a great way to stay abreast, easy to read and affordable. Walking the contrarian walk is very profitable. As of Q3, we’ve recommended and realized 1045 newsletter stock trades since 2001. Their average annualized realized gains including all losers is +17.7%! That’s double the long-term stock-market average. Subscribe today and take advantage of our 20%-off holidays sale!
The bottom line is the major silver miners’ fundamentals remain solid based on their recently-reported Q3’18 results. They continue to mine silver at all-in sustaining costs below even mid-November’s deep silver lows. Their profits will multiply dramatically as silver rebounds higher driven by gold’s own upleg and record silver-futures short covering. Investment capital will flood back in, catapulting silver stocks up violently.
So traders need to look through the recent forsaken herd sentiment to understand the silver miners’ hard fundamentals. These left-for-dead stocks are seriously undervalued even at today’s low silver prices, let alone where silver heads during the next major gold upleg. Silver can’t languish at extreme anomalous multi-decade lows relative to gold for long. And once it catches a bid, silver stocks will really amplify its upside.
The major gold miners’ stocks remain mired in universal bearishness, largely left for dead. They are just wrapping up their third-quarter earnings season, which proved challenging. Lower gold prices cut deeply into cash flows and profits, and production-growth struggles persisted. But these elite companies did hold the line on costs, portending soaring earnings as gold recovers. Their absurdly-cheap stock prices aren’t justified. Four times a year publicly-traded companies release treasure troves of valuable information in the form of quarterly reports. Companies trading in the States are required to file 10-Qs with the U.S. Securities and Exchange Commission by 40 calendar days after quarter-ends. Canadian companies have similar requirements at 45 days. In other countries with half-year reporting, many companies still partially report quarterly.
These quarterlies offer the best fundamental data available for individual major gold miners, showing how their operations are really faring. That helps dispel the thick obscuring fogs of sentiment that billow up the rest of the time. While I always eagerly anticipate perusing these key reports, I worried what this Q3’18 earnings season would reveal. Lower gold prices, flagging production, and weak sentiment are a witches’ brew.
The definitive list of major gold-mining stocks to analyze comes from the world’s most-popular gold-stock investment vehicle, the GDX VanEck Vectors Gold Miners ETF. Its composition and performance are similar to the benchmark HUI gold-stock index. GDX utterly dominates this sector, with no meaningful competition. This week GDX’s net assets are 50.5x larger than the next-biggest 1x-long major-gold-miners ETF!
GDX is effectively the gold-mining industry’s blue-chip index, including the biggest and best publicly-traded gold miners from around the globe. GDX inclusion is not only prestigious, but grants gold miners better access to the vast pools of stock-market capital. As ETF investing continues to rise, capital inflows into leading sector ETFs require their managers to buy more shares in underlying component companies.
My earnings-season trepidation soared on October 25th. The gold stocks were doing fairly well then, with GDX rallying 14.4% out of mid-September’s deep forced-capitulation lows . Sentiment was slowly improving. But that day GDX plunged 4.4% out of the blue, and the flat gold price at upleg highs certainly wasn’t the driver. The most-loved major gold miner had plummeted after reporting shockingly-bad Q3 results. Goldcorp has always been one of GDX’s top components. It reported mining just 503k ounces of gold last quarter, which plunged 11.9% sequentially quarter-on-quarter and 20.5% year-over-year! That forced its all-in sustaining costs a proportional 20.8% higher YoY to $999 per ounce. Investors panicked and fled, hammering GG stock 18.7% lower. That was the worst down day in the 24.6-year history of this company.
That left it at an extreme 16.2-year low! GG hadn’t been lower since August 2002 when gold was still in the low $300s, it was apocalyptic. That really torpedoed still-fragile sentiment in this sector, even though GG’s woes looked short-lived. It was bringing a new expansion online at one of its big mines, which was what caused the shortfall. Now in Q4’18 Goldcorp expects production to rebound to 620k ounces at $750 AISCs.
After GG’s Q3 disaster, I worried frayed investors would dump other gold stocks on any hints of less-than-optimal quarterly results. But GDX has ground sideways on balance since that GG shock, weathering this risky earnings season with sentiment so fragile. Ever since I’ve been anxious to analyze the collective Q3 results of the major gold miners as a whole, to see if GG’s travails were unique to it or more systemic.
GDX’s component list this week ran 48 “Gold Miners” long. While the great majority of GDX stocks do fit that bill, it also contains gold-royalty companies and major silver miners. All the world’s big primary gold miners publicly traded in major markets are included. Every quarter I look into the latest operating and financial results of the top 34 GDX companies, which is just an arbitrary number fitting neatly into these tables.
That’s a commanding sample, as GDX’s 34 largest components now account for a whopping 93.5% of its total weighting! These elite miners that reported Q3’18 results produced 296.4 metric tons of gold, which accounts for fully 33.9% of last quarter’s total global gold production. That ran 875.3t per the recently-released Q3’18 Gold Demand Trends report from the World Gold Council. I’ll discuss production more below.
Most of these top 34 GDX gold miners trade in the U.S. and Canada where comprehensive quarterly reporting is required by regulators. But some trade in Australia and the U.K., where companies just need to report in half-year increments. Fortunately those gold miners do still tend to issue production reports without financial statements each quarter. There are still wide variations in reporting styles and data offered.
Every quarter I wade through a ton of data from these major gold miners’ latest results and dump it into a big spreadsheet for analysis. The highlights make it into these tables. Blank fields mean a company had not reported that data for Q3’18 as of this Wednesday. Looking at the major gold miners’ latest results in aggregate offers valuable insights on this industry’s current fundamental health unrivaled anywhere else.
The first couple columns of these tables show each GDX component’s symbol and weighting within this ETF as of this week. While most of these stocks trade on US exchanges, some symbols are listings from companies’ primary foreign stock exchanges. That’s followed by each gold miner’s Q3’18 production in ounces, which is mostly in pure-gold terms. That excludes byproduct metals often present in gold ore. Those are usually silver and base metals like copper, which are valuable. They are sold to offset some of the considerable costs of gold mining, lowering per- ounce costs and thus raising overall profitability. In cases where companies didn’t separate out gold and lumped all production into gold-equivalent ounces, those GEOs are included instead. Then production’s absolute year-over-year change from Q3’17 is shown.
Next comes gold miners’ most-important fundamental data for investors, cash costs and all-in sustaining costs per ounce mined. The latter directly drives profitability which ultimately determines stock prices. These key costs are also followed by YoY changes. Last but not least the annual changes are shown in operating cash flows generated, hard GAAP earnings, revenues, and cash on hand with a couple exceptions. Percentage changes aren’t relevant or meaningful if data shifted from positive to negative or vice versa, or if derived from two negative numbers. So in those cases I included raw underlying data rather than weird or misleading percentage changes. This whole dataset together offers a fantastic high-level read on how the major gold miners are faring fundamentally as an industry. Was Goldcorp’s disaster systemic?
Lupaka Gold’s (TSX-V: LPK) Invicta Gold Project is on the brink of production, set to become Peru’s next producing gold mine.
However, everything is not going to plan…for the better.
What has been quietly observed is that (1) the grades are coming in higher than the PEA and (2) the company is already making plans to increase production above the PEA throughout rate of 350 tpd. All this means higher levels of production and cash flow once the actual mining commences later this year.
Recent underground sampling of mineralization is revealing an asset that offers more than originally outlined in the company’s April 2018 Preliminary Economic Assessment (“PEA”) which gives investors additional upside for any increases in mine output, improvement of grade and additional ounces to the overall resource.
The April 2018 PEA for the Invicta Mine outlined a mineral resource of 3 million tonnes of Indicated Mineral Resources at 5.78 grams per tonne (“g/t”) gold equivalent (“AuEq”) ounces using a 3.5-g/t cut-off grade (“COG”), and 600,000 tonnes of Inferred Mineral Resources at 5.49 g/t AuEq.
Within that resource the Company has a PEA that outlines an initial 6-year mine life that will produce produce a total of 669,813 tonnes of mineralized material processing 350 tonnes per day (“tpd”) at an average grade of 8.6 g/t Au-Eq. Lupaka’s grades included estimated metallurgical recoveries, and the true grade will likely be even higher than 8.5 g/t AuEq.
Just to highlight, with an all in sustaining cost (“ASIC”) of $575 per gold ounce equivalent, Lupaka Gold will be one of the lowest cost junior producers.
As part of the development work to put Invicta into production, Lupaka has been conducting channel sampling every 5 metres on all workings during development.
The results have demonstrated continuity of the high grade mineralization and additional potential that the Aetnea vein hosts.
In March 2018, the company released preliminary sample results:
Sample assay values over the footwall vein averaged 9.86 g/t AuEq over 130 metres, with an average width of 6.1 metres (“m”);
Sample assay values over the hanging wall split averaged 7.00 g/t AuEq over 70 m, with an average width of 6 m.
In June, Lupaka released further results from a underground sampling program on the newly developed 3430 production sublevel.
9.22 g/tAuEq over a strike length of 130 m, with an average sample width of 4.2 m.
The company provided additional results in July:
Channel sample assay values from across the strike of the Atenea vein, within the raise development, returned an average of 23.45 g/t AuEq over a vertical height of approximately 30 m;
Sampling returned significant grades such as sample number 2606E which returned 227.77 g/t AuEq over a width of 1.2 m.
In addition to the sampling, development and rehabilitation of the Invicta mine has provided ~6,500 tonnes of mineralized material from the 3400 Level and when sampled on surface returned an average grade of 7.21 g/t AuEq.
Grade consistency is always a problem with mining. However, it is appearing that the Invicta PEA outlined a muted gold grade on a smaller area of the known mineralization which does not highlight the potential for higher grade zones and the prospectivity of the area.
Higher grades could improve the bottom line as mining proceeds through the Aetnea vein and into the other zones around the current area of operational focus.
Past exploration at the Invicta mine property indicates that the property has considerable potential for mineral resource expansion through exploration.
Structural studies, geophysical and geochemical work conducted to date strongly suggest the potential for mineral resource expansion along existing mineralized structures.
Past sampling around Invicta revealed the exploration potential with many areas reporting grades greater than 6 g/t AuEq. mine
All in all, the focus on a smaller area for the PEA and initial mine plan reveals that the company’s plan has been to bring production online with a well defined resource with the Aetnea vein through underground mining with minimal capital expenditures, rather than trying to finance and build a large scale operation off the back.
With the commencement of limited toll mining in September, and the beginning of full scale production hopefully in October, Lupaka will have the necessary cash flow to conduct exploration and prove up more ounces in the ground and significantly alter the assumptions of the April 2018 PEA to extend the life of mine.
The next milestone is the final mining exploitation licence, which requires an inspection by the Peruvian Ministry of Mines and Energy.
The inspection will be performed before the end of October and upon receipt of the exploitation licence, the company will have the go ahead to produce at a rate of 400 tonnes per day, or 12,000 tonnes per month.
However, with the permit to operate at 400 tpd, the company could see its potential production increase by 14% from the 350 tpd production assumption outlined in the PEA, boosting the project’s cash flow.
Currently, shares in Lupaka gold are trading near year-lows which discounts a years’ worth of work and development that has improved access to the mine, defined a PEA, divestment of non primary assets, cash flow from initial toll mining and on the cusp of full scale mining.
The company laid out a plan to bring into production the Invicta mine with a small area of operational focus and a humble gold grade in comparison to recent sampling.
The plan is working and it is starting to reveal that there is more to the story than initially outlined…a good thing for investors.
*The author of this article was compensated for the creation of this article in cash. The author picked up shares in the public market, ranging from prices of 14 cents to 20 cents over the past year. This article is meant to serve informational and marketing purposes only and not a technical report and does not constitute a buy recommendation. As always, please do your own diligence.
*The Mineral Resource Statement for the Invicta Project is tabulated to a cut-off grade of 3.0 g/t Au-Eq. Cut-off grades are based on a price of US$1,250 per ounce of gold, US$17.00 per ounce of silver, US$3.00 per pound of copper, US$1.05 per pound of lead and US$1.20 per pound of zinc. The equivalent gold calculation assumes mill recoveries of 85 percent for gold, 80 percent for silver, 82 percent for copper and lead and 77 percent for zinc
The major silver miners’ stocks have been thrashed, pummeled to brutal multi-year lows. They suffered serious collateral damage as silver plunged on gold’s breakdown, driven by crazy-extreme all-time-record silver-futures short selling. All this technical carnage left investors reeling, devastating sentiment. The silver miners’ recently-reported Q2’18 results reveal whether their anomalous plunge was justified fundamentally.
Four times a year publicly-traded companies release treasure troves of valuable information in the form of quarterly reports. Companies trading in the States are required to file 10-Qs with the US Securities and Exchange Commission by 45 calendar days after quarter-ends. Canadian companies have similar requirements. In other countries with half-year reporting, many companies still partially report quarterly.
Unfortunately the universe of major silver miners to analyze and invest in is pretty small. Silver mining is a tough business both geologically and economically. Primary silver deposits, those with enough silver to generate over half their revenues when mined, are quite rare. Most of the world’s silver ore formed alongside base metals or gold. Their value usually well outweighs silver’s, relegating it to byproduct status.
The Silver Institute has long been the authority on world silver supply-and-demand trends. It published its latest annual World Silver Survey covering 2017 in mid-April. Last year only 28% of the silver mined around the globe came from primary silver mines! 36% came from primary lead/zinc mines, 23% copper, and 12% gold. That’s nothing new, the silver miners have long supplied less than a third of world mined supply.
It’s very challenging to find and develop the scarce silver-heavy deposits supporting primary silver mines. And it’s even harder forging them into primary-silver-mining businesses. Since silver isn’t very valuable, most silver miners need multiple mines in order to generate sufficient cash flows. Traditional major silver miners are increasingly diversifying into gold production at silver’s expense, chasing its superior economics.
So there aren’t many major silver miners left out there, and their purity is shrinking. The definitive list of these companies to analyze comes from the most-popular silver-stock investment vehicle, the SIL Global X Silver Miners ETF. In mid-August at the end of Q2’s earnings season, SIL’s net assets were running 6.7x greater than its next-largest competitor’s. So SIL continues to dominate this small niche contrarian sector.
While SIL has its flaws, it’s the closest thing we have to a silver-stock index. As ETF investing continues to eclipse individual-stock picking, SIL inclusion is very important for silver miners. It grants them better access to the vast pools of stock-market capital. Differential SIL-share buying by investors requires this ETF’s managers to buy more shares in its underlying component companies, bidding their stock prices higher.
In mid-August as the silver miners were finishing reporting their Q2’18 results, SIL included 23 “Silver Miners”. Unfortunately the great majority aren’t primary silver miners, most generate well under half their revenues from silver. That’s not necessarily an indictment against SIL’s stock picking, but a reflection of the state of this industry. There aren’t enough significant primary silver miners left to fully flesh out an ETF.
This disappointing reality makes SIL somewhat problematic. The only reason investors would buy SIL is they want silver-stock exposure. But if SIL’s underlying component companies generate just over a third of their sales from silver mining, they aren’t going to be very responsive to silver price moves. And most of that ETF capital intended to go into primary silver miners is instead diverted into byproduct silver miners.
So silver-mining ETFs sucking in capital investors thought they were allocating to real primary silver miners effectively starves them. Their stock prices aren’t bid high enough to attract in more investors, so they can’t issue sufficient new shares to finance big silver-mining expansions. This is exacerbating the silver-as-a-byproduct trend. Only sustained much-higher silver prices for years to come could reverse this.
Every quarter I dig into the latest results from the major silver miners of SIL to get a better understanding of how they and this industry are faring fundamentally. I feed a bunch of data into a big spreadsheet, some of which made it into the table below. It includes key data for the top 17 SIL component companies, an arbitrary number that fits in this table. That’s a commanding sample at 95.8% of SIL’s total weighting!
While most of these top 17 SIL components had reported on Q2’18 by mid-August, not all had. Some of these major silver miners trade in the UK or Mexico, where financial results are only required in half-year increments. If a field is left blank in this table, it means that data wasn’t available by the end of Q2’s earnings season. Some of SIL’s components also report in gold-centric terms, excluding silver-specific data.
The first couple columns of this table show each SIL component’s symbol and weighting within this ETF as of mid-August. While most of these stocks trade on US exchanges, some symbols are listings from companies’ primary foreign stock exchanges. That’s followed by each miner’s Q2’18 silver production in ounces, along with its absolute year-over-year change. Next comes this same quarter’s gold production.
Nearly all the major silver miners in SIL also produce significant-to-large amounts of gold! That’s truly a double-edged sword. While gold really stabilizes and boosts silver miners’ cash flows, it also retards their stocks’ sensitivity to silver itself. So the next column reveals how pure these elite silver miners are, approximating their percentages of Q2’18 revenues actually derived from silver. This is calculated two ways.
The large majority of these top SIL silver miners reported total Q2 revenues. Quarterly silver production multiplied by silver’s average price in Q2 can be divided by these sales to yield an accurate relative-purity gauge. When Q2 sales weren’t reported, I estimated them by adding silver sales to gold sales based on their production and average quarterly prices. But that’s less optimal, as it ignores any base-metals byproducts.
Next comes the major silver miners’ most-important fundamental data for investors, cash costs and all-in sustaining costs per ounce mined. The latter directly drives profitability which ultimately determines stock prices. These key costs are also followed by YoY changes. Last but not least the annual changes are shown in operating cash flows generated and hard GAAP earnings, with a couple exceptions necessary.
Percentage changes aren’t relevant or meaningful if data shifted from positive to negative or vice versa, or if derived from two negative numbers. So in those cases I included raw underlying data rather than weird or misleading percentage changes. This whole dataset together offers a fantastic high-level read on how the major silver miners are faring fundamentally as an industry. Was their recent plunge righteous?
Production is naturally the lifeblood of the silver-mining sector. The more silver and increasingly gold that these elite miners can wrest from the bowels of the earth, the stronger their fundamental positions and outlooks. These top 17 SIL silver miners failed to increase their mining tempos over this past year. Their collective silver and gold production deteriorated 4.4% and 2.1% YoY to 75.1m and 1327k ounces mined.
According to the Silver Institute’s latest WSS, total world silver mine production averaged 213.0m ounces per quarter in 2017. So at 75.1m in Q2, these top 17 SIL components were responsible for 35.3% of that rate. And their overall production decline last quarter is misleading, heavily skewed by two outliers with unusual situations. Tahoe Resources and SSR Mining reported huge 100.0% and 46.3% YoY production plunges!
Without TAHO and SSRM, the rest of these elite silver miners were able to grow their collective silver production by a decent 2.0% YoY. That’s impressive considering the miserable silver-price environment. Between Q2’17 and Q2’18, the average quarterly silver price slumped 3.9% to $16.51. That was really weak compared to gold, which actually rose 3.9% in quarterly-average terms to $1306 across these quarters.
Silver has always been driven by gold, effectively acting like a gold sentiment gauge. Generally big silver uplegs only happen after gold has rallied long enough and high enough to convince traders its gains are sustainable. Then the way-smaller silver market tends to start leveraging and amplifying gold’s moves by 2x to 3x. But gold sentiment was so insipid over this past year that no excitement was sparked for silver.
Yet the top 17 SIL silver miners excluding TAHO and SSRM were able to buck those silver headwinds to still grow production. That is setting up these companies for stronger profits growth once silver’s price inevitably mean reverts higher. It’s important to understand what’s going on with TAHO and SSRM though, as these are long-time favorites among American investors. TAHO’s silver production should return.
Tahoe was originally spun off by Goldcorp to develop the incredible high-grade Escobal silver mine in Guatemala, which went live in Q4’13. Everything went well for its first few years. By Q1’17, Escobal was a well-oiled machine producing 5700k ounces of silver. That provided 1000+ great high-paying jobs to locals and contributed big taxes to Guatemala’s economy. Escobal was a great economic boon for this country.
But a radical group of anti-mining activists managed to spoil everything, cruelly casting their fellow countrymen out of work. They filed a frivolous and baseless lawsuit against Guatemala’s Ministry of Energy and Mines, Tahoe wasn’t even the target! It alleged this regulator had not sufficiently consulted with the indigenous Xinca people before granting Escobal’s permits. And they don’t even live around this mine site.
Only in a third-world country plagued with rampant government corruption would a regulator apparently not holding enough meetings be a company’s problem. Instead of resolving this, a high Guatemalan court inexplicably actually suspended Escobal’s mining license in early Q3’17! Tahoe was forced to temporarily mothball its crown-jewel silver mine, and thus eventually lay off its Guatemalan employees.
That license was technically reinstated a couple months later, but the activists appealed to a higher court. It required the regulator to study the indigenous people in surrounding areas and report back, and now needs to make a decision. The government also needs to clear out an illegal roadblock to the mine site by violent anti-mine militants, who have blockaded Escobal supplies and physically attacked trucks and drivers!
So Escobal has been dead in the water with zero production for an entire year, an unthinkable outcome. This whole thing is a farce, a gross miscarriage of justice. Sooner or later the Guatemalan bureaucrats will get all their useless paperwork done and Escobal will come back online. After a few quarters or so of spinning back up, Escobal’s silver production should return to pre-fiasco levels around 5700k ounces a quarter.
That would boost SIL’s top 17 components’ current overall silver production by 7.6%. In my decades of intensely researching and actively trading mining stocks, I’ve never seen anything like this Escobal debacle. While TAHO’s cashflows are really impaired without this silver mine which was actually the world’s largest primary, it can weather this nightmare because of its other gold mines that yielded 102.6k ounces in Q2’18.
Thankfully SSR Mining’s silver-production plunge is far less dramatic. This company used to be known as Silver Standard Resources, and its old Pirquitas silver mine is simply depleting as forecast. SSRM is exploring in the area trying to extend the life of this old mine, which was joint-ventured and renamed the Puna Operations. But most of SSRM’s resources are being poured into its far-more-profitable gold mines.
That gold focus among these top silver miners is common across SIL’s components. As the silver-percentage column above shows, most of these elite silver miners are actually primary gold miners by revenue! Only 3 of these 17 earned more than half of their Q2’18 sales from mining silver, and they are highlighted in blue. WPM, PAAS, and TAHO are also top-34 components in the leading GDX gold miners’ ETF!
While they only comprised 7.8% of GDX’s total weighting in mid-August, this highlights how difficult it is to find primary silver miners. SIL’s managers have an impossible job these days with the major silver miners increasingly shifting to gold. They are really scraping the bottom of the barrel to find more silver miners. In Q3’17 they added Korea Zinc, and it’s now SIL’s 3rd-biggest holding with a hefty 11.9% total weighting.
That was intriguing, as I’d never heard of this company after decades deeply immersed in this small silver-mining sector. So I looked into Korea Zinc and found it was merely a smelter, not even a miner! Its English-language disclosures are atrocious, starting with its homepage reading “We are Korea Zinc, the world’s one of the best smelting company”. The latest production data I can find in English is still 2015’s.
That year Korea Zinc “produced” 63.3m ozs of silver, which averages to 15.8m quarterly. That is largely a byproduct from its main businesses of smelting zinc, lead, copper, and gold. The fact SIL’s managers included a company like this that doesn’t even mine silver as a top SIL component shows how rare major silver miners have become. The economics of silver mining at today’s prices are way inferior to gold mining.
The traditional major silver miners are painfully aware of this, and have spent years actively diversifying into gold. In Q2’18, the average percentage of revenues these top 17 SIL miners derived from silver was only 36.3%. That’s right in line with the recent trend, with the prior four quarters seeing 36.1%, 39.3%, 35.3%, and 36.4%. This relatively-low silver exposure is why SIL isn’t as responsive to silver as investors expect.
Silver mining is every bit as capital-intensive as gold mining, requiring similar large expenses for planning, permitting, and constructing mines and mills. It needs similar heavy excavators and haul trucks to dig and move the silver-bearing ore. Similar levels of employees are necessary to run these mines. But silver generates much lower cash flows due to its lower price. Consider hypothetical mid-sized silver and gold mines.
They might produce 10m and 300k ounces annually. At last quarter’s average prices, these silver and gold mines would yield $165m and $392m of yearly sales. Unfortunately it is far easier to pay the bills mining gold these days. So primary silver miners are increasingly becoming a dying breed, which is sad. The traditional major silver miners are adapting by ramping their gold production often at silver’s expense.
This industry’s flagging silver purity and thus deteriorating responsiveness to silver price trends will be hard to reverse. Silver would need to far outperform gold, rocketing higher in one of its gigantic uplegs while gold lags. And it would have to stay relatively strong compared to gold for years after that to entice big capital spending back into primary silver mines. While possible, that seems like a stretch in today’s markets.
Unfortunately SIL’s mid-August composition was such that there wasn’t a lot of Q2 cost data reported by its top component miners. A half-dozen of these top SIL companies trade in the UK, South Korea, Mexico, and Peru, where reporting only comes in half-year increments. There are also primary gold miners that don’t report silver costs, and a silver explorer with no production. So silver cost data remains scarce.
Nevertheless it’s always useful to look at what we have. Industrywide silver-mining costs are one of the most-critical fundamental data points for silver-stock investors. As long as the miners can produce silver for well under prevailing silver prices, they remain fundamentally sound. Cost knowledge helps traders weather this sector’s occasional fear-driven plunges without succumbing to selling low like the rest of the herd.
There are two major ways to measure silver-mining costs, classic cash costs per ounce and the superior all-in sustaining costs. Both are useful metrics. Cash costs are the acid test of silver-miner survivability in lower-silver-price environments, revealing the worst-case silver levels necessary to keep the mines running. All-in sustaining costs show where silver needs to trade to maintain current mining tempos indefinitely.
Cash costs naturally encompass all cash expenses necessary to produce each ounce of silver, including all direct production costs, mine-level administration, smelting, refining, transport, regulatory, royalty, and tax expenses. In Q2’18, these top 17 SIL-component silver miners that reported cash costs averaged just $3.95 per ounce! That plunged a whopping 37.6% YoY, making it look like these miners are getting more efficient.
But that’s misleading. Because of hefty byproduct credits from gold and base metals, Hecla Mining and Fortuna Silver Mines both reported negative cash costs in Q2. They are an accounting fiction, as mining silver still costs a lot of money. But crediting byproduct sales to silver can slash reported cash costs. In the comparable quarter a year earlier, there were no negative cash costs at any of SIL’s top 17 miners.
Those super-low cash costs offset SSR Mining’s crazy-high $14.73 per ounce. That’s not normal either, the result of that winding down of its lone silver mine. Excluding these extreme outliers, the remaining handful of silver miners had average cash costs of $4.83 per ounce. As long as silver prices stay above those levels, the silver miners can keep the lights on at their mines. Sub-$5 silver is wildly inconceivable!
Way more important than cash costs are the far-superior all-in sustaining costs. They were introduced by the World Gold Council in June 2013 to give investors a much-better understanding of what it really costs to maintain silver mines as ongoing concerns. AISCs include all direct cash costs, but then add on everything else that is necessary to maintain and replenish operations at current silver-production levels.
These additional expenses include exploration for new silver to mine to replace depleting deposits, mine-development and construction expenses, remediation, and mine reclamation. They also include the corporate-level administration expenses necessary to oversee silver mines. All-in sustaining costs are the most-important silver-mining cost metric by far for investors, revealing silver miners’ true operating profitability.
In Q2’18 these top 17 SIL miners reporting AISCs averaged just $10.93 per ounce! That was down 6.3% YoY, and was way below silver’s average price of $16.51 last quarter. Even if the two extreme outliers are thrown out, SSRM’s abnormally-high mine-depletion $17.66 AISC and SVM’s incredibly-low huge-byproduct-credit $0.41 AISC, the remaining average is similar at $11.56. Silver mining remains very profitable!
Even at worst in August’s plunge driven by speculators’ crazy-extreme all-time-record silver-futures short selling, silver merely hit $14.44 on close. That’s still way above this industry’s total production costs any way you slice it. That implies even at peak fear the elite top silver miners of SIL were still earning hefty 24% profit margins! So there’s no doubt the recent frantic silver-stock selling wasn’t fundamentally righteous.
SIL getting hammered to deep 2.5-year lows in mid-August was the product of irrational fear run amok, it had nothing to do with how the silver miners are faring. At Q2’s average silver price and AISCs, these miners were earning $5.58 per ounce. Most other industries would die for such 34% margins. And those are going to explode higher as silver inevitably mean reverts back up again, probably violently given this setup.
Silver stocks plunged in August because silver did. That was driven by truly-extreme silver-futures short selling by speculators. They ramped their shorts to a wild new all-time record high of 114.5k contracts in mid-August! All that short selling is guaranteed proportional near-future buying, as excessive shorts must be closed by buying offsetting long contracts. Short-covering rallies are self-feeding, catapulting silver higher.
The more speculators buy to cover, the faster silver surges. The faster it surges, the more they have to buy to cover or face catastrophic losses due to the extreme leverage inherent in silver futures. It would take 73.0k contracts of buying to return spec shorts to their 52-week low seen in mid-September 2017. That’s the equivalent of 364.9m ounces, or nearly 43% of last year’s entire global mined supply! Talk about big.
And today’s silver prices are super-low relative to prevailing gold levels, portending huge mean-reversion upside. The long-term average Silver/Gold Ratio runs around 56x, which means it takes 56 ounces of silver to equal the value of one ounce of gold. Silver is greatly underperforming gold so far in 2018, with the SGR averaging a stock-panic-like 80.2x thus far in August! So silver is overdue to catch up with gold.
At a 56x SGR and $1200 gold, silver is easily heading near $21.50. That’s 30% above its Q2 average. Assuming the major silver miners’ all-in sustaining costs hold, that implies profits per ounce soaring 89% higher! And the record silver-futures short covering necessary after record silver-futures short selling is very likely to fuel a massive mean-reversion overshoot, making the silver-mining-profits upside much greater.
And silver miners’ AISCs generally don’t change much regardless of prevailing silver prices, since silver-mining costs are largely fixed during mine planning and construction. The top 17 SIL miners’ AISCs in the past four quarters averaged $11.66, $9.73, $10.16, and $10.92. So Q2’18’s $10.93 was right in line. Costs aren’t going to rise much as silver recovers, and higher production may even push them lower still.
While all-in sustaining costs are the single-most-important fundamental measure that investors need to keep an eye on, other metrics offer peripheral reads on the major silver miners’ fundamental health. The more important ones include cash flows generated from operations, GAAP accounting profits, revenues, and cash on hand. They were all decent to healthy in Q2’18 despite the low silver prices and weak sentiment.
These SIL-top-17 silver miners’ collective revenues only fell 1.5% YoY to $3114m. That reflects higher gold prices which offset the lower silver ones. That drove operating-cash-flow generation of $758m, which was 27.0% lower YoY. That’s not unreasonable given the 3.9% lower average silver prices from Q2’17 to Q2’18 and the 4.4% lower silver production among these elite silver majors. Cash flows remain fine.
These silver miners’ balance-sheet cash and short-term investments still powered 18.0% higher YoY to $3637m. The bigger their cash hoards, the easier the elite silver miners can weather these weak silver prices. Big treasuries also give them more capital to expand existing mines and buy or build new ones. A fundamental surprise seemed to come in hard GAAP accounting profits though, which soared 110.6% YoY!
But the $343m total earnings in Q2’18 were wildly skewed by a huge $246m non-recurring gain Wheaton Precious Metals reported. 77% of its massive $318m in profits came from gains on the sale of one of its silver streams. Back that out of overall top-17-SIL-component earnings, and they actually plunged 40.3% YoY. But they were still positive at $97m, and have incredible upside potential as silver’s price inevitably recovers.
The silver-mining stocks are doing way better fundamentally than they’ve been given credit for. Their mining costs remain far below prevailing silver levels, driving strong profitability even at August’s deep silver-price lows. That capitulation silver-stock plummeting fueled by cascading selling as stop losses were sequentially run wasn’t justified fundamentally. It was an extreme sentiment anomaly that can’t persist.
So a big mean-reversion rebound higher is inevitable and imminent. While traders can play that in SIL, that’s mostly a bet on primary gold miners with byproduct silver production. The best gains by far will be won in smaller purer mid-tier and junior silver miners with superior fundamentals. A carefully-handpicked portfolio of these miners will generate much-greater wealth creation than ETFs dominated by non-primary miners.
At Zeal we’ve literally spent tens of thousands of hours researching individual silver stocks and markets, so we can better decide what to trade and when. As of the end of Q2, this has resulted in 1012 stock trades recommended in real-time to our newsletter subscribers since 2001. Fighting the crowd to buy low and sell high is very profitable, as all these trades averaged stellar annualized realized gains of +19.3%!
The key to this success is staying informed and being contrarian. That means buying low when others are scared, before undervalued silver stocks soar much higher. An easy way to keep abreast is through our acclaimed weekly and monthly newsletters. They draw on my vast experience, knowledge, wisdom, and ongoing research to explain what’s going on in the markets, why, and how to trade them with specific stocks. Subscribe today while great silver stocks remain dirt-cheap!
The bottom line is the major silver miners’ fundamentals remain solid based on their recently-reported Q2’18 results. They continue to mine silver at all-in sustaining costs far below even mid-August’s deep silver lows. Their still-impressive profits will multiply as silver rebounds higher violently on record futures short covering. Investment capital will flood back into this tiny sector, catapulting silver stocks up sharply.
So traders need to look through the recent frightened herd sentiment to understand the silver miners’ hard fundamentals. These forsaken stocks are radically undervalued even at today’s low silver prices, let alone where silver heads during the next major gold upleg. Silver is poised to rocket higher soon as that mandatory extreme short covering gets underway. So the opportunities to buy dirt-cheap miners are fleeting.
Gold’s impressive rally continues to accelerate. Key fundamental and technical price drivers are playing a bullish song with almost perfect harmony.
Please click here now. Double-click to enlarge what may be the most beautiful weekly chart continuation pattern in the history of markets.
Note the awesome stance of the RSI and Stochastics oscillators as gold begins to ascend from the right shoulder low of the pattern.
If Michelangelo could be brought back to life, he would surely consider the picture being painted by the current technical action on this gold chart to be a “bull era masterpiece”.
Gold’s fabulous technical posture received a solid fundamental boost from two key central banks on Friday. Please click here now. The PBOC just announced an important change in price discovery for the yuan versus the dollar.
Please click here now. The “tariffs tantrum” created a decline in the yuan versus the dollar, and that’s what created the decline in gold to the right shoulder low.
The yuan is now rallying, and the PBOC announcement should give this rally some serious legs.
If the rupee also begins a rally against the dollar as the strong demand season for gold begins in India, gold’s right shoulder rally could turn into a major barnburner!
US central bank chair Jay Powell also added more fuel to gold’s rally on Friday, when he hinted that rates could be normalized by mid 2019. This powerful central banker also suggested that US GDP growth of 3% cannot be sustained for much longer.
Many analysts hoped that the Trump administration could extend the business cycle and corporate tax cuts have certainly helped to do that.
Unfortunately, Trump has shot most of his economic booster shot bullets, and his administration brings middle of the road republicanism to the table, not libertarianism.
Given the current demographics of the United States (population age, debt, and a declining “petro-dollar”), it’s going very difficult to “make most of the citizens great” with this approach.
Trump himself is a highly skilled business builder. Individuals with his incredible skills can thrive in almost any environment. In a socialist country like China, India, or Germany, Trump would likely be just as successful as he’s been in America, and perhaps even more so due to his incredible drive to overcome adversity.
Unfortunately, the average business owner doesn’t have his skills or energy, and they need vastly more libertarian support than the US government can currently provide.
The bottom line: US population demographics are horrific. House prices in most areas are unaffordable for almost anyone who isn’t rich or hasn’t inherited money. There is no incentive for industry to produce cheap electric cars. Property taxes are outrageously high and still rising relentlessly.
To reach and sustain the kind of long term growth rates that Trump has targeted, the income tax and the capital gains tax can’t just be cut. They need to be eliminated completely.
Back in 2014 I predicted that US GDP would peak in the 4% – 5% range in a single quarter during the 2017 – 2019 time frame. It happened in 2018. I’ve further predicted that GDP begins to fade in 2019 and steadily declines to the 1%-2% range. That prediction looks to be perfectly on track, and I’m sticking with it.
Please click here now. Commerzbank is a member of both the LBMA and the COMEX. Their analytical work command tremendous respect in the institutional investment community.
Their top analysts now suggest that gold will reach $1300 by year-end and $1500 by 2019. I don’t use time targets, but my weekly chart bull continuation pattern for gold bullion is perfectly in sync with their scenario.
Please click here now. Double-click to enlarge this Chinese stock market chart. Events in America are lining up with events in China and India to create a picture-perfect gold price surge to the $1500 area in 2019.
This Chinese stock market chart shows the FXI-NYSE ETF in a beautiful bull wedge pattern. The upside breakout that I’m forecasting would put Chinese gold buyers in a very good mood just as the strong demand season begins!
Please click here now. Double-click to enlarge this key GDX chart. A Vanguard gold-oriented mutual fund is transitioning to a more “general commodity” holdings approach. That’s put pressure on gold stocks in a “one off” or “black swan” manner as the fund sells a lot of gold stocks to make the transition. The good news is that this selling seems to be largely complete now.
I realise that the gold stocks decline may have caught some investors by surprise, but those with put options for insurance easily took it in stride. This is simply a great and unique opportunity to buy GDX and quality gold stocks near the base of my $21 – $18 accumulation zone.
As the majestic rally from gold bullion’s right shoulder low accelerates, Vanguard’s selling ends, and gold stocks are poised to stage “hypersonic” outperformance against all asset classes. Key fundamental and technical price drivers will soon make all gold stock investors look and feel like they are King Kong, lording over a fabulous bull era!
Last week GDX and GDXJ were down almost 12% at their lows on Thursday. Since then, they’ve recovered but only a tiny fraction of recent losses.
The crash did result in the miners reaching an extreme oversold condition while trading around long-term support at their December 2016 lows. It was the perfect setup for shorts to cover. That combination often results in at least a relief rally.
While a rally is underway, where it goes from here remains to be seen.
One thing to keep in mind, the recent decline was the result of a technical breakdown that followed months and months of consolidation. It’s extremely unlikely to immediately reverse course.
With that said, let’s keep in mind the measured downside targets.
For GDX, the downside target is $16.50-$17.00. For GDXJ, it’s $23-$24 and for Silver it is $12.70-$13.10.
On the sentiment front we should note that Gold’s net speculative position reached 1.5% of open interest. That is the second lowest reading in the past 17 years. Does that mean this is December 2015 or 2001 for Gold?
Do note that sentiment was at a similar level twice in 2013 and Gold trended lower after a rebound. Moreover, look at what happened in the 1980s and 1990s.
With the net speculative position already down to 1.5%, it figures to go negative if Gold is going to test its low at $1040/oz or even $1000/oz. If you think sentiment cannot get worse, think again.
Ultimately, its not sentiment or technicals that will decide a major bottom but fundamentals. After studying decades of history as well as the current market environment, we became convinced that precious metals will not begin a bull market until the Federal Reserve is done hiking rates.
Consider the following.
Over the past 60 years, in 10 of the last 12 rate hike cycles gold stocks boast an average gain of 185% with a minimum gain of 54%. The advance began on average one month and a median of two months after the Fed Funds rate peaked.
The precious metals sector is currently extremely oversold and a relief rally is underway. It should last at least a few more weeks and maybe a few months. However, the primary trend is down and there are downside targets that are even lower. Our plan is to let the rally run its course and when the time is right, go short again.
Glen McKay, Co-Founder Newfoundland Hard-Rok Inc.
It takes hard work and perseverance to succeed in the mining industry. Glen McKay, the chairman of the board of directors and founder of leading explosives manufacturer, Newfoundland Hard-Rok Inc, has both these qualities, starting his career as a deckhand in the fishing industry in Newfoundland and Labrador before leading businesses in a range of industries, including finance, construction and, yes, mining.
“Motivation and determination are essential attributes of any successful entrepreneur,” Glen McKay explained in a recent interview. “These are attributes that can be unlocked only from inside a person, not by external influences. A desire to learn and cultivating the ability to be insightful are necessary in assessing business opportunities.”
Newfoundland Hard-Rok Inc.
In 1985, McKay became the Dupont Explosives distributor in Newfoundland and Labrador and used the Newfoundland Hard-Rok division of his company MRO Supplies Ltd. to operate the explosives business. In 1987 Newfoundland Hard-Rok Inc. was incorporated as a separate entity by McKay, who then sold part of it to two employees of MRO Supplies Ltd., Carl Foss and Keith Phelan, who were then looking after the explosives division of the company. The drilling, blasting and explosives company has grown since then. In 1994 Newfoundland Hard-Rok Inc. built an ANFO manufacturing plant near Corner Brook, NL and acquired a fleet of hard rock drilling rigs. In May of 2009, Newfoundland Hard-Rok Inc. commissioned its newly constructed, state of the art Bulk Emulsion explosives manufacturing facility west of Corner Brook. It is now the premier supplier of explosives and drilling blasting services in the region.
Newfoundland Hard-Rok Inc. formed wholly owned subsidiary Dyno Nobel Labrador Inc. in 2004, and wholly owned subsidiary Dyno Nobel Baffin Island Inc. in 2013, with McKay serving as the Chair of the Board of Directors of Newfoundland Hard-Rok Inc. and managing the company’s finances and administration.
Dyno Nobel Labrador Inc. was awarded the contract from Vale (formerly Voisey’s Bay Nickel Company) in 2005 to design, build and operate a bulk emulsion (blasting agent) manufacturing plant supplying the needs of the open pit mine at Voisey’s Bay. Recently, Dyno Nobel Labrador Inc. was awarded an additional second contract for the underground delivery of loading equipment and related services at the mine. Vale’s mine site is in Northern Labrador along the coast near the community of Nain. The mine primarily produces nickel ore with some copper and cobalt and is accessible via air and sea only.
As Newfoundland and Labrador Premier Dwight Ball explains, a five-year construction project at Voisey’s Bay will extend the mine’s life by 15 years. Once operational, Ball estimates the underground mine will create an additional 1,700 jobs both at the mine and at the Long Harbour, NL, processing plant. The mining operation in northeastern Labrador opened in 2005 and currently employs about 500 people, Canadian Press reported.
Dyno Nobel Baffin Island Inc. is a wholly owned subsidiary of Newfoundland Hard-Rok Inc. and was formed in 2013 to service the Baffinland Iron Mines, Mary River Project. Dyno Nobel Baffin Island Inc. has been awarded a multi-year contract to supply explosives for the construction and mining phases. A state of the art modular emulsion manufacturing plant was constructed on site in 2014. The operations involve the manufacturing of bulk emulsion, loading, and firing the blast holes. The Mary River Mine is in the remote northern part of Baffin Island within the Arctic Circle. This remote cold location poses many challenges to shipping and logistics, equipment operation and working outdoors.
Cornerstone Capital Resources
But Dyno Nobel Labrador Inc was not Glen McKay’s first foray into the mining industry. In 1997, he co-founded Cornerstone Capital Resources Inc, a mineral exploration company best known for its Cascabel copper-gold project in Ecuador, which was acquired in 2011 during his tenure. While McKay was with Cornerstone, he served as president, chief executive officer and vice chair. He still owns shares in the company and keeps a close eye on its activities.
On July 13, 2018, Cornerstone released an update on the exploration program at its Cascabel copper-gold porphyry joint venture exploration project in northern Ecuador, in which the company has a 15% interest financed through to completion of a feasibility study. Cornerstone has several other projects in Ecuador and Chile.
“The Cascabel project increases in size with each round of drilling and an aggressive drilling campaign continues,” McKay posted onLinkedIn. “I think that they are probably 18-24 months away from a feasibility study, but I also expect that one of the majors will buy out the current owners (SolGold and Cornerstone) before then.”
SolGold owns the other 85% of Cascabel and is funding 100% of the exploration as the operator of the project. Cornerstone is spinning off its assets (except for its interest in Cascabel, shares of SolGold and the joint venture with the Ecuadorian state mining company) into a new company called Cornerstone Exploration, which will own several drill ready projects in Ecuador and Chile. Cornerstone will be re-named Cascabel Gold & Copper.
Apex Construction
That’s not the end of McKay’s entrepreneurial resume. In 1987, he provided the capital for Apex Construction Specialties Inc, which grew to become the largest supplier of commercial construction products in Newfoundland and Labrador. McKay remained as a shareholder and board member until the company was sold in 2017.
In his 40 years of business experience, McKay has learned a lot about people. In his own businesses, he looked for self motivated, bright, hard-workers who had the ability to be a part of a team. The simple but effective premise is that if you really value your people, they in turn will increase the value of your business.
Although precious metals have not rebounded too strongly yet, the long awaited summer rally could be underway (at least in Gold). Gold is oversold and its sentiment is overly bearish. But it is holding important support in the low $1200s. Silver has begun to rally after breaking down from a triangle consolidation. The gold stocks held up well during recent carnage in the metals but are struggling around very important support levels. The nature of their potential rebound is important as they try and maintain current support.
In recent days Gold has bounced from strong monthly support at $1200-$1210/oz. As the chart shows, that level was monthly support in early 2016 as well as the middle of 2017. It is the key support level between Gold and roughly $1140/oz. Look for this support to hold at least into September.
On the sentiment front, last week Gold’s net speculative position hit 13.9% (as a percentage of open interest) which is a +2-year low. Friday’s report may show a reading close to 10%. Within the context of a downtrend, this is the kind of sentiment (sub 15%) that can be deemed as extreme. Pair that with the strong monthly support at $1200-$1210 and its likely Gold holds this level for at least a few months.
Turning to the gold stocks, while they have held up well in recent months, the technicals suggest some potential trouble if they do not rebound soon.
The HUI Gold Bugs Index which contains only gold miners (no royalty companies) is losing key support within a descending triangle pattern. The pattern projects to a downside target of 149. Upon a close below 163 (which is less than 3% away from current levels), the HUI would hit a 2.5-year low and not have good support until 140.
GDX, meanwhile is showing less weakness but is vulnerable to a decline if it loses support at $21. If that break comes to fruition then GDX has a measured downside target of roughly $16.50-$17.00.
Even though the miners have struggled and Gold has not rallied much in recent days, the path of least resistance for the remainder of the summer should be higher. Gold should continue to hold support in the low $1200s and eventually rally back to $1260 perhaps. While the gold stocks are struggling to hold above support, I’m not sure there is enough selling pressure at the moment to drive them lower.
Hard rock lithium deposits are going to fill the demand as they are more evenly geographically distributed across the globe and are less dependant on a changing climate for production than lithium brine production. They are more and more filling the supply gap.
According the United State Geological Survey’s 2018 Mineral Commodity Summaries, Australia was the largest producer of lithium. It produced 18,700 MT of lithium last year, up 3,300 MT from the previous year. The 34-percent increase has been attributed to two new spodumene operations that ramped up production to meet strong demand.
Hard rock lithium mining relies on traditional methods of drilling and processing, and presents a more reliable method of mining and opens up deposits closest to major markets within. Hard rock mining is giving countries a competitive advantage over countries dependant on lithium brines for production, as it did with Australia.
Here are five exploration companies that are currently looking for the next hard rock deposit.
Azincourt Energy (TSX-V: AAZ)
The company controls 6,368 hectares of pegmatite-rich ground in Manitoba, with historical Li20 numbers & drill-ready targets. Crews are on the ground, beginning prep work for the 2018 work program. Mapping/sampling will get underway, then min 3000m of drilling. Azincourt’s Lithium Two project is adjacent to QMC’s Cat Lake Lithium Project
The company’s properties include the Irgon Lithium Mine project, a Rare-metal (Li-Ta-Cs) deposit within the Irgon pegmatite located immediately north of Cat Lake Manitoba. The deposit contains an estimated resource of more than 1.2M tonnes of spodumene-bearing pegmatite grading 1.5% Li2O.
Far Resources, an exploration and development company, will become a leader in the energy metals sector by defining a lithium resource with their Zoro project located in the Snow Lake region of Manitoba. In 1956, the lithium deposit was considered an historic “reserve” based on the drilling of 1.8 million tonnes grading 1.4% Li2O to a depth of 305 m.
MGX Minerals Inc plans to drill the company’s Case Lake lithium project in May. Drilling will total 8,000 metres followed by an additional 7,000 metres of planned drilling in the fall. There have been 8,400 metres of drilling completed at Case Lake to date. Substantial spodumene mineralization intersections have included:
PWM-17-34: 1.81 percent lithium oxide (Li2O) over 17.0 metres;
PWM-17-33: 2.11 percent Li2O over 11.0 m;
PWM-17-10: 1.74 percent Li2O over 15.06 m;
PWM-17-08: 1.94 percent Li2O over 26.0 m.
The Case Lake property is located in Steele and Case townships, 80 kilometres east of Cochrane in Northeastern Ontario close to the Ontario-Quebec border. The Case Lake pegmatite swarm consists of five dikes. MGX currently has a paid-up 20-per-cent working interest in Case Lake and four other lithium hardrock properties in Ontario controlled by Power Metals
The Cass spodumene pegmatite swarm is located 80 km east of Cochrane and 100 km north of Kirkland Lake, NE Ontario. It is accessible year-round by road via the Translimit Road which connects Ontario and Quebec.
The Oreninc Index fell in the week ending April 27th, 2018 to 37.75 from an updated 45.59 a week ago as the number of deals fell despite some broker action returning.
A calmer and less volatile week all round with the presidents of North and South Korea meeting for the first time in decades, thawing tensions over the north’s nuclear ambitions, whilst in the US, president Donald Trump eased his position on sanctions against Russian aluminium producer Rusal. Maybe spring is in the air and the world is feeling more positive.
Another range-bound week for gold, this time ending in negative territory as the US dollar strengthened, although there are signs that gold stocks are starting to strengthen.
On to the money: total fund raises announced more than quadrupled to C$96.3 million, a four-week high, which included one brokered financing, a four-week low, and one bought deal financing, also a four-week low. The average offer size also more than quadrupled to C$4.8 million, a four-week high. However, the number of financings decreased to 20, a four-week low.
Gold closed down at US$1,324/oz from US$1,336/oz a week ago. Gold is now up 1.63% this year. Meanwhile, the US dollar index continued to strengthen and closed up at 91.54 from 90.31 a week ago. The van Eck managed GDXJ gave up ground and closed down at US$33.03 from US$33.49 last week. The index is down 3.22% so far in 2018. The US Global Go Gold ETF also fell to close down at US$12.99 from US$13.04 a week ago. It is down 0.12% so far in 2018. The HUI Arca Gold BUGS Index closed down at 182.04 from 184.18 last week. The SPDR GLD ETF saw a growth week as its inventory grew to 871.20 from 865.89 tonnes where it had been for nine-days straight.
In other commodities, silver’s recent growth spurt deflated and closed down at US$16.51/oz from US$17.11/oz a week ago. Copper also gave up a lot of ground as it closed down at US$3.06/lb from US$3.15/lb last week. Oil consolidated despite a slight loss on the week to close down at US$68.10 a barrel from US$68.40 a barrel a week ago.
The Dow Jones Industrial Average lost some ground and closed down at 24,311 from 24,462 last week. Canada’s S&P/TSX Composite Index put in a strong growth week as mining stocks showed growth to close at 15,668 from 15,484 the previous week. The S&P/TSX Venture Composite Index closed down at 783.76 from 804.96 last week.
Summary:
Number of financings decreased to 20, a three-week low.
One brokered financing was announced this week for C$15m a three-week low.
One bought-deal financing was announced this week for C$15m, a three-week low.
Total dollars nearly doubled to C$96.3m, a three-week high.
Average offer size grew to C$4.8m, a three-week high.
Financing Highlights
SilverCrest Metals (TSX-V: SIL) announced a C$15 million bought deal financing
Syndicate of underwriters led by PI Financial and Cormark Securities for 7.1 million shares @ C$2.10.
15% over-allotment Option.
Net proceeds will be used to continue exploration and drilling to deliver an updated resource estimate and maiden Preliminary Economic Assessment for the Las Chispas project in Sonora. Mexico.
Major Financing Openings:
Africa Energy (TSX-V: AFE) opened a C$57.98 million offering on a best efforts basis. The deal is expected to close on or about May 4, 2018.
Silvercrest Metals (TSX-V: SIL) opened a C$15 million offering underwritten by a syndicate led by PI Financial on a bought deal basis. The deal is expected to close on or about May 18, 2018.
Pacton Gold (TSX-V: PAC) opened a C$4 million offering on a best efforts basis. Each unit includes a warrant that expires in 36 months. The deal is expected to close on or about May 22, 2018.
Max Resource (TSX-V: MXR) opened a C$3.75 million offering on a best efforts basis. Each unit includes half a warrant that expires in 24 months.
Major Financing Closings:
Nemaska Lithium (TSX-V: NMX) closed a C$99.08 million offering on a best efforts basis.
Trilogy Metals (TSX-V: TMQ) closed a C$31.48 million offering underwritten by a syndicate led by Cantor Fitzgerald Canada on a bought deal basis.
Stina Resources (TSX-V: SQA) closed a C$12.5 million offering on a best efforts basis. Each unit included half a warrant that expires in 36 months.
Ashanti Gold (TSX-V: AGZ) closed a C$2.64 million offering on a best efforts basis.
Company News
Prospero Silver (TSX-V: PSL) provide an update on planned exploration work on its Mexican projects for 2018.
The key objective is to complete first-pass, proof-of-concept drill testing of three projects in the Altiplano belt of northern Mexico: Bermudez, Buenavista and Trias. Neither Trias or Bermudez have been drilled before.
About 6,000m of diamond drilling is planned.
A 4th hole for Pachuca SE project may be drilled once drilling is complete at the projects above.
Analysis
Having recently announced a fund raise, the work plan shows that Prospero will continue to drill test the targets it has identified via its geological hypothesis for discovering large, blind silver deposits. Whilst the news release did not explicitly state that its strategic partner Fortuna Silver (TSX:FVI) would co-fund this exploration program, that seems likely given the technical success of the 2017 exploration program and that Fortuna has yet to select a project to joint-venture under its strategic agreement with Prospero.
ORENINC MINING DEAL CLUB Access to high-quality, pre-vetted financing opportunities www.miningdealclub.com
MEET US AT THE INTERNATIONAL MINING INVESTMENT CONFERENCE MAY 15-16, 2018, VANCOUVER, CANADA Oreninc Presentation: Tuesday, May 15th, 1:00 – 1:20pm
A few weeks ago we wrote that it may not be Gold’s time yet but a few recent developments suggest its time could be sooner than we anticipated. Although Gold failed to breakout last week, we should note the positive action in the miners. Over the past seven trading days the miners have strongly outperformed Gold. That includes the juniors, which appear very close to breaking out of the downtrend that has been in effect for over 12 months.
In the chart below we plot the three major junior ETFs: GDXJ, GOEX (explorers) and SILJ (silver juniors). The juniors have trended lower since February 2017 but are now threatening to break trendline resistance. Since December 2017 the juniors have traded in an increasingly tighter and tighter range which indicates a break is coming very soon. Also, note how the 200-day moving averages are flat and no longer sloping lower. That reflects a mature correction and the potential for a new uptrend if the juniors break above resistance in a strong fashion.
GDXJ, GOEX, SILJ Daily Bar Charts
There are a few other things worth mentioning.
First, as we alluded to, GDXJ has strongly outperformed Gold over the past seven trading days. The GDXJ to Gold ratio has reached its highest mark since the start of February. That sudden relative strength is significant considering Gold is within spitting distance of a major breakout.
Second, one custom breadth indicator we track is the percentage of juniors (a basket of 50 stocks) trading above the 200-day moving average. This figure (currently 42%) has not exceeded 51% since February 2017. A strong push above 51% could confirm a renewed uptrend in the juniors.
If juniors are going to break out of their downtrends, it could mark the start of potentially a very large move. Gold, upon a breakout through $1375, will have a measured upside target of roughly $1700/oz. Although the juniors aren’t very close to breaking their 2016 high, they, upon a breakout would have similar upside potential. GDXJ, upon a breakout through $50 would have a measured upside target of $83.
GDXJ & Gold Necklines
That potential measured upside target for GDXJ may seem extreme but for juniors its par for the course. Below we show an updated chart of our Junior Gold Stocks Bull Analog. By my data, juniors are well below where they were during the 2001-2007 and 2008-2011 bull markets. So if Gold breaks higher and is going to reach $1700/oz then juniors are likely to catch up to historical performance.
TDG Junior Gold Stocks Bull Analog
Although Gold failed to breakout (again) last week, the performance in the gold stocks did not confirm that failure. The newfound relative strength, if sustained over the next few weeks could signal that a sector breakout is much closer than previously anticipated. The juniors are very close to breaking their downtrend and that break could only be the start of a potentially massive move. In anticipation of that potential move, we have been accumulating the juniors that have 300% to 500% upside potential over the next 18-24 months. To follow our guidance and learn our favorite juniors, consider learning more about our premium service.
As Russian/British foreign relations continue to plummet, here at Mining Feeds we feel it’s high time to pursue our monitoring of the continuing internal machinations at our favourite London-listed Russian gold miner, Petropavlovsk (LSE: POG)[1].
Within the past couple of months, the attempted murder of a former Russian spy in a sleepy British town[2], coupled with Britain’s vocal condemnation of Russia’s annexation of Crimea and intervention in Ukraine and Syria[3], along with Britain’s support of the US sanctions against prominent Russians, have plunged London-Moscow relations to an all-time low.
But while diplomatic relations freeze over, shenanigans at Petropavlovsk are heating up.
The dormant current board – who ousted POG co-founders Peter Hambro and Pavel Maslovskiy in a much publicized coup last June, the twists and turns of which were followed here at Mining Feeds[4] – continue to fail on delivering on their transparency pledge[5].
Shareholders will be particularly delighted by the serendipitous exit by Viktor Vekselberg in December of his 22% stake, as the Russian and his Renova Group got shamed this month by stringent US sanctions. Never has a Kazakh been more welcome in London as businessman Kenes Rakishev with his investment in the gold miner.
One of a new breed of Kazakh investor, Rakishev has in many ways been POG’s knight in shining armour, buying up Vekselberg’s old stake. Still little known in the UK, in his home country Rakishev is a recognised and respected entrepreneur, still best known for his investment in Kazakhstan’s Kazkommertsbank and co-ownership of Kazakhstan-focused base metals producer Central Asia Metals Plc (AIM:CAML).
He has a strong history in natural resources in Kazakhstan and, according to the few interviews he has done so far, Petropavlovsk is his first premium listing in London on which he intends to focus a great deal of time going forward. Well, that sure is reassuring after the company’s sorry experience with the still-bewildering “Renova board shake-up then cut-and-run” chapter.
Central Asia Metals is a copper, zinc and lead production and exploration company, with operations in Kazakhstan and Macedonia. Under the direction of Rakishev, its valuation has grown from $100 million to $800 million. Now that’s got to be a track record to thrill any corporate board. So, it is pretty puzzling that POG’s chief appear not to be drawing on their new Kazakh investor’s counsel.
Rakishev has been open about his desire to give Petropavlovsk a fresh start and to bring the sluggish company to a position of growth with a robust M&A strategy to acquire undervalued gold assets across Russia and Central Asia[6], and to bring back the erstwhile Pavel Maslovskiy as CEO, for him to complete his pressure oxidation processing plant at the company’s Malomir mine[7].
Talk to anyone in-country and they will tell you that POG continues to boast an excellent operations team and, along with its underground mining and POX Hub implementation, has the potential to be performing much better than current results suggest.
Worryingly, the board has stayed quiet on its reception of Rakishev’s vision, while offering no vision of its own. Instead, after no action for nine months to strength the company’s leadership team, they’ve announced the appointment of a different CEO with arguably little mining experience: Roman Deniskin, who is due to take the reins next week.
Will shareholders have to wait until the next AGM in June to hear a proper strategy from the board? Or will the new CEO be the breath of fresh air that is so needed? So far, the silence is deafening.
Exploration is at the heart of mining. Nobody can build a mining company without exploration. The greatest mining companies in Africa today invested in top geologists and exploration projects many years ago. The geologists’ brief was simple: hunt down and find the next best deposit. These geologists had flair, a spirit of adventure and a great appetite for taking risks, as had the companies that employed them. Mark Bristow, CEO of Randgold, perhaps epitomises this pioneering spirit best of all. Through continuously investing in exploration, Bristow has been able to find exceptional ore bodies which enabled him to develop extremely profitable mining operations in regions of Africa most were hesitant to enter at the time that he did. Bristow was lightyears ahead of his compatriots. He realised that Africa not only presents huge opportunities, but that exploration is the bedrock on which the African mining industry will be built.
With commodity prices on an upward curve, and a business friendly philosophy taking root in Africa, now is the time to get the hands and boots dirty. Countries like Sierra Leone, Liberia, Zimbabwe, South Africa, Angola and Senegal presents prodigious opportunities for geologists and exploration entrepreneurs. The recent Zimbabwean, Nigerian and Angolan offensives to lure investors has paid off, and more and more junior exploration companies are enquiring about opportunities in these countries. Towards the end of last year (before the regime change), the Zimbabwean government had only awarded three new exploration licenses. Today, a mere five moths later, more than 100 permits have been issued. New Zimbabwean Minster of Mines Winston Chitando, recently assured a room full of investors and exploration companies at the inaugural Harare Indaba in Johannesburg, which I attended, that they would be welcomed back into the country with open arms. More alluring though is Angola, which hosts prolific copper, iron ore, gold and diamond deposits.
Up until now Angola has been a bit of an enigma in terms of mining. But the countries’ new Minister of Mineral Resources and Petroleum, Dr. Diamantino Pedro Azevedo (a mining engineer) presented some enticing information acquired through solid geological surveys at a recent presentation, to which I was invited. What’s more, the Angolan government is now pursuing private investors, in a bid to broaden its mining base.
Barely a month after Azevedo promised that there are great opportunities for exploration, a few Canadian juniors announced that they are wetting their toes in Angolan waters. Moreover, the Nigerian drive to diversify has tempted several explorers to take on that massive unchartered territory. The big constraint though, especially for African exploration companies, remains financing. At the moment their only option is to raise money on the London, Canadian or Australian Stock Exchanges. For now, it seems that African investors just don’t want to walk that extra mile to fund high-risk exploration projects on their own continent, and it’s a shame. Until they do that, it is highly unlikely that we will see homegrown African mining companies dominating the African mining scene.
About Leon Louw:
Leon specializes in African affairs and doing business in Africa, and has been writing about mining in Africa for 8 years. He was born in Johannesburg, South Africa, and has traveled Africa extensively, especially southern Africa. He has a BA degree with a specialization in African studies and an honours degree in Africa Politics. He also have a national diploma in Nature Conservation and an honours degree in Environmental Management. It is is passion to promote business in Africa and I can assist companies that are interested in doing business in African countries.
Lupaka Gold Inc. (TSX-V: LPK) has been completing the necessary steps to achieve commercial production at its wholly-owned Invicta Gold project in Peru, located 120 km north of Lima by road. Recently, I had the opportunity to re-visit the mine site to see how work is progressing towards production.
It is at this point in the life span of a mining company where institutional investors typically invest, and the stock price starts to move back up towards full value, which makes it a good time to invest. Lupaka Gold (TSX-V: LPK) is at this point.
Lupaka secured its necessary financing back in 2016, in order to advance the Invicta gold project through to production, marking an important inflection point for shares in Lupaka Gold (TSX-V: LPK), according to the life cycle of a junior mining share (pictured above).
With financing secured, the company has commenced construction and development work in order to commence production in the second half of 2018, resulting in potential full appreciation for its shares. The Company’s diligence and hard work is starting to bare fruit through the following recent developments:
Fully funded to complete its 6 to 12-month goals, including the start of production at Invicta
Produced a positive PEA on the project with an initial 6 year mine plan
Community agreement in place
Commencement of roadwork to mine site
Building out the in-country team with the appointment of Dan Kivari, P.Eng., as Director of Operations
Mine rehabilitation and construction
Ongoing sampling and surveying
The financing secured in 2016 was through Pandion Finance for a total of $7 million (U.S.), available to the Company in three tranches, all of which have now been drawn. This forward gold sale agreement is repayable to Pandion by delivering a total of 22,680 ounces of gold over 45 months.
Pandion plays a partnership role in development by receiving payment in gold from the actual mine rather than by way of equity or traditional debt structures. It also does not dilute shareholders as would with a financing in the market.
With money in place, now begins the real work.
On March 1, 2018, Lupaka issued a preliminary economic assessment (PEA) which outlined low capital expenditures, an initial mining scenario of 350 tonnes per day (tpd), and a very quick payback and path to cash flow. The strategy is to commence mining in an area close to existing infrastructure and focus on a small portion of the resources within the Aetnea vein. While the current Environmental Impact Assessment allows for up to 1,000 tpd, Lupaka’s approach is to start small and gradually increase production over the next few years.
The PEA boasts all-in sustaining costs of $575 per gold ounce equivalent (“AuEq oz”) over an initial six-year mine life and an average annual pre-tax operating profit of $12.3-million ($1300 gold assumption), very attractive economics at current metal prices. There is no need to state the Internal Rate of Return (“IRR”) as it produces meaningful cash flows within the first year.
The updated mineral resource (part of the PEA) outlines 3.0 million tonnes (“Mt”) of Indicated Mineral resources at 5.78 grams per tonne (“gpt”) AuEq oz using a 3.5-gram-per-tonne cut-off, and 0.6 Mt of inferred mineral resources at 5.49 gpt AuEq oz. The initial six-year mine plan is designed on only a portion of the mineral resource (~0.6Mt at an average head grade of 8.58 gpt AuEq, incorporates existing infrastructure which minimizes capital start-up costs.
The company now has over 24 years of tonnage, in terms of Indicated Mineral resources, mining at the 350 tpd, however management’s goal would be to increase production towards the EIA level of 1,000 tpd, which would increase production from 33,700 AuEq oz/yr up to closer to 100,000 AuEq oz/yr.
At the main portal, the company recently announced sample assay values over the footwall vein averaged 9.86 gpt AuEq over a strike length of 130 metres, with an average width of 6.1 metres. The average sampled grades are in-line, or higher, than grades within the mine plan, based on the PEA. With a combined average width of over 12 metres, the sub-vertical Invicta deposit extends for over 130 metres in strike length on the 3400 level and will be immediately accessible for extraction when the Invicta mine becomes operational in the second half of 2018.
The start small approach also allows the Company to reinvest into exploration in surrounding areas, in order to gain confidence to increase the mine plan, and to prove up new resources to potentially extend production for years to come.
The Invicta mine site is well situated with access to local infrastructure. There is an existing 66 kV transmission line within 29 km of the Invicta property. Additionally, S.N. Power Peru S.A. has a 220-kV electrical transmission line under construction that could provide a backup power source to the 66-kV line. The mine contractor may even choose to supply their own power.
Lupaka has been granted a water use permit from the Peruvian Ministry of Agriculture. Surface rights have been attained, a well has been constructed, and testing studies have concluded it can supply water up to 60 liters per second during the dry season, which should be sufficient supply for an onsite mill in the future.
As part of the agreement that was completed with the community of Lacsanga in July/2017, Lupaka was to undertake and complete certain improvements to the roads, including widening and creation of bypasses around the communities. The company signed a contract with local operators to expand, enhance and modify 27 kilometres of road commencing from the paved Huacho-Churin-Oyon Highway, located at approximately 1,500 metres above sea level, up to the Invicta project located at approximately 3,500 metres above sea level.
This new road will provide access to Invicta for heavy machinery and trucks that can transport large loads of material, reduce travel time, significantly increase safety and minimize the operational impact on local communities. The road will be widened from four metres up to six metres, and a safety berm will be created.
Work is ongoing to ensure that 30-tonne trucks can operate safely and efficiently using North American standards. This involves proper safety berms, passing stations, water drainage, widening hard rock areas using explosives and community by-passes routes.
There is a camp to house workers on site that was built by previous operators. It currently can house about 60 to 70 people, but it is already looking like they will have to expand the camp to accommodate a growing team.
Lupaka announced that development would begin with rehabilitation, preparation at Invicta with three crews, a new adit and 3430 level to be constructed. The Invicta project has approximately of 1.2 kilometres of existing adits, cross-cuts and underground workings.
As you can see below, the cross cut at the 3430 level is in the process of rehabilitation and construction. Over the past few months, work has been advancing to the point the cross cut has approached the main vein wall. Two 4.2-yard PLH Scoops have arrived on site along with a single boom jumbo drill in preparation of accelerated development and stope preparation.
At the lead of operations on site is recently appointed Dan Kivari, P.Eng. (picture in the centre above). He has more than 30 years of international experience in metallurgy, engineering and management of mineral projects throughout various stages of development. Most recently, Mr. Kivari held the position of chief operating officer at Stellar Mining Corp., a privately held mining company in Peru.
Mr. Kivari’s previous work experience includes several senior operating roles such as regional manager for Agnico Eagle Ltd.’s Western and Nunavut operations, where he was responsible for the development of the Meadowbank gold project, and vice-president of operations with Yamana Gold (TSX: YRI) overseeing the development of the Chapada copper-gold project. Throughout this experience, he has picked up the skills necessary to build a team for the Invicta Project.
There is still plenty of work to be done to meet the company’s goal to de-risk and evaluate the suitability of a plant by the second half of 2018. New bulk samples need to be extracted and sent to toll milling facilities to test and optimize metallurgical recoveries and concentrate quality.
A previous run-of-mine bulk test in February 2016 achieved good recoveries in concentrate streams — returning 87.5% gold, 91.2% silver, 91.5% copper, 90.03% lead and 90.1% zinc. The sample was a blend of approximately 80% run-of-mine material and 20% from a low-grade stockpile derived from development.
Looking forward, the company and the geology suggests that there is plenty more to be mined and there is the potential for the construction of a mill which would further reduce the company’s costs and improve any future valuation of the Invicta mine.
From six months ago, the Invicta Gold project is now a completely different scene. Today the roads have and continue to be widened (making them safe), staff and operating equipment is on site and the newly created 3430 Level cross cut has hit the main zone of mineralization.
From an investors perspective, mines moving to production present the greatest investment opportunity because each advancement the company makes de-risks the project and it becomes a question of the operating team to achieve goals on budget and proving the business model works. Lupaka is at this stage and its shares present an opportunity right now.
The hard work is underway at Invicta and the team is already in place to bring it into production, just in time for improving metal prices and the renewed interest in gold. The company appears to be well positioned to bring the project online during the second half of 2018 and meet its objective of becoming cash flow positive in its inaugural year.
Investors can look forward to the following positive catalysts:
Bulk sample results from prospective toll mill facilities
Toll milling agreement
Offtake agreement
Exploration plans and results
Obtaining commercial production at 350 tpd
Engineering and trade-off studies for building a plant onsite
With an all-in-sustaining cost of $575 per AuEq oz over initial six-year mine life, and plenty of resources not yet announced with permits in place to increase production, Lupaka Gold (TSX-V: LPK) is a company to watch.
It is at this stage where investors could see the greatest share price appreciation as the company is on task and working towards becoming a producing gold mine.
February 2018 saw 84 deals close in the Canadian financial markets for an aggregate C$367.0 million at an average of $4.5 million, down 15.2% over January 2018 when 105 deals closed for an aggregate C$432.8 million at an average of $4.32 million.
February saw 14 brokered deals close for an aggregate $250.0 million at an average of $17.9 million. This was up 54.3% from the nine brokered deals in January that closed for an aggregate $162.0 million at an average of $18.0 million.
Within the brokered deals, six bought deals closed in February for an aggregate of $136.7 million deal at an average $22.8 million, an increase of 29.1% over the five bought deals that closed in January for an aggregate of $105.9 million deal at an average $21.2 million.
95 deals opened in February
The top ten deals by size closed in February totaled $230.1 million with gold leading the field taking three spots of the top four spots and five of the top ten. Battery metals cobalt and lithium took three spots.
The top ten deals by size closed in January totalled $241.3 million with graphite, copper and tin leading the field. Gold took three spots of the top ten with cobalt also figuring.
February saw 56 gold deals close for $229.2 million at an average of $3.4 million, up 119.1% in total value terms from the $104.6 million raised in 44 gold deals in January at an average of $2.3 million. The top ten gold deals in February totalled $184.7 million, some 76.5% of the total.
Base metals accounted for $73.6 million of the funds raised in February, some 30.5% of the total, with the top ten deals accounting for $36.7 million with zinc and copper featuring heavily.
Battery metals accounted for $74.8 million of the funds raised in January, some 31.0% of the total and where the top ten battery raises brought in $73.6 million with three cobalt, five lithium one copper and one graphite raises.
#1 Torex Gold$61.7 million
Torex Gold Resources (TSX:TXG) closed a C$61.7 million offering underwritten by a syndicate led by BMO Capital Markets on a best efforts basis.
#2 Orla Mining$30.8 million
Orla Mining (TSXV: OLA) closed a C$30.8 million offering underwritten by a syndicate led by GMP Securities on a bought deal basis. Each unit included half a warrant that expires in 36 months.
#3 eCobalt Solutions$29.9 million
eCobalt Solutions (TSX: ECS) closed a C$29.9 million offering underwritten by a syndicate led by TD Securities on a bought deal basis. Each unit included half a warrant that expires in 18 months.
About Oreinc.com:
Oreninc.com is North America’s leading provider of relevant financing information in the junior commodities space. Since 2011, the company has been keeping track of financings in the junior mining as well as oil and gas space. Logging all relevant deal and company information into its proprietary database, called the Oreninc Deal Log, Oreninc quickly became the go-to website in the mining financing space for investors, analysts, fund managers and company executives alike.
The Oreninc Deal Log keeps track of over 1,400 companies, bringing transparency to an otherwise impenetrable jungle of information. The goal is to increase the visibility of transactions and to show financings activity in a digestible format. Through its daily logging activities, Oreninc is in a position to pinpoint momentum changes in the markets, identify which commodities are trending and which projects are currently receiving funding.
After one of the worst bear markets in history, gold and the gold mining stocks began a new bull market cycle in 2016. With the first 8 months of the year filled with incredible gains, a correction in the market ensued. Of the two, the gold mining stocks were hit the hardest, sending a large portion of the company share prices down or sideways over the last 16 months.
Today, in the 1st quarter of 2018, physical gold continues to show strength, while the gold stocks continue to waiver. Personally, I think the prospects of a change in sentiment toward the gold stocks will happen in 2018, and mark the next leg up in this bull market cycle.
Why do I think this is the case? There are a few reasons:
Lack of interest – In my opinion, the weed and blockchain sectors have captured the attention of the large majority of the speculative investors over the last year. Additionally, I have read numerous articles and headlines which allude to gold losing its luster, which I completely disagree with. I believe this is a sign of a great buying opportunity in the junior gold equities.
1,033 point correction on the DOW – The broader market has been on a tear for roughly 8 years, and up until this 1,033 point correction on the DOW a couple weeks ago, it didn’t appear to be slowing down. It’s my contention that we are seeing an inflection point downwards in the broader markets bull cycle. My guess is that past will be prologue, gold and gold equities will be the major beneficiaries.
Inflation – Although, I do think a correction in the broader market becomes more likely with each passing week, I see tremendous inflation in the future. In my opinion, we are entering a major bull cycle in the base metals, which will inflate the cost of living. Real assets will be sought out to curb the destructive and silent force which is inflation. The caveat to this belief is the adoption of artificial intelligence, which will have a huge deflationary impact on the world. However, I think that is still 10 years away from having a profound impact.
Scarcity and Cost to produce an ounce of gold – As Brent Cook has often pointed out, we are losing approximately the equivalent of the Carlin Trend each year, in terms of gold ounces, and the majority of what we do discover isn’t economic below $1250 USD/oz Au. When the cost of production is more than the price of the commodity, therefore, the price has to eventually go up. I must qualify this statement by saying that, according to regular accounting, gold isn’t scarce, given the fact that more than 95% of all gold that has ever been mined still exists today, albeit in vaults. I don’t, however, foresee gold becoming any less popular as a store of value and, therefore, believe that the scarcity reference is applicable.
Mining is a sector in which the most valuable commodity, for a junior company, is the people. The right people make the right choices no matter what portion of the market cycle they are in. Therefore, picking the right people, in my opinion, gives you a higher probability of being successful with your investments. Bottom line, if you like the metal and its prospects for price appreciation in the future, buy the metal. If you’re willing to do the due diligence, and can handle/manage the risk, there is huge potential in the junior mining stocks.
Which brings me to the company I would like to update you on today, Genesis Metals Corp.
A junior resource company is only as good as its people, and in the case of Genesis Metals, they’ve assembled a great team.
Genesis Metals’ CEO and Chairman, Brian Groves, is a 40-year veteran of the mining industry. Groves has explored in both Australia and Canada, working with AMAX Minerals, Noranda and Manager of Corporate Development at Placer Dome. Moving up the organizational ladder throughout his career, Groves has gained valuable experience in capital markets, project development, permitting and corporate strategy. Today, he leads a group of people who have not only worked together previously, but who have a history of success within the mining industry.
Working hand in hand with Groves is Jeff Sundar, President and Director of Genesis. Sundar has 18 years of experience in the mining industry, having held a VP and Director’s position while working with other Genesis Board members in Underworld Resources. Underworld, in particular, was a great success, as the 1.6 Moz White Gold deposit was sold to Kinross for $140 million. Sundar and the team look to replicate this success with Genesis in the years ahead.
Adrian Fleming, the former President and CEO of Underworld Resources and former VP Exploration of Placer Dome, joins the Genesis team as an Executive Director. Fleming is a Professional Geologist with over 30 years of experience in the mining industry. Some of Fleming’s most notable work experience includes the following:
Former VP Exploration for Placer Dome based in Sydney Australia. Fleming spearheaded Placer Dome into Western Australia, where he directed the group and found the Big Bell Mine.
Fleming co-led the team that found the high grade zone at the monster, 28 Moz gold equivalent, Porgera copper gold deposit, located in Papua New Guinea.
Former VP Exploration for Golden Star in the early 90’s. Fleming directed the team that uncovered the Gross Rosebel Deposit, which has now grown to 17 Moz of gold.
Fleming will be counted on to provide valuable input as Genesis moves forward with a plan to expand its Chevrier Gold Deposit resource, and explore the gold anomalies at their October gold project.
John Florek, the former Senior Geologist at Barrick Gold’s Famous Hemlo Mines, is on Genesis’ Board of Directors. Hemlo was a world-class gold deposit and is credited as being the catalyst for the 1980’s exploration boom. Florek co-led the exploration team that found an additional 2 Moz of gold, which extended the Hemlo mine life. He was also Senior District Exploration Geologist for Placer Dome in Red Lake, and in 2008, his team was awarded the Northwestern Ontario Prospectors award. Florek’s more than 20 years of experience in the mining business as a professional geologist should add great value for Genesis in the future.
Last, but certainly not least, Andre Liboiron is the Exploration Manager for Genesis’ projects, Chevrier and October. Liboiron is a Quebec native with more than 26 years of experience as a geologist in Quebec, as well as internationally.
Strategic Advisor
Robert McLeod, Genesis Co-Founder and former Chairman of Genesis’ Board, relinquished his position because of the heavy time commitment required by his primary focus as CEO of IDM Mining, a near term producer in BC’s Golden Triangle. Given the work history of the members of this management team, however, McLeod has agreed to remain with the company as a strategic advisor.
McLeod is on Casey Research’s Nexten list, which features the top young professionals in the mining industry. A quote taken from Casey Research’s profile of McLeod,
“Luck has nothing to do with it. Rob has the pedigree, the smarts, and the perseverance to have forged a stellar career in mining exploration and company development.” ~ Casey Research
Also, Genesis has added former Laurentian Bank Securities Mining Analyst and Peartree Securities Technical Advisor, Eric Lemieux. Lemieux is a geologist by trade and has 25 years in the mining industry with experience in a variety of areas, such as mineral exploration and project valuation. Lemieux’s addition to the Genesis team should prove advantageous as Genesis looks to develop their properties.
Strategic Shareholders
While the people who run junior resource companies are the core component for investment, looking at the people who choose to invest in the companies is a great gauge for potential value. In Genesis’ case, there are a few heavy hitters who have taken major positions in this junior gold exploration company.
The list of strategic shareholders is headlined by Osisko Mining, which acquired a 6.4% position in Genesis through a private placement announced in 2017. For those unfamiliar with Osisko Mining, they’re a major player in the gold sector, owning strategic positions in a lot of great companies, such as: Falco Resources, IDM Mining and Beaufield Resources. Outside of owning strategic positions in companies, Osisko is exploring their 70,000 Ha Windfall property, which is located in the Urban-Barry Greenstone Belt in Quebec. Osisko is known for their geological expertise and well timed investment in smaller junior gold companies. Their investment in Genesis speaks volumes about Genesis’ potential.
The strategic shareholders list is further headlined by Eric Sprott, who has acquired a 7.2% position in Genesis through a private placement announced in 2017. Sprott is a major player in the resource sector, with a history of successful investments throughout his career. Also, Sprott has multiple Sprott named companies offering various market related products across the sector. Over the last few years, he has taken strategic positions in a few junior gold companies such as Kirkland Lake Gold. Sprott’s investment, like Osisko’s, is a great gauge for potential value in Genesis.
For those who aren’t familiar, the Societé de development de la Baie-James (SDBJ) is a government run organization focused on the development of natural resource projects within Québec. Their mission statement is as follows;
“To promote the economic development, development and exploitation of natural resources, other than hydroelectric resources within the mandate of Hydro-Québec, of the James Bay territory, from a sustainable development perspective. In particular, it may encourage, support and participate in projects aimed at these ends.” ~SDBJ
Additionally, the SIDEX fund, which was created by the government of Québec to support mineral exploration activities within its borders, participated in the latest financing. Having both SDBJ and SIDEX as stakeholders in Genesis is a great sign of political support for Genesis’ Chevrier Gold Project. The strategic shareholders list is rounded out by Delbrook Capital, Gold 2000, US Global Investors and Medalist Capital. These organizations and people represent smart money in the sector and I’m happy to speculate along with them.
6th Best Jurisdiction for Mining Investment in the World
From a jurisdictional standpoint, it doesn’t get much better than Quebec when it comes to mining investment attractiveness. The Fraser Institute (FI) gives Quebec an index score of 85.02, ranking it 3rd in Canada and 6th in the world. FI’s mining investment attractiveness index score is reflective of both the mineral potential and the government policy perception of the region.
Quebec is home to 25 producing mines and over 350 surface mineral mining operations, putting the value of Quebec’s mineral shipments at $8.7 billion in 2014 (Investissement Quebec). Quebec is Canada’s 2nd largest producer of gold, largest producer of iron and zinc, and the only North American producer of niobium. The mineral wealth is evident and is a big reason why FI ranks Quebec among the world’s top ten in mining investment attractiveness.
Highlighting Quebec’s world class mineralization is the Abitibi Greenstone Belt (AGB), which is 150 km wide and stretches 650 km from roughly Wawa, Ontario to Val d’Or, Quebec. The belt has produced millions of ounces of gold over its history, with the Cadillac Gold Camp, Virginiatown, Rouyn-Noranda Gold Camp, and Val d’Or Gold Camp being just a few of its largest contributors.
Source: Genesis Metals
Quebec Politics and Infrastructure
The government of Quebec supports mineral exploration within its borders with a tax credit system that refunds 25% of eligible exploration expenses for non-operating corporations, and 10% of eligible exploration expenses for operating corporations (Financial Incentives). So, roughly, for every $1 spent by a Quebec based mineral explorer, 25 cents will come back to the company, which can effectively be rolled right back into further exploration work. This is not only a huge plus for the company and its shareholders, but an ingenious way for the province to promote mineral exploration.
The long history of mining in the AGB means that most regions of the belt are accessible or near infrastructure such as highways, rail, power, and deep water ports along the St. Lawrence Seaway. Also, Quebec boasts some of the most competitive electricity rates in Canada, as its hydroelectric dams constitute a major portion of its electricity production.
Source: Genesis Metals
Finally, Quebec takes great pride in a transparent mining system, which is built around three key pillars:
“Open access to resources is ensured on the largest possible portion of territory, Mineral rights are granted on a first-come, first-served basis and if a discovery is made, the title holder can be reasonably sure of obtaining the right to develop the resource.” ~ Investissement Quebec
Favourable politics and world class geology – for me, it doesn’t get much better than Quebec, as far as your investment buck goes!
Genesis’ 100% owned Chevrier Gold Project encompasses 120 square km and is located 35 km south of Chibougamau, Quebec, in the heart of the Abitibi Greenstone Belt. Chevrier straddles 15 km of the Fancamp deformation zone, and is 15 km northeast of IAMGOLD’s high-grade Monster Lake gold discovery.
Chevrier has an existing NI 43-101 inferred resource for its Main Zone, which is 300,000 oz of gold at 1.99 g/t (1 g/t cut-off), and is open for further expansion at depth and to the north.
Phase 1 Drilling
Roughly 5,000 metres of drilling was completed in Phase 1 at Chevrier. The focus of the drilling was four fold; confirm historical Geonova drill holes by twinning, complete infill and step out drilling on the existing Main Zone Deposit, and finally, explore other IP and geological targets.
The results of the twinned and infill holes did not disappoint, as they confirm continuity of the shallow gold mineralization within Chevrier’s Main Zone. A full list of drill results can be found on SEDAR, a few of the highlights from the results are:
Twinned hole GM17-09 returned 2.94 g/t gold (Au) over a width of 58.70 m (starting at 74.60 m down hole), which included an interval of 14.01 g/t over a width of 6.35 m.
Hole GM17-20 returned 2.00 g/t Au over 35.20 m within a zone that graded 0.93 g/t Au over 94.90m starting at 91.5 m down hole.
Hole GM17-21 returned 1.13 g/t Au over 38.05 m.
Hole GM17-22 returned 1.06 g/t Au over 24.45 m.
Hole GM17-16 returned 1.06 g/t Au over 14.22 m including: 3.50 g/t Au over 3.22 m.
Using the image below to reference the highlighted holes:
Chevrier Gold Project – 2017 Drilling
Trenching
The IP survey of the property identified a geophysical anomaly roughly 5 km northeast of the Chevrier Main Zone. During the Phase 1 drill program, Genesis completed exploration of this anomaly via trenching. In a news release on October 3rd, 2017, Genesis reported that they had identified a new area of gold mineralization in Trench 29, returning a channel sample of 2.55 g/t Au over 2.3 m. This area will be explored further in the future.
Phase 2 Drilling
On January 22, 2018 Genesis announced the results of its 5,000 metre Phase 2 drill program on the Chevrier Gold Project. The Main Zone was the focus of Phase 2, completing 18 holes of infill and step-out drilling. The results, in my opinion, look good. Check out highlights from the drill program:
8.73 g/t Au over 21.35 m including 37.97 g/t Au over 3.00 m in hole GM-17-42
3.59 g/t Au over 22.60 m in a separate zone in hole GM-17-42
4.26 g/t Au over 19.40 m including 8.99 g/t Au over 7.80 m in hole GM-17-48
4.47 g/t Au over 12.45 m within an interval of 1.08 g/t Au over 84.85 m in hole GM-17-46
5.06 g/t Au over 8.45 m and 1.23 g/t Au over 43.00 m in two intervals in hole GM-17-41
4.53 g/t Au over 13.80 m in hole GM-17-44
1.04 g/t Au over 50.05 m including 1.94 g/t Au over 17.10 m in hole GM-17-44
Putting the results into perspective, remember that the Main Zone’s existing inferred resource has an average grade of 1.99 g/t. The impact of these shallow, higher grade results should be realized in Genesis’ resource update for the project coming later this year.
Additionally, and of particular importance, was the step-out results which came from holes GM-17-45 and GM-17-46. These holes were drilled with the intent of testing for an extension of the mineralization from hole GM-17-09, which was drilled in Phase 1 (refer to the image above for the location).
The results from these two holes reveal a new north-east trending shallow extension of the mineralization discovered in GM-17-09. Specifically, from the drill results table in the news release , GM-17-45 returned a shallow interval (35.4 m down hole) of 63 metres at 0.5 g/t gold, while GM-17-46 returned a shallow interval (19.35 m down hole) of 84.85 metres of 1.08 g/t gold.
PUSH: Announcement of follow up drill program on the Main Zone, focusing on the high grade holes which were discovered in 2017.
PUSH: Chevrier Gold Project resource estimate update in 2018.
Chevrier South Zone
While Chevrier’s Main Zone, with its existing Inferred Resource, has garnered the bulk of drilling over the history of the Project, I believe there’s the possibility of some great results from Chevrier’s South Zone. Why? Although the South Zone doesn’t have an existing 43-101 resource, Met-Chem’s comments within the technical report state,
If you express the 8.5 million tons of mineralized material at 1.8 g/ton, you get 459,000 ounces of gold. Met-Chem’s reference to the possible resource size of the South Zone deposit is based off a small historical drill data set and its similarities in alteration and deformation like the Main Zone. The fact is, the South Zone needs further drilling before a 43-101 complaint resource can be officially estimated.
As Genesis intends to update the Chevrier Gold Project resource estimate in 2018, I believe there’s a good chance that we could see them refocus their attention on the Project’s South Zone. Given Met-Chem’s comments, I believe there’s good reason to believe drilling within the South Zone could have a tremendous impact on the updated resource estimate for the entire Project.
In my opinion, the updated resource on the Chevrier Gold Project, which will include both the Main and South Zones, will exceed 1 million ounces and should set Genesis up for a market re-rating, as its current sub $10 million MCAP doesn’t reflect the potential of what it possess.
PUSH: Watch for the announcement of a drill program on Chevrier‘s South Zone. The results from a South Zone drill program could have a major impact on Chevrier’s updated overall resource estimate.
October Gold Project
Genesis also owns 100% of the 203 square km October Gold Project, located in the southern Swayze greenstone belt in Benton Township, Ontario. This project is located 35 km northwest of IAMGOLD’s Cote Lake deposit, and 50 km southeast of Goldcorp’s Borden Gold Deposit. The Cote Lake Deposit was purchased by IAMGOLD from Trelawney Mining for $585 million, while the Borden Gold Deposit was purchased by Goldcorp from Probe Mines for $526 million. This demonstrates how coveted this Ridout Deformation Zone is, and Genesis’ October Gold Project is right in the middle, and on trend.
IAMGOLD announced in a press release on June 5, 2017 that Sumitomo Metal Mining has acquired a 30% undivided participating joint venture interest in IAMGOLD’s ownership interest in the Cote Gold Project for an aggregate $195 million. Sumitomo’s interest in this area of Northern Ontario should bring more attention to the surrounding land claim owners, one of which is Genesis’ October Gold Project.
The October Gold Project straddles what is considered the western extension of the Larder Lake-Cadillac Deformation and a portion of the Ridout Deformation zone. Historic gold deposits on these deformations, Kirkland Lake and Kerr Addison-Chesterville, have historic gold production north of 49 Moz.
The October Gold property saw surface exploration work in 2011. The program comprised of Soil Gas Hydrocarbon (SGH) sampling and reconnaissance level gravity geophysical surveys.
“A SGH survey is a deep penetrating geochemical method that involves the analysis of various hydrocarbons associated with ore bodies at depth using a forensic and comparative approach for Identification. “ ~ Genesis
The program has identified two gold anomalies, which Actlabs, the interpreting laboratory, says have a high degree of confidence. This confidence is based on comparisons with other surveys that Actlabs has completed on other gold deposits. These anomalies will see future surface work which should better define where the diamond drilling should take place.
The October Gold project property is early stage, but holds very promising gold exploration potential.
Concluding Remarks
The Genesis Metals story is not without risk, as any gold exploration company runs the risk of not finding anything or not finding mineralization which is economic. In Genesis’ case, I believe further modelling of the gold grade distribution within the Main Zone, should feed nicely into Chevrier’s updated resource estimate later this year. While on the exploration side, drilling on Chevrier’s South Zone appears to be very promising.
Outside of the risk of exploration, Genesis has some compelling facts that make their story undervalued in comparison to the paltry sub $10 million MCAP that they currently possess, including:
A proven management team: Groves, Sundar, Fleming, Florek, Liboiron and Mcleod
Strategic Shareholders List Headlined by: Osisko Mining, Eric Sprott, Delbrook Capital, Gold 2000, US Global Investors, SIDEX/SDBJ and Medalist Capital
Located in the 6th best jurisdiction in the world, Quebec
PUSH: Announcement of a follow up drill program, focused on Chevrier’s Main Zone high grade drill holes, which were discovered in 2017.
PUSH: Announcement of a drill program focused on Chevrier’s South Zone in 2018.
PUSH: 2018 Chevrier Gold Project Resource Estimate Update – In my opinion this estimate could exceed 1 million ounces of gold.
Great bang for their drilling buck, as their all-in drill costs thus far have roughly averaged $220 per metre
Large land package with exploration potential, Chevrier Gold Project and October Gold Project
The next leg of the gold bull market is upon us, fortunes will be made in the coming years by buying right and sitting tight, investing in companies that look to add value for their shareholders. Genesis Metals (GIS:TSXV) is a great example of this and is a company in which I’m investing.
Don’t want to miss a new investment idea, interview or financial product review? Become a Junior Stock Review VIP now – it’s FREE!
Until next time,
Brian Leni P.Eng
Founder – Junior Stock Review
Disclaimer: The following is not an investment recommendation, it is an investment idea. I am not a certified investment professional, nor do I know you and your individual investment needs. Please perform your own due diligence to decide whether this is a company and sector that is best suited for your personal investment criteria. I do own Genesis Metals Corporation stock. All Genesis Metals Corporation analytics were taken from their website and press release. Genesis Metals Corporation is a Sponsor of Junior Stock Review.
View of the water from Baie Verte
The research I did on Newfoundland and Labrador as a destination for mineral exploration and production had me excited to see, in person, if the province would deliver. On October 23rd, I visited Rambler Metals and Mining, and specifically their Ming’s Mine site, which sits roughly 15 minutes from Baie Verte.
Before getting into my visit to Rambler, I want to give you a quick intro to the Baie Verte Peninsula’s mining history and, in particular, a story of how Canada’s smallest town came to be.
Tilt Cove
Tilt Cove is currently the smallest town in Canada; with a population of just 6 people, it sits just a few kilometers from Rambler’s Nugget Pond Mill. The story of how Tilt Cove came to be varies depending on who you speak to, but here’s a brief summary of what I was told.
The story begins with a man named Issac Winser. Winser was a fisherman, who frequently fished the waters surrounding the Baie Verte Peninsula. In a chance encounter on the water between Winser and another man, Smith McKay, McKay noticed Winser was in possession of a large metallic rock, which he was using as an anchor for his boat.
Curiously, McKay took a closer look at the bluish green coloured rock and asked Winser where he had found it. Winser said he’d found it on the shores of the Tilt Cove area, and that there was a great deal more sticking out of the cliffs.
McKay, having a mining background, recognized the rock to be copper ore and later made his way to the Tilt Cove area to set up a mining operation, where he and his team mined the copper ore by hand. The Tilt Cove town was quickly established and grew from a town of 3 families in 1863 to a town of over 700 inhabitants by 1869.
In the Nugget Pond Mill offices, there is a copy of a very old Tilt Cove grocery store flyer advertising sale items. Additionally, the town’s prosperity even brought a movie theatre to the area and many other unexpected perks for such a small community in northwestern Newfoundland and Labrador.
Institutional Shareholders – CE Mining 72%, Lombard Odier 6%, CI Global Investments 5%, Tinma International 4%
Ming’s Mine and Nugget Pond Mill
Rambler Metals and Mining owns 100% of its 1640 ha property, which is home to the Ming Mine and Nugget Pond Mill. Rambler’s operation is expanding its underground operation by blending ores from the Lower Footwall Zone with the current mining from the massive sulphide zones to produce roughly 16 million pounds of copper annually, at a cost that’s below $2 USD per pound, giving the operation good upside potential against a rising copper price.
The Ming’s Mine has a total Proven and Probable Reserve of 8.7 million tonnes at 1.79% copper and 0.48 g/t gold, for a total of 341.2 million lbs of copper and 133.5 K oz of gold. All zones of the deposit remain open at depth.
Ming Mine – New portal cover installed as part of the ventilation upgrade project
Currently, the mine is targeting 1250 mtpd, which will help drive down costs and allow Rambler to maximize their profits in what appears to be a strong future market for copper prices. Rambler’s corporate presentation gives us a glimpse of their sensitivity to a rising copper price – below is the graph.
Although the mine site is closer to Baie Verte, where I was staying, we started the site visit at the Nugget Pond Mill, which sits roughly 40km away from the mine site, near Canada’s smallest town, Tilt Cove.
The Nugget Pond Mill is located 10km off the 414, and is at about the 5km mark where the road breaks in two. On your left, you head to Snook’ Arm, and to your right, our destination, Nugget Pond.
Ming Mine – Truck being loaded with Copper Ore
Rambler purchased the Nugget Pond Mill in October of 2009 for $3.5 million CAD, which, at the time, was owned by Crew Gold Corporation. Crew was using the mill to process their gold ore, which was mined at their Nalunaq Gold Deposit in Greenland.
NOTE: The Nugget Pond Mill was originally built back in 1996 by Richmond Mines to mine the Nugget Pond deposit. When that ore body was depleted, Richmond movedto the Hammerdown mine, near Springdale, and mined, trucked and milled the ore at the Nugget Pond mill.
Nugget Pond Mill – Truck dumping a load of Copper Ore for Processing
The bulk of my site visit was spent at the Nugget Pond Mill, where I was given a detailed overview of the operation by the Mill Superintendent, Dwight Goudie. I then toured the facility, where I met with a couple of operators, Chester and Andrew, who took me through their respective operations and explained to me how the process works and the key parameters that they monitor.
Nugget Pond Mill – Operator Andrew, holding a piece of Dry Copper Concentrate
I was very impressed at the level of knowledge which both operators displayed. Clearly, they are both fully engaged in the whole process and take great pride in what they’re doing. Speaking from experience, getting and maintaining this sort of engagement isn’t always easy, but pays huge dividends to a company that can sustain it.
Future Growth
Rambler is steering towards a definitive engineering study with regards to an expansion of the mining process, in which their target is to achieve a production rate of 2,000 mtpd, Phase III. An increase to this level of production should lower costs, ergo giving even more potential protection against a falling copper price or upside potential in a rising copper price market.
Along with a longer term production goal of 2,000 mtpd, Rambler’s Chief Exploration Geologist, Larry Pilgrim, mentioned that they are targeting further exploration of the deposit, down plunge, as all zones remain open at depth. In particular, the Ming North Zone remains largely unexplored and will be the exploration focus of the future. A surface drill program is also underway targeting the down plunge extension of the Lower Footwall Zone.
This surface drilling has been successful in expanding the LFZ zone as well as expanding the massive sulphide zone (Ming South zone). A September news release highlighted some of the results from the first hole.
Ming Massive Sulphide (MMS) – Upper lens 1.02 m of 1.63% Cu and 1.23 g/t Au and Lower lens 6.30 m of 2.85% Cu and 2.99 g/t Au
Lower Footwall Zone (LFZ) – 40.0 m of 1.42% Cu, including 6.0 m of 2.51% Cu and 7.57 m of 2.27% Cu
Results from the second hole are expected in the next couple of weeks.
NOTE: Pilgrim is a native Newfoundlander with a lot of experience in the mining industry. He mentioned that western Newfoundland, right up the Baie Verte Peninsula, had enough prospective geological targets to last him 3 lifetimes. I mention this because it appears we have only hit the tip of the iceberg in Newfoundland and Labrador’s exploration potential, which is great for the future of mining within the province.
Ming Deposit – Slide from Rambler Corporate Presentation
In a news release on June 27 of this year, Rambler reported some great drill results from the Ming North Zone, which aren’t included in the current resource or reserve calculation. Some highlights were: R17-675-04: 4.00m of 3.17% Cu with 6.56 g/t Au, R17-675-05: 21.00m of 3.1% Cu with 1.13 g/t Au and R17-675-07: 17.97m of 2.79% Cu with 1.73 g/t Au. At the very least, the drill results show the potential to help replace the depleted reserves and, on the upside, show the potential to expand the resource and/or reserves in the future.
Concluding Remarks
I think it’s undeniable that the world is moving away from the use of fossil fuels as an energy source. In the coming years, alternative non-carbon emitting energy sources, such as solar and wind, appear as though they will have a larger footprint in energy generation. With this movement will come the need to store and transmit electricity on a far larger scale than we are today.
Thus, in my opinion, a major disruption in the primary battery metals and copper markets is destined to come. In saying this, positioning yourself in high quality companies such as Rambler Metals and Mining, could prove to be a good investment in the years ahead.
Don’t want to miss a new investment idea, interview or financial product review? Become a Junior Stock Review VIP now – it’s FREE!
Until next time,
Brian Leni P.Eng
Founder – Junior Stock Review
Disclaimer: All statements in this report, other than statements of historical fact should be considered forward-looking statements. These statements relate to future events or future performance. Forward-looking statements are often, but not always identified by the use of words such as “seek”, “anticipate”, “plan”, “continue”, “estimate”, “expect”, “may”, “will”, “project”, “predict”, “potential”, “targeting”, “intend”, “could”, “might”, “should”, “believe” and similar expressions. Much of this report is comprised of statements of projection. These statements involve known and unknown risks, uncertainties and other factors that may cause actual results or events to differ materially from those anticipated in such forward-looking statements. Risks and uncertainties respecting mineral exploration companies are generally disclosed in the annual financial or other filing documents of those and similar companies as filed with the relevant securities commissions, and should be reviewed by any reader of this newsletter.
Brian Leni is an online financial newsletter writer. He is focused on researching and marketing resource and other public companies. Nothing in this article should be construed as a solicitation to buy or sell any securities mentioned anywhere in this newsletter. This article is intended for informational and entertainment purposes only!
Be advised, Brian Leni is not a registered broker-dealer or financial advisor. Before investing in any securities, you should consult with your financial advisor and a registered broker-dealer.
Never, ever, make an investment based solely on what you read in an online newsletter, including Brian Leni’s online newsletter, especially if the investment involves a small, thinly-traded company that isn’t well known.
Brian Leni’s past performance is not indicative of future results and should not be used as a reason to purchase any stocks mentioned in his newsletters or on this website.
In many cases Brian Leni owns shares in the companies he features. For those reasons, please be aware that Brian Leni can be considered extremely biased in regards to the companies he writes about and features in his newsletters. You should conduct extensive due diligence as well as seek the advice of your financial advisor and a registered broker-dealer before investing in any securities. Brian Leni may buy or sell at any time without notice to anyone, including readers of this newsletter.
Brian Leni shall not be liable for any damages, losses, or costs of any kind or type arising out of or in any way connected with the use of this newsletter. You should independently investigate and fully understand all risks before investing. When investing in speculative stocks, it is possible to lose your entire investment.
Any decision to purchase or sell as a result of the opinions expressed in this report will be the full responsibility of the person authorizing such transaction, and should only be made after such person has consulted a registered financial advisor and conducted thorough due diligence. Information in this report has been obtained from sources considered to be reliable, but we do not guarantee that they are accurate or complete. Our views and opinions in this newsletter are our own views and are based on information that we have received, which we assumed to be reliable. We do not guarantee that any of the companies mentioned in this newsletter will perform as we expect, and any comparisons we have made to other companies may not be valid or come into effect. Brian Leni does not undertake any obligation to publicly update or revise any statements made in this newsletter.
Brian Leni does not have a business relationship with Rambler Metals and Mining. Brian Leni does not own shares in Rambler Metals and Mining.
If you’re looking to take your due diligence process to the next level, you have to incorporate a site visit into your repertoire. All the analysis in the world can’t replace the effectiveness of seeing a project and meeting the people in person.
Not only can you confirm what the management team is telling you, but you can meet the people who are on the front lines, mining underground, driving loaders, collecting soil samples or simply answering the phone in the office. All of this can tell you a lot about the health of a company and how it treats its employees, which is paramount to the company’s success, in my opinion.
In October, I had the opportunity to visit Anaconda Mining’s Point Rousse Project, and was not surprised to see that Anaconda’s leadership makes it a priority to empower their workforce. For this, they’re paid back through a motivated workforce.
I returned from my visit to Newfoundland and Labrador very satisfied that Anaconda’s operational team has the right ingredients for success; they look set to put the Stog’er Tight Deposit into production, produce a maiden resource estimate for the Argyle Zone, and explore and develop the Goldboro Project toward production.
2018 looks to be a monumental year of growth for Anaconda, one that I look forward to as a shareholder!
Anaconda Mining – Site Visit October 2017
On the morning of October 22nd, I flew out of Toronto’s Pearson International Airport on my way to Deer Lake, located in western Newfoundland and Labrador. While I was here, I had the opportunity to visit Anaconda Mining’s Point Rousee Project, located on the Baie Verte Peninsula in north western Newfoundland and Labrador.
Gros Morne National Park – Western Brook Trail
The western portion of the island of Newfoundland, while sparsly populated, possesses, in my opinion, some of Canada’s most spectacular scenery and destinations. I landed in Deer Lake, an interesting town because it’s home to western Newfoundland and Labrador’s major airport, and compared to many of the other areas in this part of the island, it’s also well developed on a commerical level.
Most importantly, however, it’s the largest centre next to Gros Morne National Park, and acts as a jumping point for people looking to explore this UNESCO world heritage site.
On the last day of my trip, I spent the day hiking a few of the trails in Gros Morne and was amazed by the scenery – this is a place you will want to add to your bucket list, you won’t be disappointed!
Baie Verte, Newfoundland and Labrador
Baie Verte – HWY 410 thru the main part of town
Baie Verte – A view from Bistro on the Bay
Baie Verte is a small town located on the coast of the Baie Verte Peninsula. Baie Verte’s history as a town is rooted in the pulp and paper industry, but owes its major growth to the asbestos mine which was founded in 1955 by George McNaughton and Norman Peters.
Asbestos Open Pit Mine – 1963 to 1995
The open pit asbestos mining operation, which is located a short drive north of Baie Verte, employed 500 people at its peak. The mine was operated by a number of companies throughout its history, including Advocate Mines Ltd., Baie Verte Mines Inc., and Teranova. The mine was closed permanently in 1995.
While there are other employers in this region of Newfoundland, I definitely got the feeling from speaking to a few of the residents that, outside of being employed by government, mining was the most desirable industry in which to work.
The mining operations that are closest to Baie Verte are Anaconda Mining’s Point Rousse Project and Rambler Metals and Mining’s Ming Mine and Nugget Pond Mill. The two companies, in total, employ roughly 400 people in the surrounding area.
Depending on your speed, it’s roughly a 2 hour drive from the Deer Lake airport to Baie Verte. I spent two days in Baie Verte, staying at the Dorset Inn, which is right in the heart of town. From here, Anaconda’s Point Rousse Project is about a 30 minute drive on the 418, which leads to the town of Ming’s Bight.
The Point Rousse Project
The Point Rousse Project is a collection of Anaconda’s Newfoundland assets, which include the Pine Cove Mine and Mill, the Stog’er Tight Deposit, the Aggregates Project and over 5,800 ha of prospective property.
The Point Rousse Project is located down a very well kept gravel road, about 5 km off the 418. The road makes its way through the forest, up and down hills, until reaching the site’s main offices to your left, and tailings pond to your right. Elevation-wise, the main offices, mill and tailings pond are set roughly 75 to 100 ft above the top of the Pine Cove open pit, and probably another 75 to 100 ft above the sea level at the Port Facility.
During my visit, I was accompanied by the Mine and Mill Superintendent, Tony Chislett. Chislett has been with Anaconda for 10 years, working in a few different roles before becoming Superintendent. In my experience, the best operation managers typically work their way up to the position after having extensive experience in the various jobs that they are going to manage. This not only gives them the much needed knowledge of the process, but also the respect of the workers.
Chislett and his team will be put to the test in the coming months with the conversion of the Pine Cove open pit mine to a long term tailings facility and the start up of the Stog’er Tight Mine, which should occur in early 2018. Not only this, but on the horizon there is the possible processing of the Goldboro ore, which will be an extra wrinkle for the team to deal with, as the Goldboro ore is different from what is mined along the Scrape Trend.
Pine Cove Mine and Mill Superintendent, Tony Chislett
As we drove around the property, Chislett gave me a break down of the operation, and how they have incorporated cutting-edge technology and their personnel’s input to improve the process. For instance, GPS targeting for blasting and on the company’s heavy equipment allows for precision mining and the ability to maximize efficiency with the flow of ore to and from the open pit to the mill. With the movement to Stog’er Tight getting closer, these technologies, I believe, will aid Anaconda in avoiding some of the pitfalls that could accompany the mining operation’s move.
Pine Cove Open Pit Mine– Dump Truck Driving Up the Ramp
Pine Cove Open Pit Mine – Mining of Gold Ore from the Bottom of the Pit
Stog’er Tight Deposit – Located in Close Proximity to the Pine Cove Mill
Scrape Trend
While the Stog’er Tight Deposit looks to become Anaconda’s next producing asset, there are many more prospective targets located in what is called the Scrape Trend.
Source: Anaconda Mining
In the image above, you can see the exploration targets listed from 1 to 4. Starting on the left-hand side of the image with #1, is Anaroc, which is located in close proximity to the Pine Cove open pit mine. Next, #4 is Corkscrew Road, followed by the #2 Connector and, finally, #3 the most explored of the targets, the Argyle Zone.
Argyle Zone
Fifty-two holes have been drilled at the Argyle Zone, totalling 4,860 meters. The strike length is over 600m and 225m down dip. To date, here are some of the drill highlights at the Argyle Zone: 6.09 g/t over 8.9m (AE-16-11), 9.31 g/t over 6.0m (AE-16-39) and 3.63 g/t over 12.0m (AE-17-46).
In a recent news release, Anaconda announced a flotation recovery of 97.3% and a leach recovery of 94.5% for a combined recovery of 91.9% of a 25 kg sample of blended core samples from Argyle, with an average grade of 2.69 g/ton gold.
Additionally, Anaconda’s geologists have identified other targets to the south and along strike using geophysical data.
Source: Anaconda Mining
PUSH: A maiden resource estimation for the Argyle Zone is expected to be announced in December 2017. Additionally, Anaconda’s team is working on an environmental assessment application, conducting metallurgical and ARD testing and government consultations.
Aggregates Project
Deep Sea Port which Facilitates the Aggregate Shipments
While not a focus for Anaconda, the cash and the removal of waste rock that the Aggregates Project provides is a huge plus for the company. The Aggregates Project and the proposed use of some of the larger waste rock as armour stone is a testament to the innovation that Anaconda’s leadership has instilled in their workforce.
With the first Aggregates Project contract having just expired, Chislett mentioned that they intend to negotiate additional contracts in the future. In the last fiscal year ending on May 31 2017, the project generated $0.9 million.
The Goldboro Project
From the first time we met, Anaconda’s CEO, Dustin Angelo, has told me that Anaconda has lofty goals for expansion, as they intend on becoming a 50,000 ounce per year gold producer. To more than triple their current production rate, they will, without a doubt, lean heavily on their latest acquisition, the Goldboro Project, which is located a couple of hours northeast of Halifax, Nova Scotia.
In recent news, Anaconda was able to raise $3 million dollars in a non-brokered private placement. VP of Exploration, Paul McNeill, says roughly half will be put toward further exploration and development at Goldboro.
In a news release on November 1st, Anaconda announced a 6,000m diamond drill program, focusing on the Boston Richardson and East Goldbrook gold systems. The goal of the program is to expand the mineral resource along strike and down plunge, while also completing infill drilling in specific portions of the deposit as they look to move some of the Inferred resource up to the Measured and Indicated categories.
Goldboro IP Chargeability Map
In the same release, Anaconda reported that initial drill core observations support the thesis that the Goldboro Deposit continues at depth, as the first diamond drill hole (BR-17-06) intersected the geological structure hosting the Boston Richardson System between 400 to 475 meters, which is 75 meters below the current resource model.
Goldboro Deposit Vertical Longitudinal Section
PUSH: Drill results from the recently commenced 6,000m diamond drill program. Expansion of the resource at depth and along strike has the potential to do great things for the economics of this project. Pay close attention to drill results coming in the weeks and months ahead.
PUSH: Additionally, a PEA is scheduled to be completed by the end of this year, the economics of which could be enhanced with further expansion of the Goldboro Deposit.
Anaconda possesses a proven team with a track record for success in mining. I believe that Goldboro will be the next feather in their cap, as they look to develop the Project into a producing mine. For a detailed look at Anaconda, check out my last article here.
Concluding Remarks
Before my visit, I felt the future was very bright for Anaconda. After seeing their Point Rousse Project in person, I’m convinced Anaconda is a company that is dedicated to empowering its people. It has not only survived the depths of the recent bear market, but has emerged in this new gold bull market as a premier gold producer, set to grow in the coming years.
I’m looking to add to my position in Anaconda in the weeks ahead, and see weakness in the share price as an opportunity. Putting it all together, there’s a lot of news flow to watch for in the coming weeks and months, which could provide some PUSH for the stock price:
Results from the 6,000m diamond drill program at the Goldboro Project. They are looking to expand along strike and at depth.
Completion of a PEA on the Goldboro Project by the end of 2017
Stog’er Tight Deposit will begin production in early 2018
Maiden Resource Estimation announcement on the Argyle Zone in December 2017
Don’t want to miss a new investment idea, interview or financial product review? Become a Junior Stock Review VIP now – it’s FREE!
Until next time,
Brian Leni P.Eng
Founder – Junior Stock Review
Disclaimer: The following is not an investment recommendation, it is an investment idea. I am not a certified investment professional, nor do I know you and your individual investment needs. Please perform your own due diligence to decide whether this is a company(s) and sector that is best suited for your personal investment criteria. Junior Stock Review does not guarantee the accuracy of any of the analytics used in this report. I do own Anaconda Mining Inc. shares. Anaconda Mining Inc. is a Sponsor of Junior Stock Review.
If you mention Ecuador in mining circles, you will get some raised eyebrows and mumbled cuss words from Canadian mining executives. This is because of Ecuador’s reaction in 2013 that looked like resource nationalism which resulted in a moratorium on mining activity and a hefty tax on profits. Ecuador’s infamous windfall profits tax and a series of other unfavorable provisions made almost any mining project unprofitable
The windfall profits tax was a 70-per-cent levy on excess profits, the terms of which, such as what are excess profits, had previously been subject to negotiation between company and government, leading to an uncertain business environment.
However, lessons were learned and Ecuador hopes to position itself as the up-and-coming mining investment destination in Latin America. The Ecuadorian government hired consultants Wood Mackenzie to provide recommendations and the country is adopting them quickly.
Ecuador, which depends on crude oil for half its national budget, is seeking to drum up more foreign investment after the recent crude price slump slashed government revenue. The government in 2015 separated the mining ministry from its oil ministry and announced plans to promote 36 projects to produce gold, copper and molybdenum estimated to be worth US$200bn.
It started in 2013 when Kinross Gold (TSX: K) walked away from the negotiating table after two years of fruitless talks with the Ecuadorian government over the investment conditions for the Fruta del Norte (FDN) project, one of Latin America’s biggest undeveloped gold deposits.
It also didn’t help that shortly before, IAMGOLD (TSX: IMG) had sold its Loma Larga project and left the country, and shortly afterwards, International Minerals sold its Río Blanco gold project and also said goodbye.
Kinross’ decision telegraphed to investors that negotiations with Ecuador were difficult and indicated to the country that its mining framework was not working. In exasperation and desperation, Kinross sold the construction-ready Fruta del Norte in 2014 for US$240 million, close to a quarter of what it paid to acquire the project in 2008.
Kinross bet on FDN and lost. The same year that Lundin Gold (TSX: LUG) bought the project, Ecuador embarked on a mission to make its mining framework more competitive and attractive.
Lundin obtained approval for the FDN environmental impact study in October 2016 and in December signed an exploitation agreement and an investment protection contract with the government. Construction of the 340,000 ounces per year mine has begun.
Lenin Moreno, who took office as President in May 2017, wants to attract US$4.6 billion in investment over his term in office for large-scale mining projects from companies including Lundin Gold, EcuaGold Mining, INV Metals, EcuaCorriente, Cornerstone Capital Resources (TSX-V: CGP), BHP Billiton and China Explorcobres. The investments hope to quadruple employment in the mining industry through 2022, according to Wood Mackenzie.
Two Chinese-owned mines are due for startup in the near term; the large-scale Mirador copper mine, controlled by the CRRC-Tongguan consortium, and the smaller Río Blanco, now operated by Junefield Mineral Resources.
There is a resurgence in exploration with several junior mining companies increasing activity in the country. Ecuador is looking to create a mining venture exchange. The plan is to link trading in junior mining stocks on the Toronto and Quito exchanges as part of a bid to finance US$488 million in exploration, the mining ministry said.
“We’re democratizing the industry. Local investors will be able to invest in mining, which is becoming a prosperous sector,” says deputy industrial mining secretary Henry Troya. “We’re building a sustainable industry.”
Other countries have gone down this road; Peru’s pioneering Lima venture exchange managed to list a dozen exploration companies at its height, including Karmin Exploration (TSX-V: KAR), Duran Ventures (TSX-V: DRV) and Red Eagle Mining (TSX-V: R). Santiago followed its example with its own venture exchange in 2014. However, with scant data on these exchanges, the scale of participation from Peruvian and Chilean retail investors is yet to be proved.
Ecuador has started to awarding exploration concessions after a hiatus of some six years, mines minister Javier Cordova told Mining Journal. Ecuador has overhauled its mining concessions registry and 237 concessions have been awarded to date to local and international mining companies, according to the ministry.
The ministry aims to boost mining exploration investment to US$600 million by the end of the year according to the newspaper El Telégrafo, citing Troya’s presentation at a mining conference in Quito. At least 27 companies have set up offices in Ecuador this year, including BHP Billiton, Newmont Mining, Fortescue Metals Group, Hancock Prospecting and Newcrest Mining.
The ministry is tracking mining exploration projects including Codelco-Enami JV Llurimagua and Cornerstone’s Cascabel. Ecuador’s mining chamber is further pushing the government to change both a tax on windfall profits and a capital gains tax to make the industry more competitive.
Improvements to the tax code that were implement in 2016 include: windfall tax cannot apply until after four years have passed since investment payback and an equal base price applied for all projects. These are some reforms and there is plenty of way to go.
With big pushes, often come big push backs, the question remains whether Ecuador can commit to mining reform and development without a backlash from its residents, it has happened in the past.
Mining is cyclical and investors need to make hay while the sun shines. Timing is everything and it appears senior Canadian mining companies are missing out on a period of economic optimism in the Ecuadorian mining industry after bearing the brunt of an unreceptive local climate in the past. Ecuador has made significant reforms and be sure there will be a lot of exploration news coming out of this region.
Eight Colombian municipalities banned mining in their jurisdictions after local referendums won a majority vote in support of banning mining.
A series of municipalities across Colombia this year have demonstrated an overwhelming support for curtailing mining activities within their regions; a serious concern for investors and resource companies after the government of Colombia has been encouraging development to further build the peace with FARC.
An important sector that will benefit from the peace will be the extraction industries, especially the gold mining industry. During the years of conflict, the gold industry was plagued by internal criminal activity with unlicensed illegal mines bringing in approximately $7bn per year for armed groups and other criminal factions. The illegal mining also damaged the environment through polluting the water with substantial amounts of mercury used to separate gold from other minerals.
In an effort to clamp on down the violence and environmental damage of illegal mining, the government of Colombia has been encouraging foreign investment into the mineral industry while encouraging local governance in an effort to build the peace. FARC agreed to disarm but they have moved from the battlefield to politics, and with them come a very strong anti-development stance against foreign resource companies. Not all opposition to development is politically motivated but it also a part and parcel of changes to the mining code and as communities are experiencing control over projects for the first time.
The first vote of this year, held in February, took place in Cabrera with seven other municipalities followed to ban mining in their territory, according to Colombia Reports. Residents of Colombian municipalities have expressed a growing concern over the environmental impacts of mining on their towns––while some that farm for their livelihood are worried of how this may also impact crops nearby mining locations.
Colombia’s mining code had prohibited local authorities from suspending projects in their region, according to Bloomberg. A ruling enforced by Colombia’s Constitutional Court last year made these votes possible, as the ruling overturned the Colombian government’s exclusive authority to authorize mining projects. Now local politicians or residents that have obtained a certain number of signatures can call a referendum, reported Bloomberg. A mine or oil field that was already licensed to produced would not be impacted by the vote.
Residents of Cajamarca, located in the municipality of Tolima made headlines in March. The vote to man mining froze the current La Colosa project, controlled by AngloGold Ashanti, a gold mining company from South Africa. AngloGold Ashanti has invested $900 million towards mining projects in Colombia within the past decade, according to Reuters.
If the La Colosa project were to be completed, it would be one of the world’s largest open-pit gold mines. However, locals worry the mining in Tolima will negatively impact their water sources and pollute their environment, according to the BBC. The vote in Tolima, held on March 26, displayed overwhelming opposition against mining with 98.8 per cent against the project.
Just a few months later, in June 2017, a majority of locals in the Cumaral municipality voted in the first oil ban referendum passed in the country, which bans crude exploration, drilling and production, according to TeleSur.
Tauramena was the first municipality to enforce the ban, when a majority favoured to exile oil exploration in the country in December 2013, motivated by the population’s concern over the threat to water sources this practice may generate. The municipality located in Casanare, the central east region of Colombia, won the vote by 4,426 in favour of the ban out of 4,610 citizens that participated in the vote, according to El Espectador, a Columbian newspaper.
The municipality Cabrera, was the first to ban mining this year, as they voted in February, winning with 97 per cent in favour, according to El Espectador. The official question voters answered was, “Do you agree, yes or no, that mining projects and/or hydroelectric projects that transform or affect the use of land, water or agricultural vocation should be implemented in the municipality of Cabrera, Cundinamarca, as a Peasant Reserve Zone Township?” Only 23 voters approved this, according to the same source.
EMGESA, the Colombian electric power company that wants to impose mining and hydroelectric projects recently before the vote, the company restructured plans not to affect the municipality. However, a majority of voters in Cabrera wanted to protect the territory, as Cabrera has been recognized as a peasant reserve zone since 2000.
In response, the community of Cabrera has been working on a Sustainable Development Plan that does not consist of mining or hydroelectric plants. Paola Bolaños, a member of the Committee to Promote the Peasant Reserve Zone, said this project will ensure that the agricultural vocation is respected, reported by El Espectador.
Thus, a new era of peace is crucial for the government to take control of illegal mines in order to allow the economy to prosper while protecting the environment through greater provisions of the sector. Fundamentally, despite the peace plan costing $44bn over a 10-year period, it can be viewed as an investment into the stability of Colombia’s long-term peace prospects by ensuring effective governance.
Some resistance to mining is inevitable in a democracy especially in the nascent form of local governance permitted under the peace process. A further estimated 50 other municipalities will hold a referendum considering banning mining or not, within the next coming months, according to Colombia Reports.
This may be a setback for certain mining companies and the attractiveness of the country as mining jurisdiction in the short term. In the long run, if companies and communities can learn to work together it could improve the appeal of inviting extraction industries into the country. One should prefer the ballot box over a return to armed conflict. Colombians will be better off and so will the extraction industries with peace.
***MiningFeeds would like to make a special note that Savanna Craig contributed heavily to the writing and research of this article
Velocity Minerals (TSX-V: VLC) is a gold (“Au“) exploration and development junior focused on eastern Europe. Others in the region include Eldorado Gold, Nevsun, Freeport McMoran, Rio Tinto, First Quantum, Teck and Lundin Mining. In July, the TSX Venture exchange approved a transformational deal in which the Company acquired options on 2 highly prospective properties in southeastern Bulgaria. In conjunction with these new assets, a talented new management team and Board is in place.
Velocity is aligned with private Bulgarian gold miner Gorubso Kardzhali (owner of the optioned projects and theonly company in Bulgaria with a permit for cyanide-related processing of gold ores). Gorubso has been producing from its high-grade underground Chala gold mine for over 10 years and owns / operates a newly built (2011) Carbon-In-Leach (“CIL“) processing plant that has excess capacity. Close ties with Gorubso is helps in interactions with local communities and governmental bodies. (See Corporate Presentation)
Rozino Gold Project – 70% Earn-inOption
Velocity holds an option, exercisable for 6 years, to acquire an undivided 70% Interest in the Tintyava property, granted by Gorubso Kardzhali A.D. (“Gorubso”). The Rozino project, the subject of a recently filed Technical Report, is located within the Tintyava property, which has an area of 163 sq. km. To exercise the option, the Company must deliver a NI 43-101 compliant PEA.
The Rozino project is located 20 kilometres east of the Ada Tepe gold deposit being developed by Dundee Precious Metals, 50 km southeast of Kardzhali, host to tailings and gold processing facilities operated by Gorubso, and 350 km east-southeast of the capital of Sofia.
On August 21st, results of the first 2 drill holes at the Company’s Rozino gold project were released. Additional drill results are expected in the first half of September. Regarding the first 2 holes, Keith Henderson, Velocity’s President and CEO commented…
“These results are among the best grades ever returned from the project and the drill holes clearly demonstrate the potential for thick, high-grade gold mineralization between historical drill fences.”
Notice that I added boldface in the above quote, “between historical drill fences.” To a large degree, the success of Velocity Minerals’ main project revolves around that sentence. In the 1980s, a Bulgarian State-run company explored Rozino under the erroneous assumption of a flat-lying exploration target (which called for routine vertical drilling). However, as Gwen Prestoneditor of, “Resource Maven” explained in her recent report on Velocity,
“….the gold was not in a flat lying body but in steeply dipping structures that the vertical holes missed completely. In most cases, each vertical hole cut between two steep structures and therefore only cut through the disseminated mineralization in between. The next round of exploration from 2001 to 2005 involved angled holes, but the geologic concept was still flawed – this group drilled angled holes, but to the northwest. As a result, they too drilled parallel to and between the mineralized structures at Rozino, which run northwest and dip very steeply.” — Gwen Preston, editor of Resource Maven, a weekly newsletter on investing in the metals space
Therefore, the news of the first 2 drill holes, including a near-surface interval of 39 m of 4.11 g/t Au goes a long way towards supporting the thesis that decades worth of historical drilling provided some useful information, but was largely ineffective. These results come on top of the only other angled drill hole, drilled in the right direction…. #R-245 in 2006 by Asia Gold, returned 68 m @ 3.15 g/t Au, including 11.39 m @ 8.09 g/t Au.If management is on to reasonably thick, near-surface intervals of 2-4+ g/t gold, (the Company will be drilling for several more months) then other key aspects of the Rozino project will take on new meaning.
By that I mean, for example, there are very promising historical trench samples including,
17 m @ 3.39 g/t Au, 4.53 g/t Ag and 14 m @ 4.29 g/t Au, 2.58 g/t Ag
But these samples were never followed up on, perhaps because ongoing drill results (drilled in the wrong orientation) were not as exciting as what Velocity might find. Still, according to the technical report, the potential for additional sub-parallel vein zones to the main deposit is thought to be good and the targets there are essentially untested by drilling.
And that’s not all, in addition to strong trench samples, note what the technical report had to say about preliminary metallurgical test work (– page 20),
“Preliminary metallurgical test work carried out by Geoengineering, Lakefields, Caracal and Wardell Armstrong suggests that recoveries by cyanide leaching are above 90%, with no deleterious elements and the deposit should be amenable to simple low cost processing. This is consistent with LSE deposits elsewhere in the world, where similar grade mineralisation is mined.”
There has been a substantial amount of work done on the property by at least 4 groups. According to the technical report, work included; 1:2,000 scale geological mapping (8 sq. km), soil sampling (2,079 stations), trenching (clearing of existing state trenches and new trenches) for 3,978 m, channel sampling from trenches (2,411 samples), 55 diamond drilling core holes for 7,409 m, assay results of drill core (4,918 samples), 12.2 line km of ground magnetic surveying and 1.5 line km of Induced Polarization geophysical profiling.
Key Management Team and Board Members
The newly assembled management / technical team and Board really stands out for a company with a market cap of just ~C$ 18 M. In addition to Bulgaria, team members have worked in eastern and southern Africa-Eurasia, central Asia, central-south America, Australia, Peru, Canada, Mexico, the U.S., Namibia, Burkina Faso, Turkey, Yemen, Argentina, Chile, Iran, Ireland, China, Siberia, DRC, Russia, Serbia and India.
Team members have worked at major miners including Anglo American, Rio Tinto, Kinross, Lundin Mining, Teck Resources and Glencore. Director Mark Cruise has Founded 2 highly successful juniors; zinc miner Trevali Mining and gold explorer International Tower Hill Mines. CEO/Director Keith Henderson has decades of deal making/deal structuring and capital raising expertise.
Velocity Minerals scores very high in terms of boots on the ground. In addition to the close working relationship with Gorubso, 2 of Velocity’s top 5 executives are Bulgarian Nationals and VP of Exploration Stuart Mills is working full-time in Bulgaria.
Chala Gold Mine Option Agreement
Management has signed an exclusive 12-month option agreement with Gorubso to contemplate a joint venture to enhance/expand Gorubso’s Chala gold mine and, if warranted, the CIL plant. That arrangement could possibly include feeding the plant with ore from one or both of Velocity’s projects. If a win-win agreement can be reached, Velocity could effectively be in production (in partnership with Gorubso) as soon as next year.
Velocity is organizing and digitizing Gorubso’s 10+ years of mining data at the Chala gold mine to understand the likelihood of significantly more (tonnage and/or higher grade) gold mineralization being identified. Although I hesitate to enlist the overused phrase, “huge blue-sky potential,” a JV with Gorubso could be a really big deal. If structured right, it would greatly de-risk the development of Velocity’s 2 projects, slash upfront cap-ex requirements, facilitate / reduce permitting costs & time lines and simplify operational flow sheet design (especially if Gorubso’s CIL plant were to be utilized).
Near-term Catalysts – Drill Results
Management is laser focused on resource drilling to produce an open-pittable resource estimate. Importantly, since previous resource estimates were limited by mistakes in the orientation of drilling, the final resource reported to the Bulgarian government was severely restricted, it had no resource blocks between drill fences. Management believes that substantial infill potential around the main deposit exists between drill fences, and mineralization remains open to the southeast and northwest.
A total of 9 diamond drill holes (approximately 2,000 m) are planned for Phase I, of which the first 2 holes have been reported. The program is part of a larger campaign of up to 65 drill holes (~12,000 m), planned to be ongoing through the remainder of 2017 and into early 2018. Additional drill results are expected in the first half of September.
Ekuzyata Gold Project, Southeastern Bulgaria
I only briefly mention Velocity’s 2nd project, Ekuzyata, a 50% Earn-in opportunity, (or revert to 5% GSR) because the main focus is Rozino.
Any discovery could be within reach of existing Chala mine infrastructure, so there would be limited need for additional capital if Gorubso and Velocity were partnered. Ekuzyata is located within Gorubso’s mine concession, no additional permitting would be required.
CONCLUSION
Drill results in September/October will carry a lot of weight, if they continue to be as good or better than the first 2 assays, the Rozino project will have (both) less risk of there being no meaningful resource, and more upside potential from near-surface, high-grade zone(s) of Au mineralization.
Success at Rozino should increase the likelihood of a JV with Gorubso, which would be a win-win for both companies and a win for local communities.
To recap, Velocity Minerals (TSX-V: VLC) is funded to explore an overlooked property that could be fast-tracked into development (if warranted by further drilling), potentially in partnership with existing producer Gorubso. A prospective JV could save Velocity Minerals a tremendous amount of development capital, allowing the Company to minimize equity dilution. Currently there are 57 M shares outstanding, (66 M fully-diluted), no debt or preferred shares. The market cap is ~C$ 18 M. (See Corp. Presentation)
To the extent that permitting and other key development & construction activities could be facilitated by Gorubso’s experience and connections, that too could expedite Rozino’s and/or Ekuzata’s path to potential production. Combined, Gorubso with its operating mine and CIL plant and Velocity with Rozino, Ekuzata and its strong geological, exploration & technical team, could become a regional powerhouse capable of accretive acquisitions of nearby mining assets.
–
Disclosures: The content of this article is for information only. Readers fully understand and agree that nothing contained herein, written by Peter Epstein of Epstein Research[ER], (together, [ER]) about Velocity Minerals, including but not limited to, commentary, opinions, views, assumptions, reported facts, calculations, etc. is to be considered implicit or explicit investment advice. Nothing contained herein is a recommendation or solicitation to buy or sell any security. [ER] is not responsible under any circumstances for investment actions taken by the reader. [ER] has never been, and is not currently, a registered or licensed financial advisor or broker/dealer, investment advisor, stockbroker, trader, money manager, compliance or legal officer, and does not perform market making activities. [ER] is not directly employed by any company, group, organization, party or person. The shares of Velocity Minerals are highly speculative, not suitable for all investors. Readers understand and agree that investments in small cap stocks can result in a 100% loss of invested funds. It is assumed and agreed upon by readers that they will consult with their own licensed or registered financial advisors before making any investment decisions.
At the time this interview was posted, Peter Epstein owned shares and/or stock options in Velocity Minerals and the Company was an advertiser on [ER].Readers understand and agree that they must conduct their own due diligence above and beyond reading this article. While the author believes he’s diligent in screening out companies that, for any reasons whatsoever, are unattractive investment opportunities, he cannot guarantee that his efforts will (or have been) successful. [ER] is not responsible for any perceived, or actual, errors including, but not limited to, commentary, opinions, views, assumptions, reported facts & financial calculations, or for the completeness of this article or future content. [ER] is not expected or required to subsequently follow or cover events & news, or write about any particular company or topic. [ER] is not an expert in any company, industry sector or investment topic.
The silver miners’ stocks have largely languished this year, grinding sideways near lows for months on end. This vexing consolidation has fueled near-universal bearishness, leaving silver stocks deeply out of favor. But once a quarter when earnings season arrives, hard fundamentals pierce the obscuring veil of popular sentiment. The silver miners’ recently-reported Q2’17 results reveal today’s silver prices remain profitable.
Four times a year publicly-traded companies release treasure troves of valuable information in the form of quarterly reports. These are generally due by 45 days after quarter-ends in the US and Canada. They offer true and clear snapshots of what’s really going on operationally, shattering the misconceptions bred by the ever-shifting winds of sentiment. There’s no silver-miner data that is more highly anticipated than quarterlies.
Silver mining is a tough business both geologically and economically. Primary silver deposits, those with enough silver to generate over half their revenues when mined, are quite rare. Most of the world’s silver ore formed alongside base metals or gold, and their value usually well outweighs silver’s. So typically in any given year, less than a third of the global mined silver supply actually comes from primary silver mines!
The world authority on silver supply-and-demand fundamentals is the Silver Institute. Back in mid-May it released its latest annual World Silver Survey, which covered 2016. Last year only 30% of silver mined came from primary silver mines, a slight increase. The remaining 70% of silver produced was simply a byproduct. 35% of the total mined supply came from lead/zinc mines, 23% from copper, and 12% from gold.
As scarce as silver-heavy deposits supporting primary silver mines are, primary silver miners are even rarer. Since silver is so much less valuable than gold, most silver miners need multiple mines in order to generate sufficient cash flows. These often include non-primary-silver ones, usually gold. More and more traditional elite silver miners are aggressively bolstering their gold production, often at silver’s expense.
So the universe of major silver miners is pretty small, and their purity is shrinking. The definitive list of these companies to analyze comes from the most-popular silver-stock investment vehicle, the SIL Global X Silver Miners ETF. This week its net assets are running 6.0x greater than its next-largest competitor’s, so SIL really dominates this space. With ETF investing now the norm, SIL is a boon for its component miners.
While there aren’t many silver miners to pick from, major-ETF inclusion shows silver stocks have been vetted by elite analysts. Due to fund flows into top sector ETFs, being included in SIL is one of the important considerations for picking great silver stocks. When the vast pools of fund capital seek silver-stock exposure, their SIL inflows force it to buy shares in its underlying companies bidding their prices higher.
Back in mid-August as the major silver miners finished reporting their Q2’17 results, SIL included 29 “silver miners”. This term is used loosely, as SIL includes plenty of companies which can’t be described as primary silver miners. Most generate well under half their revenues from silver, which greatly limits their stock prices’ leverage to silver rallies. Nevertheless, SIL is today’s leading silver-stock ETF and benchmark.
The higher the percentage of sales any miner derives from silver, naturally the greater its exposure to silver-price moves. If a company only earns 20%, 30%, or even 40% of its revenues from silver, it’s not a primary silver miner and its stock price won’t be very responsive to silver itself. But as silver miners are increasingly actively diversifying into gold, there aren’t enough big primary silver miners left to build an ETF alone.
Every quarter I dig into the latest results from the major silver miners of SIL to get a better understanding of how they and this industry are faring fundamentally. I feed a bunch of data into a big spreadsheet, some of which made it into the table below. It includes key data for the top 17 SIL component companies, an arbitrary number that fits in this table. That’s a commanding sample at 93.2% of SIL’s total weighting.
While most of these top 17 SIL components had reported on Q2’17 by mid-August, not all had. Some of these major silver miners trade in the UK or Mexico, where financial results are only required in half-year increments. If a field is left blank in this table, it means that data wasn’t available by the end of Q2’s earnings season. Some of SIL’s components also report in gold-centric terms, excluding silver-specific data.
In this table the first couple columns show each SIL component’s symbol and weighting within this ETF as of mid-August. While most of these silver stocks trade in the States, not all of them do. So if you can’t find one of these symbols, it’s a listing from a company’s primary foreign stock exchange. That’s followed by each company’s Q2’17 silver production in ounces, along with its absolute year-over-year change.
After that comes this same quarter’s gold production. Pretty much every major silver miner in SIL also produces significant-if-not-large amounts of gold. While gold stabilizes and augments the silver miners’ cash flows, it also retards their stocks’ sensitivity to silver itself. Naturally investors and speculators buy silver stocks and their ETFs because they want leveraged upside exposure to silver’s price, not gold’s.
So the next column reveals how pure the elite SIL silver miners are. This is mostly calculated by taking a company’s Q2 silver production, multiplying it by Q2’s average silver price, and then dividing that by the company’s total quarterly sales. If miners didn’t report Q2 revenues, I approximated them by adding the silver sales to gold sales based on their quarterly production and these metals’ average second-quarter prices.
Then comes the most-important fundamental data for silver miners, cash costs and all-in sustaining costs per ounce mined. The latter determines their profitability and hence ultimately stock prices. Those are also followed by YoY changes. Finally comes the YoY changes in cash flows generated from operations and GAAP profits. But an exception is necessary for companies with numbers that crossed zero since Q2’16.
Percentage changes aren’t relevant or meaningful if data shifted from negative to positive or vice versa. Plenty of major silver miners suffered net losses in Q2’17 after earning profits in Q2’16. So in cases where data crossed that zero line, I included the raw numbers instead. This whole dataset offers a fantastic high-level fundamental read on how the major silver miners are faring today, and it’s reasonably well.
That’s reassuring given silver’s serious under-performance relative to gold this year. As a far-smaller market, silver usually amplifies gold’s advances by at least 2x. But as of the end of Q2, silver was only up 4.5% YTD compared to 7.9% for gold. That’s dismal 0.6x leverage. And by mid-August as Q2’s earnings season wrapped up, silver’s YTD gain of 4.6% fell even further behind gold’s 10.6%. That’s horrible 0.4x leverage!
Production is the lifeblood of mining companies, and thus the best place to start fundamental analysis. In Q2’17, these top 17 SIL components collectively produced an impressive 78.6m ozs of silver. If 2016’s world-silver-mining run rate is applied to this year’s second quarter, that implies 221.5m ozs of silver mined. Thus these top SIL silver miners would account for over 35% of that total, they truly are major silver players.
But these elites still weren’t able to significantly grow their collective silver production, it was up just 0.9% YoY. Instead they invested heavily in expanding their gold production, which surged 6.4% YoY to 1354k ounces. Interestingly 10 of these top 17 SIL components, a majority representing 45.3% of SIL’s total weighting, are also included in the leading GDX gold miners’ ETF. SIL is mostly made up of primary gold miners!
Many of these elite major silver miners don’t just mine gold as a silver byproduct, but actually operate at least one primary gold mine. The silver miners have collectively decided to diversify into gold due to its superior economics. Consider hypothetical mid-sized silver and gold miners, which might produce 10m and 300k ounces annually. What would those cash flows look like at last quarter’s average metals’ prices?
In Q2’17, silver and gold averaged $17.18 and $1258. Silver was up 2.3% YoY, while gold slipped by a slight 0.1% YoY. At 10m ounces, that silver miner would generate $172m in sales. But the similar-sized gold miner’s sales of $377m more than doubles that. At recent years’ prevailing prices, the cash flows from gold mining are much more robust than those from silver mining. That makes it easier to pay bills and expand.
Silver mining is often as capital-intensive as gold mining, requiring similar large expenses for planning, permitting, and constructing mines and mills to process ore. Similar heavy excavators and haul trucks are necessary to dig and haul the ore, along with similar staffing levels to run mines. So silver’s lower cash flows to support all this activity make silver mining harder than gold mining, which isn’t lost on silver miners.
Silver-mining profits do skyrocket when silver soars occasionally in one of its massive bull markets. But during silver’s long intervening drifts at relatively-low price levels, the silver miners often can’t generate sufficient cash flows to finance expansions. So the top silver miners are increasingly looking to gold, a trend that isn’t likely to reverse given the relative economics of silver and gold. Primary silver miners are getting rarer.
Technically a company isn’t a primary silver miner unless it derives over half its revenues from silver. In Q2’17, the average sales percentage from silver of these top SIL components was just 37.6%! That is right on trend over this past year, with Q2’16, Q3’16, Q4’16, and Q1’17 weighing in at 46.3%, 38.5%, 40.5%, and 37.9%. In Q2’17, only 5 of the top SIL component companies qualified as primary silver miners!
While I understand this, as a long-time silver-stock investor it saddens me primary silver miners have apparently become a dying breed. When silver starts powering higher in one of its gigantic uplegs and way outperforms gold again, this industry’s silver percentage will rise. But unless silver not only shoots far ahead but stays there while gold lags, it’s hard to see major-silver-mining purity significantly reversing.
Unfortunately SIL’s mid-August composition was such that there wasn’t a lot of Q2 cost data reported by its top component miners. 3 of its top 4 companies trade in the UK and Mexico, where reporting only comes in half-year increments. Lower down the list there are more half-year reporters, an explorer with no production, and primary gold miners that don’t report silver costs. So silver cost data was fairly scarce.
Nevertheless, it’s always useful to look at the data we have. Industry wide silver-mining costs are one of the most-critical fundamental data points for silver-stock investors. As long as the miners can produce silver for well under prevailing silver prices, they remain fundamentally sound. Cost knowledge helps traders weather this sector’s fear-driven plunges without succumbing to selling low like the rest of the herd.
There are two major ways to measure silver-mining costs, classic cash costs per ounce and the superior all-in sustaining costs. Both are useful metrics. Cash costs are the acid test of silver-miner survivability in lower-silver-price environments, revealing the worst-case silver levels necessary to keep the mines running. All-in sustaining costs show where silver needs to trade to maintain current mining tempos indefinitely.
Cash costs naturally encompass all cash expenses necessary to produce each ounce of silver, including all direct production costs, mine-level administration, smelting, refining, transport, regulatory, royalty, and tax expenses. In Q2’17, these top 17 SIL-component silver miners that reported cash costs averaged $6.34 per ounce. That surged a major 19.1% YoY from Q2’16’s $5.32, which seems like a troubling omen.
But it’s not. Flighty silver-stock investors are always on the verge of panicking, fleeing this volatile and psychologically-challenging sector. But the only event worthy of such extreme bearishness would be prevailing silver prices falling near cash costs. And even at $6.34-per-ounce cash costs and today’s low silver, a vast buffer exists. There’s no way silver is going to plummet down under $7 in any conceivable scenario!
These high cash costs are actually an anomaly mainly driven by two companies. First, SSR Mining (TSX: SRR) is now winding down its rapidly-depleting silver mine as planned. It produced 10.4 million ounces of silver in 2016, but only 5.5m is forecast this year! As silver throughput drops each quarter, the per-ounce costs are rising. Without SSRM’s outlying super-high cash costs, the rest of these top SIL miners averaged just $5.51.
Another company Silvercorp Metals (TSX: SVM) had slid out of SIL’s top 17 components as of mid-August. It was the 18th one, removing it from this particular calculation. Due to SVM’s enormous lead and zinc byproducts, its costs are the lowest in the industry. In Q2’16 it reported cash costs of $0.08 per ounce, which really dragged down that comp-quarter average. So the major silver miners’ collective cash costs were just fine in Q2.
Way more important than cash costs are the far-superior all-in sustaining costs. They were introduced by the World Gold Council in June 2013 to give investors a much-better understanding of what it really costs to maintain a silver mine as an ongoing concern. AISC include all direct cash costs, but then add on everything else that is necessary to maintain and replenish operations at current silver-production levels.
These additional expenses include exploration for new silver to mine to replace depleting deposits, mine-development and construction expenses, remediation, and mine reclamation. They also include the corporate-level administration expenses necessary to oversee silver mines. All-in sustaining costs are the most-important silver-mining cost metric by far for investors, revealing silver miners’ true operating profitability.
In Q2’17, these top 17 SIL components reporting AISC averaged $11.66 per ounce. That was up 16.0% YoY from Q2’16s $10.05. Coeur Mining was a big factor, with AISC surging 19% to a lofty $15.90 per ounce! That was due to lower-grade ore on the way to better zones. Ex-CDE, this average ran $10.96 which was closer to year-ago levels. SVM was also a factor, with low $7.06 AISC feeding into Q2’16 comps.
Two other elite silver miners suffered major production problems in Q2’17, resulting in big production drops. With fewer ounces to spread mining’s heavy fixed costs across, all-in sustaining costs soared. First Majestic Silver (TSX: FR), the purest major silver miner at 65.4% of Q2 revenues, saw production fall 20% YoY which forced AISC 33% higher. Unprecedented labor unrest in Mexico temporarily halted 3 of its 6 silver mines.
Those issues have since been resolved, so AG’s production should bounce back in Q3 which will push its AISC back down. Meanwhile Tahoe Resources (TSX: THO) saw its Q2 production plunge 28% YoY forcing its own AISC 23% higher. It got sucked into a legal battle between anti-mining activists and the government of Guatemala where its silver mine is. That mining license was temporarily suspended for an unmerited lawsuit.
The activists allege the government shouldn’t have granted Tahoe its Escobal mining license in the first place because it didn’t consult with a particular indigenous tribe first. But those people don’t even live anywhere near the mine site, it’s ridiculous! Tahoe doesn’t know when Escobal operations will be allowed to resume, but estimates a range between a couple months from now out to 18 months for a full resolution.
Tahoe’s large gold production from its two other gold mines in Peru, 110k ounces in Q2’17, ensures it won’t have any serious problems weathering this Guatemalan nightmare. But the point for our purposes today is that anomalous special situations fed the steep jump in the major silver miners’ all-in sustaining costs in Q2. But even at these elevated levels, this industry is still enjoying hefty silver-mining margins.
At $11.66 AISC, the major silver miners still earned big profits in the second quarter. Once again silver averaged $17.18, implying fat profit margins of $5.52 per ounce or 32%! Most industries would kill for such margins, yet silver-stock investors are always worried silver prices are too low for miners to thrive. That’s why it’s so important to study fundamentals, because technical price action fuels misleading sentiment!
Today’s silver price remains really low relative to prevailing gold levels, which portends huge upside as it mean reverts higher. The long-term average Silver/Gold Ratio runs around 56, which means it takes 56 ounces of silver to equal the value of one ounce of gold. Silver is really underperforming gold so far in 2017, with the SGR averaging just 72.6 YTD as of mid-August. So silver is overdue to catch up with gold.
At a 56 SGR and $1300 gold, silver is easily heading near $23.25. That’s 35% above its Q2 average. Assuming the major silver miners’ all-in sustaining costs hold, that implies profits per ounce soaring 110% higher! Plug in a higher gold price or the typical mean-reversion overshoot after an SGR extreme, and the silver-mining profits upside is far greater. Silver miners’ inherent profits leverage to rising silver is incredible.
Still Q2’17’s relatively-weak silver price weighed on miners’ cash flows generated from operations and GAAP accounting profits. Despite their big gold production, operating cash flows plunged 28.4% YoY to $1038m for these top SIL components. That’s not quite a righteous comparison though, because only 13 of this year’s top 17 had reported Q2 financial results by mid-August. Last year that number totaled 15.
And one of the silver miners not reporting OCF by the usual Q2 deadline this year was the Mexican silver giant Fresnillo (NASDAQ: FNLPF). Its OCF last year was fully 1/6th of these top SIL components’ total! So their operating-cash-flows situation in Q2’17 is nowhere near as bad as the drop implies. The same is true on the GAAP-earnings front. Last year Fresnillo contributed nearly 22% of the profits of these top 17 SIL components.
Another huge Mexican silver miner, the conglomerate Industrias Penoles (NASDAQ: IPOAF), saw its profits plunge about $140m YoY. These two Mexican silver giants alone account for the entire drop in these top SIL miners’ profits in Q2’17, which plummeted 57.5% YoY or $221m. Without them, silver-mining profits were flat. That’s pretty darned good considering all the super-anomalous company-specific problems that plagued Q2 results.
Silver miners’ earnings power and thus stock-price upside potential will only grow as silver mean reverts higher. In mining, costs are largely fixed during the mine-planning stages. That’s when engineers decide which ore bodies to mine, how to dig to them, and how to process that ore. Quarter after quarter, the same numbers of employees, haul trucks, excavators, and mills are generally used regardless of silver prices.
So as silver powers higher in coming quarters, silver-mining profits will really leverage its advance. And that will fundamentally support far-higher silver-stock prices. The investors who will make out like bandits on this are the early contrarians willing to buy in low, before everyone else realizes what is coming. By the time silver surges higher with gold so silver stocks regain favor again, the big gains will have already been won.
While investors and speculators alike can certainly play the silver miners’ ongoing mean-reversion bull with this leading SIL ETF, individual silver stocks with superior fundamentals will enjoy the best gains by far. Their upside will trounce the ETFs’, which are burdened by companies that don’t generate much of their sales from silver. A handpicked portfolio of purer elite silver miners will yield much-greater wealth creation.
At Zeal we’ve literally spent tens of thousands of hours researching individual silver stocks and markets, so we can better decide what to trade and when. As of the end of Q2, this has resulted in 951 stock trades recommended in real-time to our newsletter subscribers since 2001. Fighting the crowd to buy low and sell high is very profitable, as all these trades averaged stellar annualized realized gains of +21.2%!
The key to this success is staying informed and being contrarian. That means diligently studying and buying great silver stocks before they grow popular again, when they’re still cheap. An easy way to keep abreast is through our acclaimed weekly and monthly newsletters. They draw on our vast experience, knowledge, wisdom, and ongoing research to explain what’s going on in the markets, why, and how to trade them with specific stocks. For just $10 per issue, you can learn to think, trade, and thrive like contrarians. Subscribe today and get deployed in great silver stocks before they surge far higher!
The bottom line is the major silver miners fared fine in Q2 despite some real challenges. A combination of silver continuing to seriously lag gold, along with anomalous company-specific problems, weighed on miners’ collective results. Yet they continued to produce silver at all-in sustaining costs way below Q2’s low prevailing silver prices. And their accelerating gold-production growth leaves them financially stronger.
With silver-stock sentiment remaining excessively bearish, this sector is primed to soar as silver itself continues mean reverting higher to catch up with gold’s current upleg. The silver miners’ profits leverage to rising silver prices remains outstanding. After fleeing silver stocks so aggressively this year, investors and speculators alike will have to do big buying to reestablish silver-mining positions. That will fuel major upside.
Yesterday morning, NewCastle Gold Ltd. (TSX: NCA) reported additional drill results from the southern portion of the Oro Belle Trend within the region of the JSLA pit on its Castle Mountain Gold Project in California.
Highlights from the release include Hole 167 which intersected 148m of 0.89 g/t from 73m, including 31m of 2.45 g/t, and a further 171m of 0.42 g/t from 236m. CMM-161A intersected 180m of 1.01 g/t from 152m, including 20m of 5.79 g/t. Hole CMM-161A was completed as a supplement to hole CMM-161, where 52 samples were previously assigned a zero grade.
Based on recent results, the company will be starting a 10-km follow-up drill program in September. The company plans to complete its pre-feasibility study by the end of the year.
The 2015 resource includes a measured resource of 17.4 million tonnes at 0.86g/t gold for 0.48 million ounces and an indicated 202.5Mt at 0.57g/t gold for 3.71 million ounces.
NewCastle finished June with $3.12 million in cash and equivalents, before closing a bought deal offering on July 13, at $0.95 per share for total proceeds of ~$15 million. The company needs to raise money for preparation work and according to TD Securities, is looking at debt financing, or better alternatives if presented.
According to data collected by the Financial Times, as of last year, six analysts rated NewCastle outperform with one analyst recommending to buy the stock. As of Aug 25, 2017, the consensus forecast improved amongst 11 polled investment analysts covering NewCastle advises that the company will outperform the market. This has been the consensus forecast since the sentiment of investment analysts deteriorated on Apr 22, 2014.
TD Securities rated the shares in the company with a speculative buy, a speculative risk, and a 12-month price target of $2.00. TD assessed the news to have an positive impact on the company’s share price. By TD’s count, there are still results pending from this program.
News of the results pushed the stock up 1 cent to 96 cents on 497,900 shares on August 29.
On April 18, 2017, Camino Minerals Corp. (TSX-V: COR) released drill results from its copper exploration project, Los Chapitos in Peru. The company intersected in hole CHR-002 1.30 per cent copper over 106 metres, with the hole ending in mineralization, including a section of 2.12 per cent copper over 38 m and hole CHR-001 intersected 0.47 per cent copper over 76 m, including 0.67 per cent copper over 22 m. These results put the company on the radar as a company to watch. On August 25th, John Kaiser of Kaiser Research Online appeared on the Discovery Watch to discuss Camino’s results, its market activity and future prospects.
According to Kaiser, there were good results but as he studied the data it became apparent to him and the company that there was a magnetic anomaly next to hole CHR-002 which suggested there might be a sulphide body at a 200-metre depth. Combined with the data that hole CHR-002 ended in mineralization, the hope was that once they get into the sulphide body that there would be high tonnage and high grade copper in this anomaly. The next phase of drilling was designed to target this anomaly with drill hole DCH-012 (hole 12).
The results drove the company’s share price to an intraday high of $2.21 settling at $1.24 by the end of the day. However, since then the stock has retreated to 47 cents at time of publication, largely in part because the company did not find what it thought was there.
On Aug. 28, the company released results from the Adriana and Katty zones on the los Chapitos project, that included hole 12. Kaiser said that the results were not what the company was expecting. Hole 12 was great until it hit the anomaly; the mineralization very quickly faded out and the company’s theory did not pan out. As a result, the company is choosing not to use IP anomalies as a targeting-tool on this project. Nonetheless, Kaiser and the company are still optimistic about the results and the project.
The company reported drill highlights for the Adriana zone from DCH-012 which intersected 0.93 per cent copper over 96.5 metres, including 2.03 per cent copper over 19.5 m and 5.01 per cent copper over 4.5 m and which DCH-019 intersected 0.97 per cent copper over 42.0 m, including 3.31 per cent copper over 7.5 m. Some drill highlights from the Katty zone included DCH-010 which intersected 0.70 per cent copper over 43.5 m, including 1.85 per cent copper over 5.6 m and DCH-014 which intersected 1.20 per cent copper over 21.4 m, including 2.70 per cent copper over 7.9 m. It is early in the exploration program and the company has plenty of work coming up.
Kaiser believes it is a still interesting project without the sulphide anomaly. The company has about 8,000 to 10,000 metres of drilling planned at the Adriana Zone plus another 2,000 to 3,000 metres at the Katty Zone. Over the next two to three months as the company drills this trend, they will put together a resource estimate. He feels it may not be that great unless they hit something different from the current trend. In addition, the company is applying for permitting at the Atajo zone.
When Kaiser asked Ken McNaughton, President of Camino, why the company is moving forward so aggressively, McNaughton replied because they are seeing copper in all of the core. Kaiser concludes that Camino results were not as spectacular as he had hoped but the company has the cash and is marching in the right direction.
***The author does not own any shares in Camino and provided this report for information purposes. The author was not compensated for this article.
The junior gold miners’ stocks have spent months grinding sideways near lows, sapping confidence and breeding widespread bearishness. The entire precious-metals sector has been left for dead, eclipsed by the dazzling Trumphoria stock-market rally. But traders need to keep their eyes on the fundamental ball so herd sentiment doesn’t mislead them. The juniors recently reported Q2 earnings, and enjoyed strong results.
Four times a year publicly-traded companies release treasure troves of valuable information in the form of quarterly reports. Companies trading in the States are required to file 10-Qs with the US Securities and Exchange Commission by 45 calendar days after quarter-ends. Canadian companies have similar requirements. In other countries with half-year reporting, some companies still partially report quarterly.
The definitive list of elite junior gold stocks to analyze used to come from the world’s most-popular junior-gold-stock investment vehicle. This week the GDXJ VanEck Vectors Junior Gold Miners ETF reported $4.0b in net assets. Among all gold-stock ETFs, that was only second to GDX’s $7.5b. That is GDXJ’s big-brother ETF that includes larger major gold miners. GDXJ’s popularity testifies to the great allure of juniors.
Unfortunately this fame has recently created major problems severely hobbling the usefulness of GDXJ. This sector ETF has shifted from being beneficial for junior gold miners to outright harming them. GDXJ is literally advertised as a “Junior Gold Miners ETF”. Investors only buy GDXJ shares because they think this ETF gives them direct exposure to junior gold miners’ stocks. But unfortunately that’s no longer true!
GDXJ is quite literally the victim of its own success. This ETF grew so large in the first half of 2016 as gold stocks soared in a massive upleg that it risked running afoul of Canadian securities law. Most of the world’s junior gold miners and explorers trade in Canada. In that country once any investor including an ETF goes over 20% ownership in any stock, it is deemed a takeover offer that must be extended to all shareholders!
Understanding what happened in GDXJ is exceedingly important for junior-gold-stock investors, and I explained it in depth in my last essay on juniors’ Q1’17 results. GDXJ’s managers were forced to reduce their stakes in leading Canadian juniors. So last year capital that GDXJ investors intended to deploy in junior gold miners was instead diverted into much-larger gold miners. GDXJ’s effective mission stealthily changed.
Not many are more deeply immersed in the gold-stock sector than me, as I’ve spent decades studying, trading, and writing about this contrarian realm. These huge GDXJ changes weren’t advertised, and it took even me months to put the pieces together to understand what was happening. GDXJ’s managers may have had little choice, but their major direction change has been devastating to the junior gold miners.
Investors naturally poured capital into GDXJ, the “Junior Gold Miners ETF”, expecting to own junior gold miners. But instead of buying junior gold miners’ shares and bidding up their prices, GDXJ was instead shunting those critical inflows to the much-larger mid-tier and even major gold miners. That left the junior gold miners starved of capital, as their share prices they rely heavily upon for financing languished in neglect.
GDXJ’s managers should’ve lobbied Canadian regulators and lawmakers to exempt ETFs from that 20% takeover rule. Hundreds of thousands of investors buying an ETF obviously have no intention of taking over gold-mining companies! And higher junior-gold-stock prices boost the Canadian economy, helping these miners create valuable high-paying jobs. But GDXJ’s managers instead skated perilously close to fraud.
This year they rejiggered their own index underlying GDXJ, greatly demoting most of the junior gold miners! Investors buying GDXJ today are getting very-low junior-gold-miner exposure, which makes the name of this ETF a deliberate deception. I’ve championed GDXJ for years, it is a great idea. But in its current sorry state, I wouldn’t touch it with a ten-foot pole. It is no longer anything close to a junior-gold-miners ETF.
There’s no formal definition of a junior gold miner, which gives cover to GDXJ’s managers pushing the limits. Major gold miners are generally those that produce over 1m ounces of gold annually. For years juniors were considered to be sub-200k-ounce producers. 300k ounces per year is a very generous threshold. Anything between 300k to 1m ounces annually is in the mid-tier realm, where GDXJ now traffics.
That high 300k-ounce-per-year junior cutoff translates into 75k ounces per quarter. Following the end of the gold miners’ Q2 earnings season in mid-August, I dug into the top 34 GDXJ components. That is just an arbitrary number that fits neatly into the tables below. While GDXJ had a whopping 73 component stocks in mid-August, the top 34 accounted for 81.5% of its total weighting. That’s a commanding sample.
Out of these top 34 GDXJ companies, only 4 primary gold miners met that sub-75k-ounces-per-quarter qualification to be a junior gold miner! Their quarterly production is highlighted in blue below, and they collectively accounted for just 7.1% of GDXJ’s total weighting. And that isn’t righteous, as these include a 126-year-old silver miner, a mid-tier miner with temporary production declines, and a ramping mid-tier producer.
GDXJ is inarguably now a pure mid-tier gold-miner ETF. That’s great if GDXJ is advertised as such, but terrible if capital investors explicitly intend for junior gold miners is instead being diverted into mid-tiers without their knowledge or consent. The vast majority of GDXJ shareholders have no idea how radically this ETF has changed since early 2016. It is all but unrecognizable, straying greatly from its original mission.
I’ve been doing these deep quarterly dives into GDXJ’s top components for years now. In Q2’17, fully 29 of the top 34 GDXJ components were also GDX components. These ETFs are separate, a “Gold Miners ETF” and a “Junior Gold Miners ETF”. So why on earth should they own many of the same companies? In the tables below I highlighted GDXJ components also in GDX in yellow in the column showing GDXJ weightings.
These 29 GDX components accounted for 74.6% of GDXJ’s total weighting, not just its top 34. They also represented 30.1% of GDX’s total weighting. So three-quarters of the junior gold miners’ ETF is made up of nearly a third of the major gold miners’ ETF! I’ve talked with many GDXJ investors over the years, and have never heard one wish their capital allocated specifically to junior golds would instead go to much-larger miners.
Fully 12 of GDXJ’s top 17 components weren’t even in this ETF a year ago in Q2’16. They alone now account for 40.6% of its total weighting. 15 of the top 34 are new, or 45.3% of the total. In the tables below, I highlighted the symbols of companies actually in GDXJ a year ago in light blue. Today’s GDXJ is a radical departure from a year ago. Analyzing Q2’17 results largely devoid of real juniors was frustrating.
Nevertheless, GDXJ remains the leading “junior-gold” benchmark. So every quarter I wade through tons of data from its top components’ 10-Qs, and dump it into a big spreadsheet for analysis. The highlights made it into these tables. A blank field means a company didn’t report that data for Q2’17 as of that mid-August 10-Q deadline. Companies have wide variations in reporting styles, data presented, and report timing.
In these tables the first couple columns show each GDXJ component’s symbol and weighting within this ETF as of mid-August. While most of these gold stocks trade in the States, not all of them do. So if you can’t find one of these symbols, it’s a listing from a company’s primary foreign stock exchange. That’s followed by each company’s Q2’17 gold production in ounces, which is mostly reported in pure-gold terms.
Many gold miners also produce byproduct metals like silver and copper. These are valuable, as they are sold to offset some of the considerable costs of gold mining. Some companies report their quarterly gold production including silver, a construct called gold-equivalent ounces. I only included GEOs if no pure-gold numbers were reported. That’s followed by production’s absolute year-over-year change from Q2’16.
Next comes the most-important fundamental data for gold miners, cash costs and all-in sustaining costs per ounce mined. The latter determines their profitability and hence ultimately stock prices. Those are also followed by YoY changes. Finally the YoY changes in cash flows generated from operations, GAAP profits, revenues, and cash on balance sheets are listed. There’s one key exception to these YoY changes.
Percentage changes aren’t relevant or meaningful if data shifted from negative to positive or vice versa. Plenty of major gold miners earning profits in Q2’17 suffered net losses in Q2’16. So in cases where data crossed that zero line, I included the raw numbers instead. This whole dataset offers a fantastic high-level fundamental read on how the mid-tier gold miners are faring today. They’re looking quite impressive.
After spending days digesting these GDXJ gold miners’ latest quarterly reports, it’s fully apparent their vexing consolidation this year isn’t fundamentally righteous at all! Traders have abandoned this sector since the election because the allure of the levitating general stock markets has eclipsed gold. That has left gold stocks exceedingly undervalued, truly the best fundamental bargains out there in all the stock markets!
Once again the light-blue-highlighted symbols are GDXJ components that were there a year ago. The white-backgrounded ones are new additions. And the yellow-highlighted GDXJ weightings are stocks that were also GDX components in mid-August. GDXJ is increasingly a GDX clone that offers little if any real exposure to true gold juniors’ epic upside potential during gold bulls. GDXJ is but a shadow of its former self.
VanEck owns and manages GDX, GDXJ, and the MVIS indexing company that decides exactly which gold stocks are included in each. With one company in total control, GDX and GDXJ should have zero overlap in underlying companies! GDX or GDXJ inclusion should be mutually-exclusive based on the size of individual miners. That would make both GDX and GDXJ much more targeted and useful for investors.
GDXJ’s highest-ranked component choices made by its managers are mystifying. This “Junior Gold Miners ETF” has a major primary silver miner as its largest component. Over half of PAAS’s sales in Q2 came from silver. And the next two biggest are large South African gold miners. That country has one of the most anti-shareholder governments in the world now, forcing unconscionable racial quotas on owners.
Since gold miners are in the business of wresting gold from the bowels of the Earth, production is the best place to start. These top 34 GDXJ gold miners collectively produced 3,583k ounces in Q2’17. That rocketed 74% higher YoY, but that comparison is meaningless given the extreme changes in this ETF’s composition since mid-2016. On the bright side, GDXJ’s miners do remain significantly smaller than GDX’s.
GDX’s top 34 components, fully 20 of which are also top-34 GDXJ components, collectively produced 9854k ounces of gold in Q2. So GDXJ components’ average quarterly gold production of 119k ounces excluding explorers was 61% lower than GDX components’ 308k average. So even if GDXJ’s “Junior” name is very misleading, it definitely has smaller gold miners even if they’re well above that 75k junior threshold.
Despite GDXJ’s top 34 components looking way different from a year ago, these current gold miners are faring well on the crucial production front. Fully 19 of these mid-tier gold miners enjoyed big average YoY production growth of 26%! Overall average growth excluding explorers was 12% YoY, which is nothing to sneeze at given gold’s rough year since mid-2016. These elite GDXJ gold “juniors” are really thriving.
Gold production varies seasonally within calendar years partially due to mining-plan timing. Gold-bearing ore was certainly not created equal, with even individual deposits seeing big internal variations in their metal-to-waste-rock ratios. Miners often have to dig through lower-grade ore to get to the higher-grade zones underneath. This still has economically-valuable amounts of gold, so it is run through the mills.
These mills are essentially giant rock grinders that break ore into smaller pieces, vastly increasing its surface area for chemicals to later leach out the gold. Mill capacity is fixed, with limits on ore tonnage throughput. So when miners are blasting and hauling lower-grade ore, fewer ounces are produced. As they transition into higher-grade zones, the same amount of rock naturally yields more payable ounces.
Regardless of the ore grades being blasted and milled, the overall quarterly costs of mining don’t change much. Operations require the same levels of employees, fuel, maintenance, and electricity no matter how rich the rock being processed. So higher gold production directly leads to lower per-ounce mining costs. The big fixed costs of gold mining are spread across more ounces, making this business more profitable.
There are two major ways to measure gold-mining costs, classic cash costs per ounce and the superior all-in sustaining costs per ounce. Both are useful metrics. Cash costs are the acid test of gold-miner survivability in lower-gold-price environments, revealing the worst-case gold levels necessary to keep the mines running. All-in sustaining costs show where gold needs to trade to maintain current mining tempos indefinitely.
Cash costs naturally encompass all cash expenses necessary to produce each ounce of gold, including all direct production costs, mine-level administration, smelting, refining, transport, regulatory, royalty, and tax expenses. In Q2’17, these top 34 GDXJ-component gold miners that reported cash costs averaged just $628 per ounce. That was indeed down a sizable 1.3% YoY from Q2’16, and 3.0% QoQ from Q1’17.
This was really quite impressive, as the mid-tier gold miners’ cash costs were only a little higher than the GDX majors’ $605. That’s despite the mid-tiers each operating fewer gold mines and thus having fewer opportunities to realize cost efficiencies. Traders must recognize these smaller gold miners are in zero fundamental peril as long as prevailing gold prices remain well above cash costs. And $628 gold ain’t happening!
Way more important than cash costs are the far-superior all-in sustaining costs. They were introduced by the World Gold Council in June 2013 to give investors a much-better understanding of what it really costs to maintain a gold mine as an ongoing concern. AISC include all direct cash costs, but then add on everything else that is necessary to maintain and replenish operations at current gold-production levels.
These additional expenses include exploration for new gold to mine to replace depleting deposits, mine-development and construction expenses, remediation, and mine reclamation. They also include the corporate-level administration expenses necessary to oversee gold mines. All-in sustaining costs are the most-important gold-mining cost metric by far for investors, revealing gold miners’ true operating profitability.
In Q2’17, these top 34 GDXJ components reporting AISC averaged just $879 per ounce. That’s down 0.9% YoY and 4.9% QoQ. That also compares very favorably with the GDX majors, which saw average AISC nearly identical at $867 in Q2. The mid-tier gold miners’ low costs show they are faring far better fundamentally today than everyone thinks based on this year’s largely-disappointing technical stock-price action.
All-in sustaining costs are effectively this industry’s breakeven level. As long as gold stays above $879 per ounce, it remains profitable to mine. At Q2’s average gold price of $1258, these top GDXJ gold miners were earning big average profits of $379 per ounce last quarter! That equates to hefty profit margins of 30%, levels most industries would kill for. The mid-tier gold miners aren’t getting credit for that today.
Unfortunately given its largely-junior-less composition, GDXJ remains the leading benchmark for junior gold miners. In Q2’17, GDXJ averaged $33.30 per share. That was down a sharp 11% from Q1’s average of $37.46. Investors have largely abandoned gold miners because they are captivated by the extreme Trumphoria stock-market rally since the election. Yet gold-mining profits surged in that span.
At Q1’s average gold price of $1220 and Q1’s average top GDXJ components’ AISC of $924, these elite mid-tier miners were earning $296 per ounce on average. That’s already quite healthy. But quarter-on-quarter from Q1 to Q2, these top 34 GDXJ components’ operating profits rocketed 28% higher to $379 per ounce. There’s absolutely no doubt the sharp decline in gold-stock prices in Q2 had nothing to do with fundamentals!
Gold stocks are in the dumps technically because these lofty stock markets keep powering higher. Even though they are in dangerous bubble territory and the Fed is on the verge of starting to suck capital out of the markets via super-bearish quantitative tightening. These record stock markets have really retarded investment demand for gold, which tends to move counter to stock markets. So gold stocks are deeply out of favor.
Gold-stock price levels and psychology are totally dependent on gold, the dominant driver of miners’ profits. Gold stocks enjoy major profits leverage to gold, which gives their stocks big upside potential when gold rallies. Gold-mining costs are essentially fixed during mine-planning stages. Generally the same numbers of employees and equipment are used quarter after quarter regardless of the gold price.
So higher gold prices flow right through to the bottom line, costs don’t rise with them. If gold rallies just another 3.4% from Q2’s average prices to average $1300 in a coming quarter, profits will surge another 11.1% at Q2’s all-in sustaining costs. In a $1400-average-gold quarter, merely 11.3% higher from Q2’s levels, gold-mining profits would soar 37.5% higher. At $1500, those gains surge to 19.3% and 63.9%!
And a 20% gold rally from Q2’s levels is nothing special. Back in roughly the first half of last year after a sharp stock-market correction, gold powered 29.9% higher in just 6.7 months! So if you believe gold is heading higher in coming quarters as these crazy stock markets falter, the gold stocks are screaming buys today fundamentally. Their already-strong profitability will soar, amplifying gold’s mean-reversion upleg.
Since today’s bastardized GDXJ largely devoid of juniors changed so radically since last year, the normal year-over-year comparisons in key financial results aren’t comparable. But here they are for reference. These top-34 GDXJ companies’ cashflows generated from operations soared 57% YoY to $1458m. That was driven by sales up 59% YoY to $3840m. That left their collective cash balances $34% higher YoY at $6140m.
And top-34-GDXJ-component profits skyrocketed 385% YoY to $751m. Again don’t read too much into this since it’s an apples-to-oranges comparison. If GDXJ’s component list and weightings finally stabilize after such extreme tumult, we’ll have clean comps again next year. We can still look at operating cash flows and GAAP profits among this year’s list of top-34 components, which offers some additional insights.
On the OCF front, 10 of these 34 miners reported average YoY gains of 54%, while 13 of them reported average declines of 33%. Together all 23 averaged operating-cash-flows growth of 5%. That isn’t much, but it’s positive. And it’s not bad considering Q2’17’s average gold price was dead flat from Q2’16’s. These mid-tier gold miners are doing far better operationally than their neglected super-low stock prices imply.
On the GAAP-earnings front, the 10 miners that earned profits in both Q2s averaged huge growth of 110% YoY! And out of 14 more miners that saw profits cross zero in the past year, 8 swung from losses to gains. Total annual earnings growth among those zero-crossing swingers exceeded $536m. Make no mistake, these “junior” gold miners are thriving fundamentally even at Q2’s relatively-low $1258 average gold.
So overall the mid-tier gold miners’ fundamentals looked quite impressive in Q2’17, a stark contrast to the miserable sentiment plaguing this sector. Gold stocks’ vexing consolidation this year wasn’t the result of operational struggles, but purely bearish psychology. That will soon shift as stock markets roll over and gold surges, making the beaten-down gold stocks a coiled spring today. They are overdue to soar again!
Though this contrarian sector is despised, it was the best-performing in all the stock markets last year despite a sharp Q4 post-election selloff. The leading HUI gold-stock index blasted 64.0% higher in 2016, trouncing the S&P 500’s 9.5% gain! Similar huge 50%+ gold-stock gains are possible again this year, as gold mean reverts higher as stock markets sell off. The gold miners’ strong Q2 fundamentals prove this.
Given GDXJ’s serious problems, leading to diverting most of its capital inflows into larger gold miners that definitely aren’t juniors, you won’t find sufficient junior-gold exposure in this troubled ETF. Instead traders should prudently deploy capital in the better individual junior gold miners’ stocks with superior fundamentals. Their upside is vast, and would trounce GDXJ’s even if it was still working as advertised.
At Zeal we’ve literally spent tens of thousands of hours researching individual gold stocks and markets, so we can better decide what to trade and when. As of the end of Q2, this has resulted in 951 stock trades recommended in real-time to our newsletter subscribers since 2001. Fighting the crowd to buy low and sell high is very profitable, as all these trades averaged stellar annualized realized gains of +21.2%!
The key to this success is staying informed and being contrarian. That means buying low when others are scared, like late in this year’s vexing consolidation. An easy way to keep abreast is through our acclaimed weekly and monthly newsletters. They draw on our vast experience, knowledge, wisdom, and ongoing research to explain what’s going on in the markets, why, and how to trade them with specific stocks. For only $10 per issue, you can learn to think, trade, and thrive like contrarians. Subscribe today, and get deployed in the great gold stocks on our trading books before they surge far higher!
The bottom line is the mid-tier gold miners that now dominate GDXJ enjoyed strong fundamentals in their recently-reported Q2 results. Despite a flat comp-quarter gold price, they collectively mined more gold at lower costs. That naturally fueled better operating cash flows and profits. Today’s low gold-stock prices and popular bearishness are wildly unjustified fundamentally, an anomaly that doesn’t reflect operations.
As gold itself continues mean reverting higher, these mid-tier gold miners will see their profits soar due to their big inherent leverage to gold. GDXJ now offers excellent exposure to mid-tier gold miners, which will see gains well outpacing the majors. But if you are looking for the extreme upside likely in true junior gold miners, avoid today’s GDXJ and buy individual stocks. GDXJ is no longer a “Junior Gold Miners ETF”!

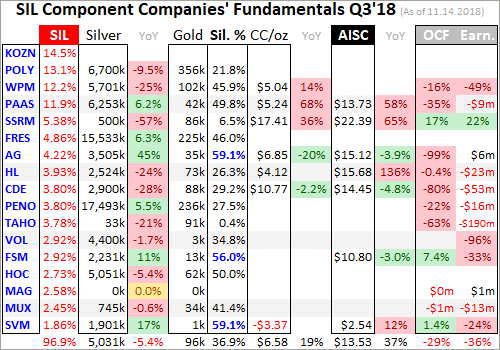
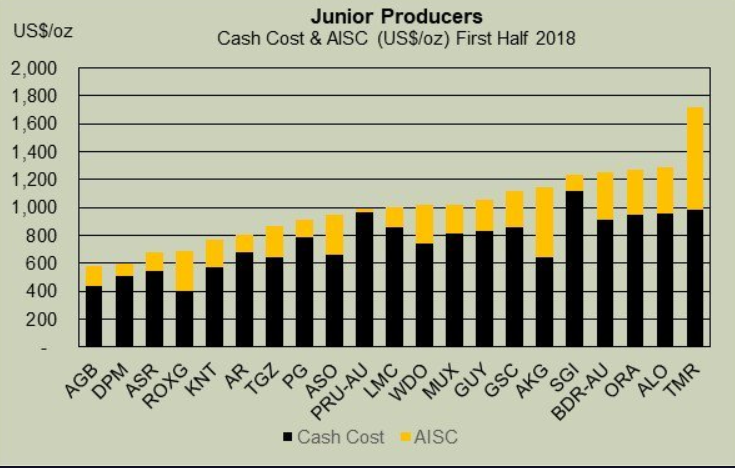

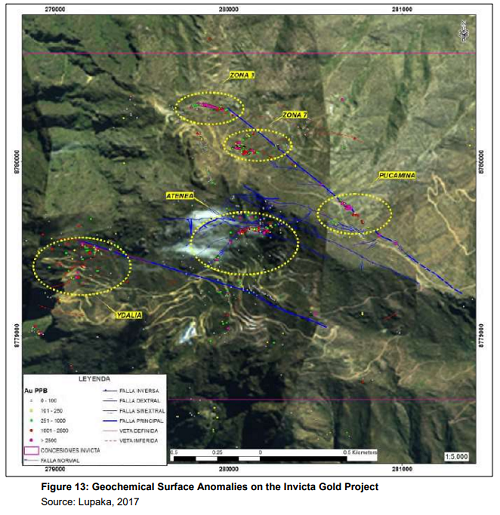
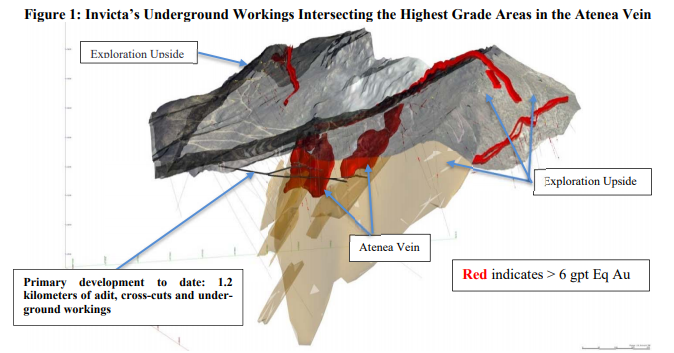
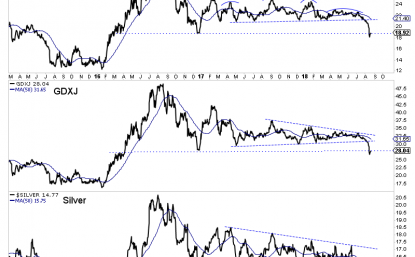
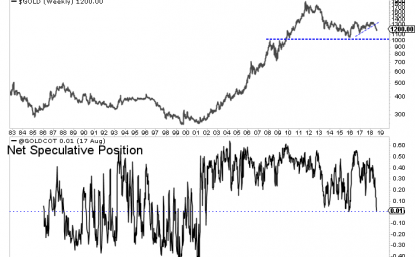

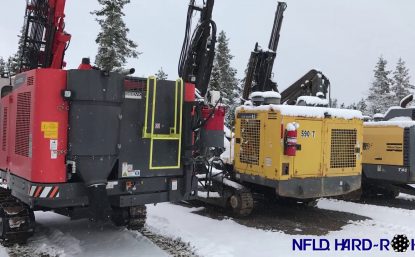

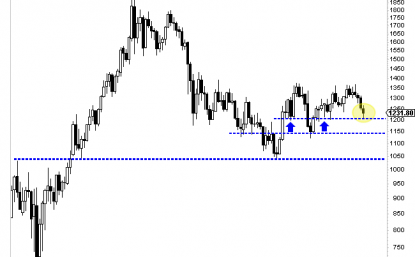
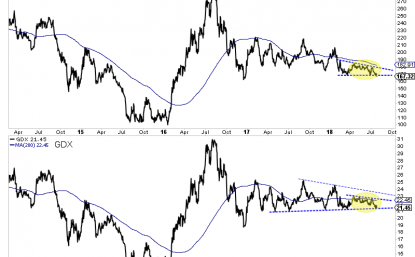
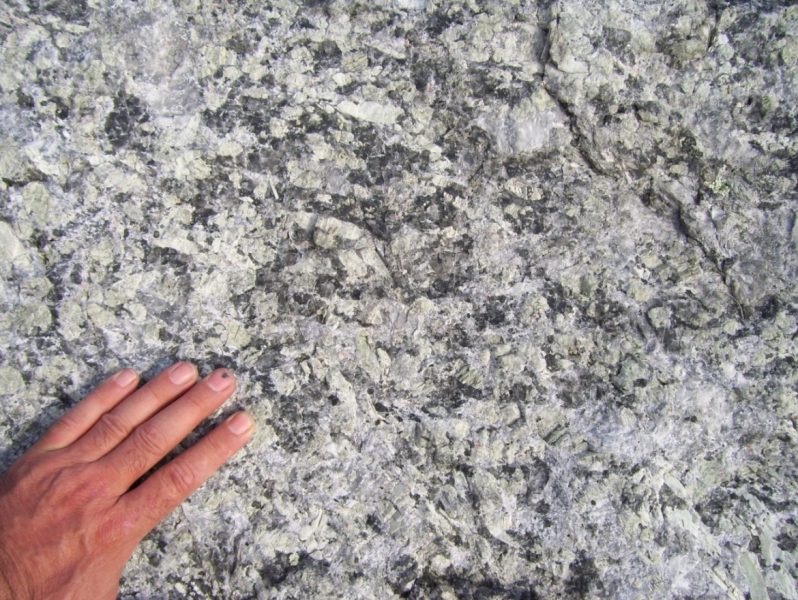
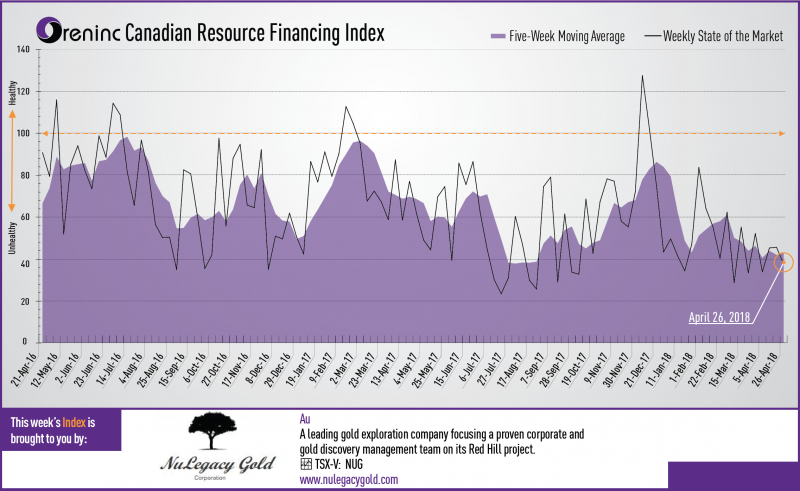

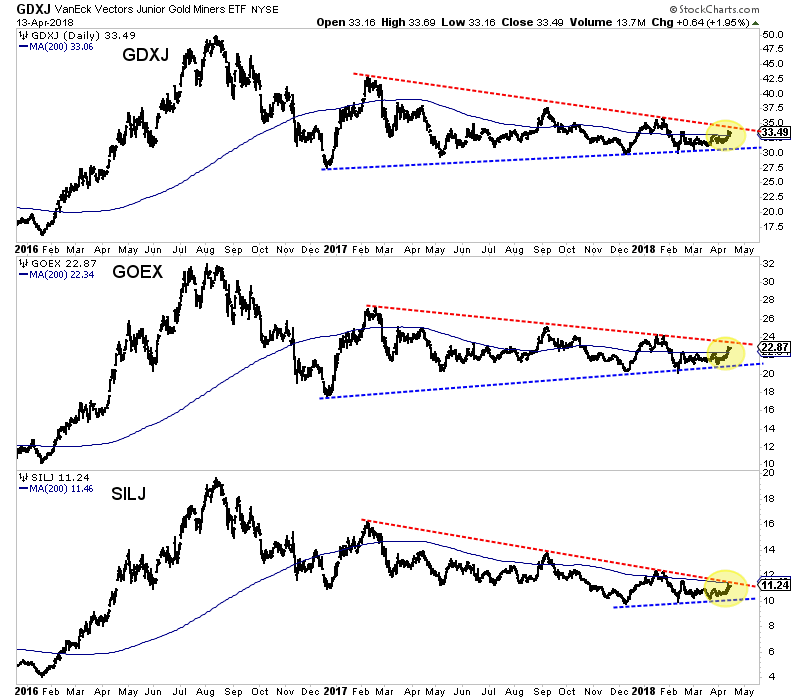
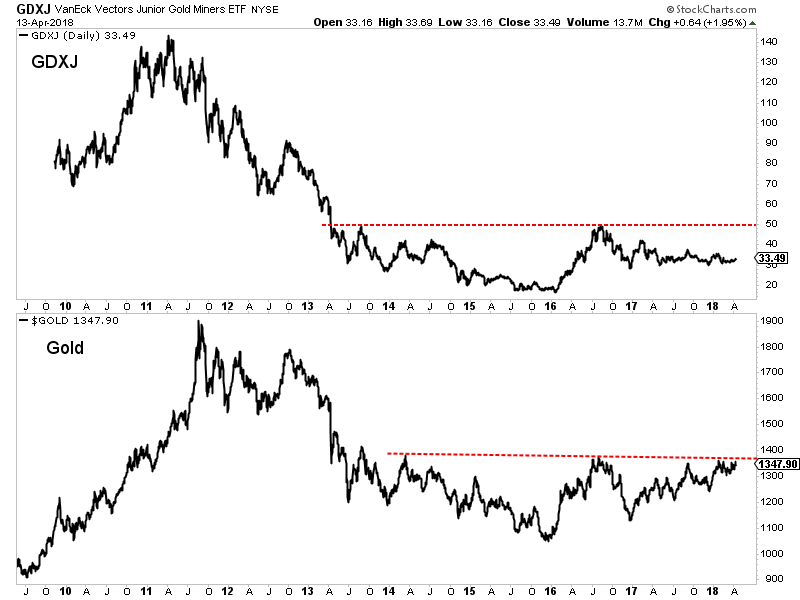
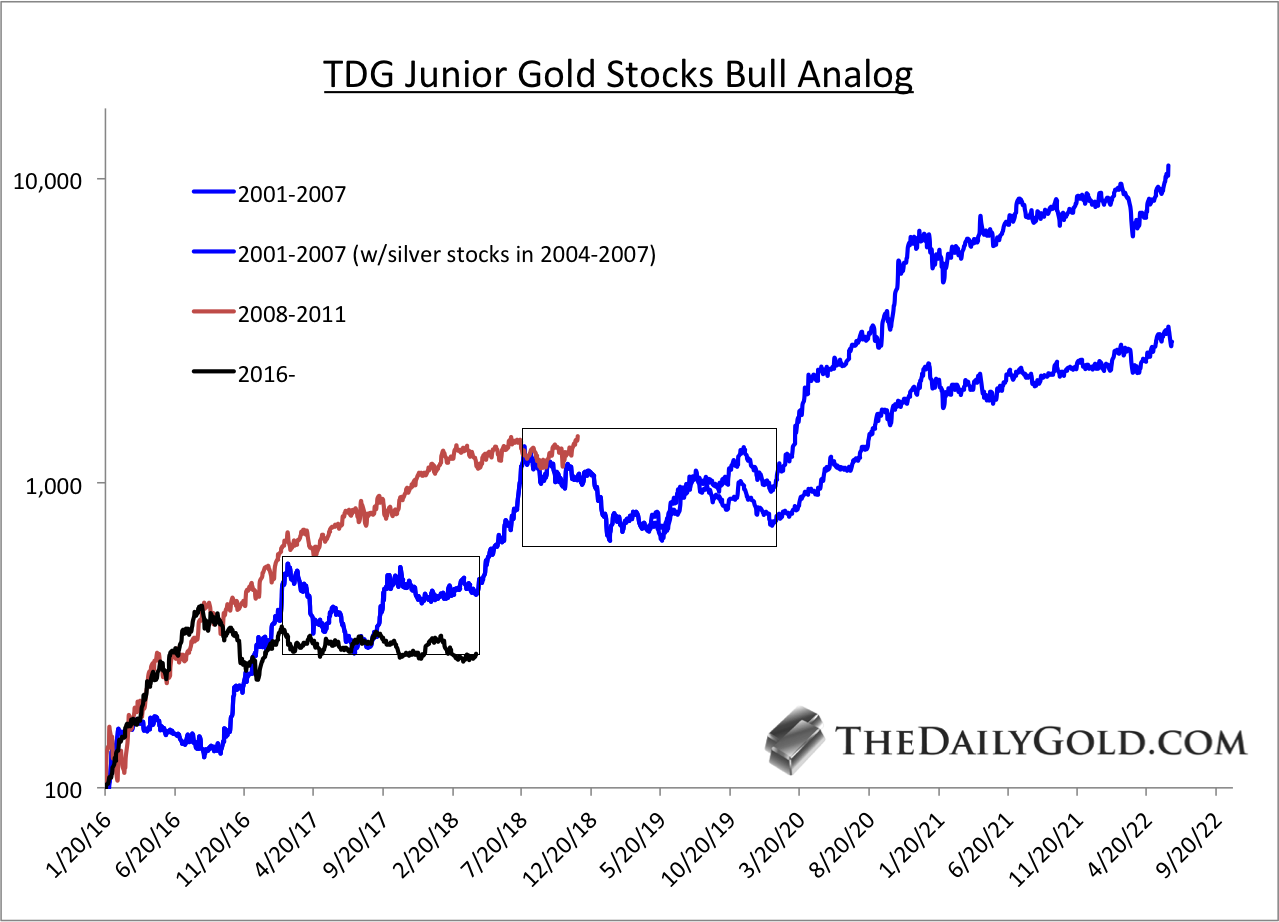
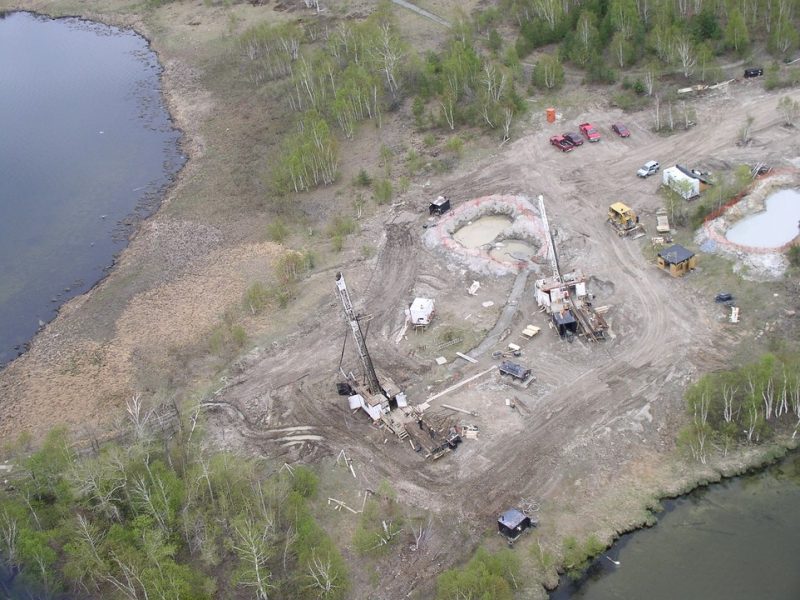
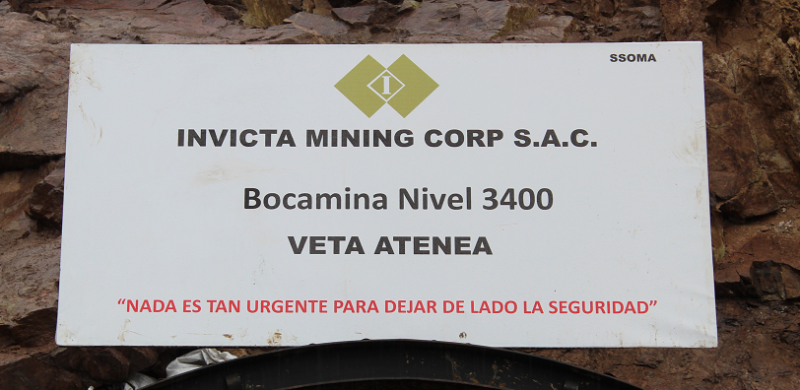

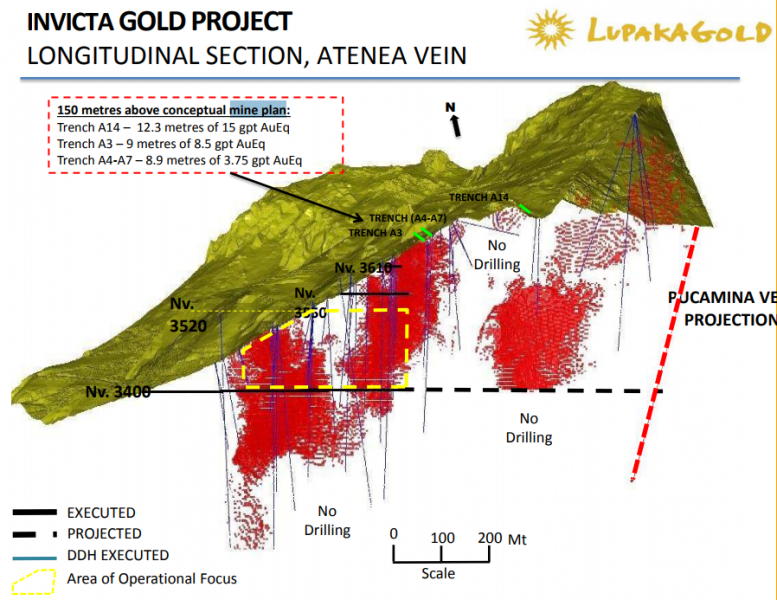
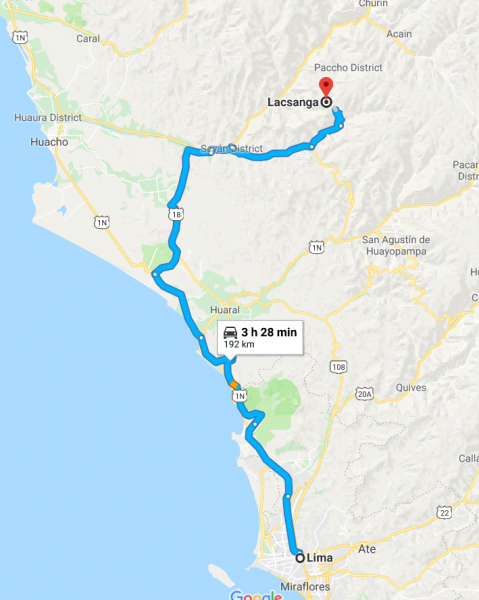
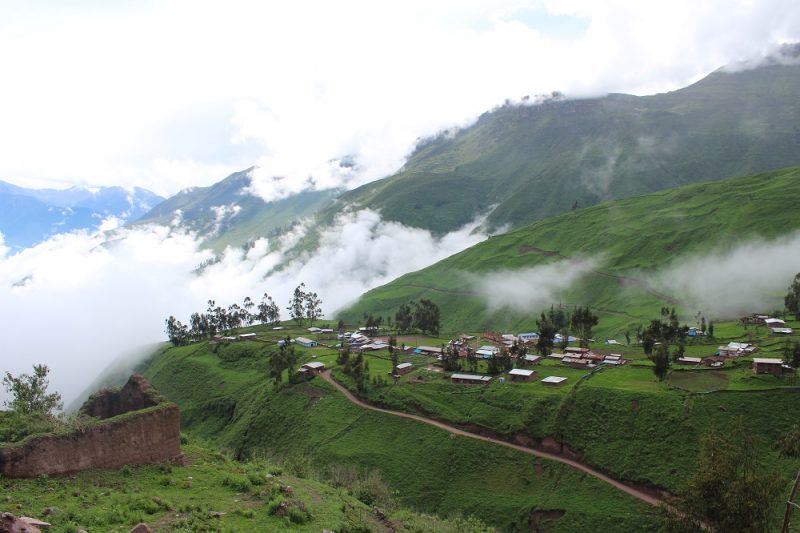
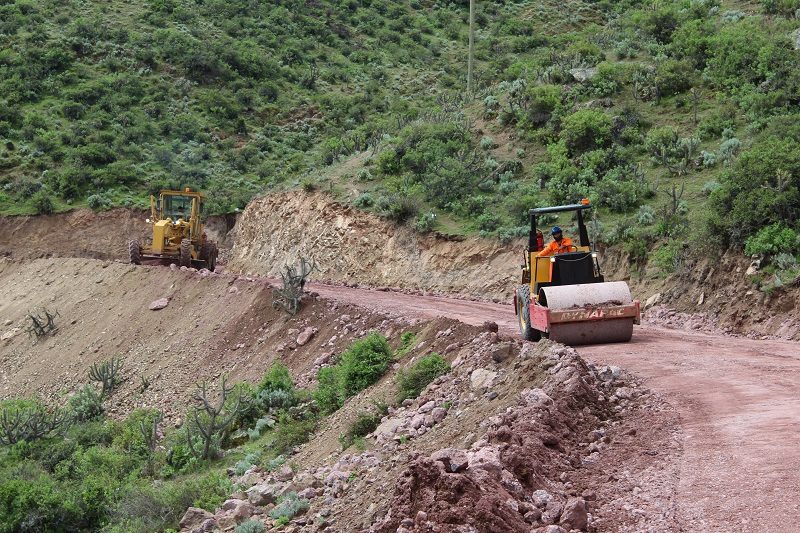
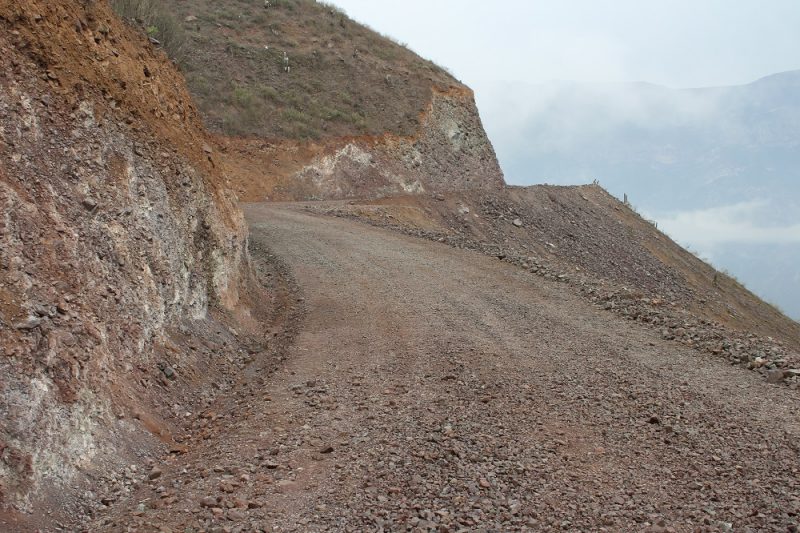
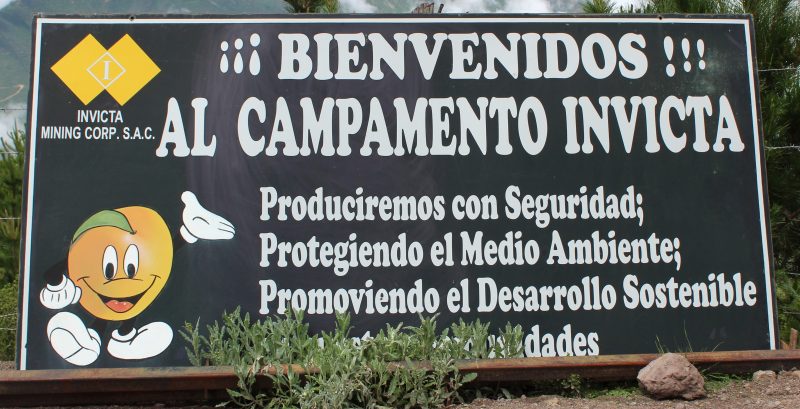
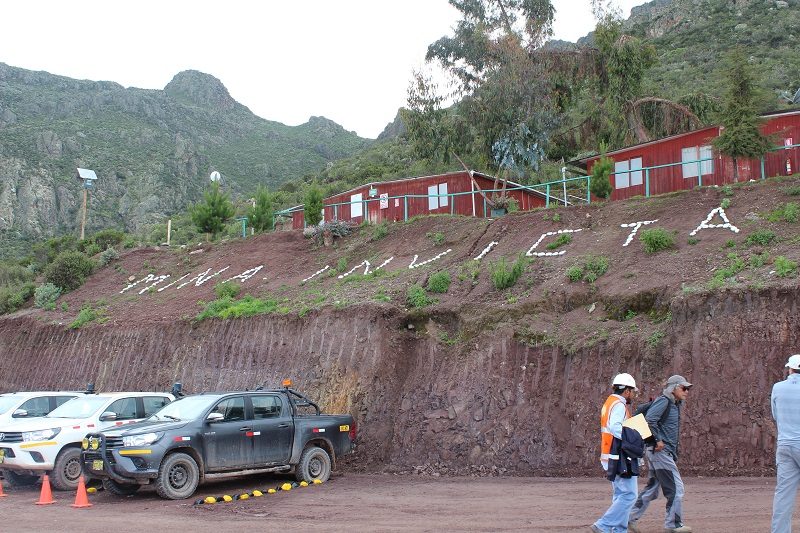
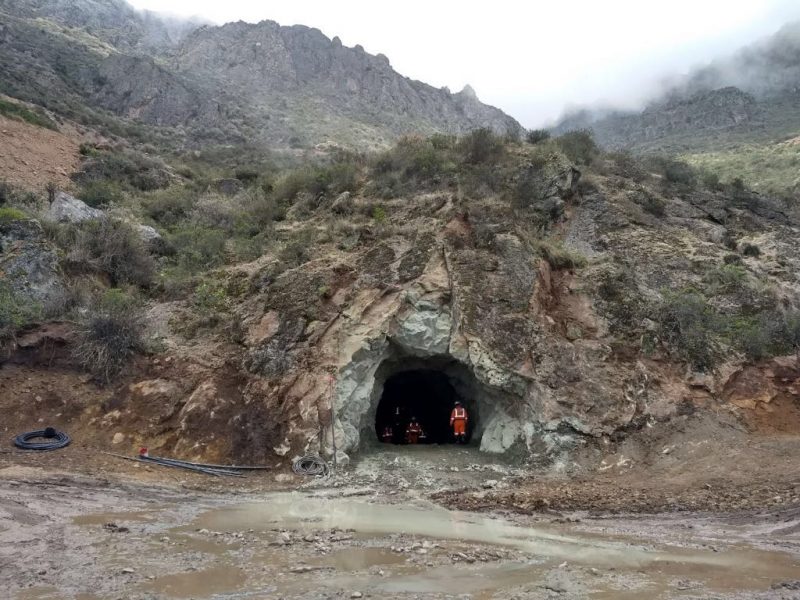
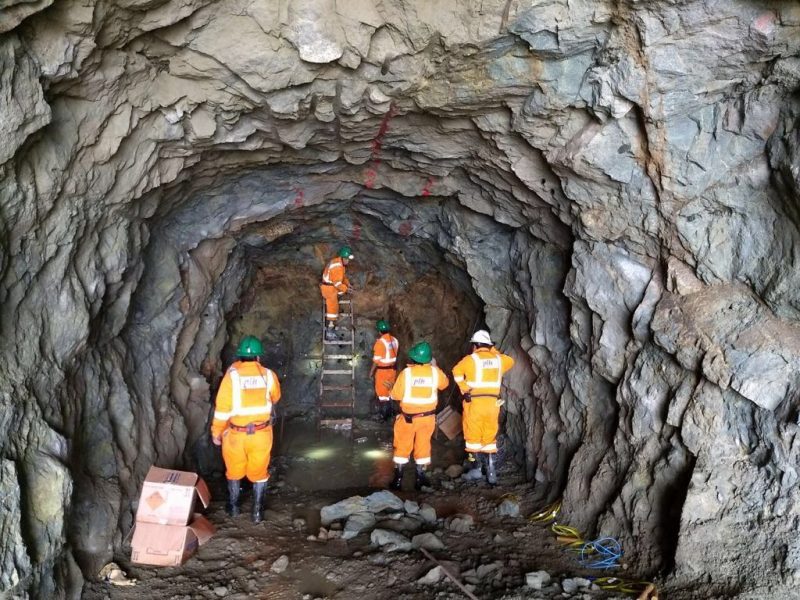
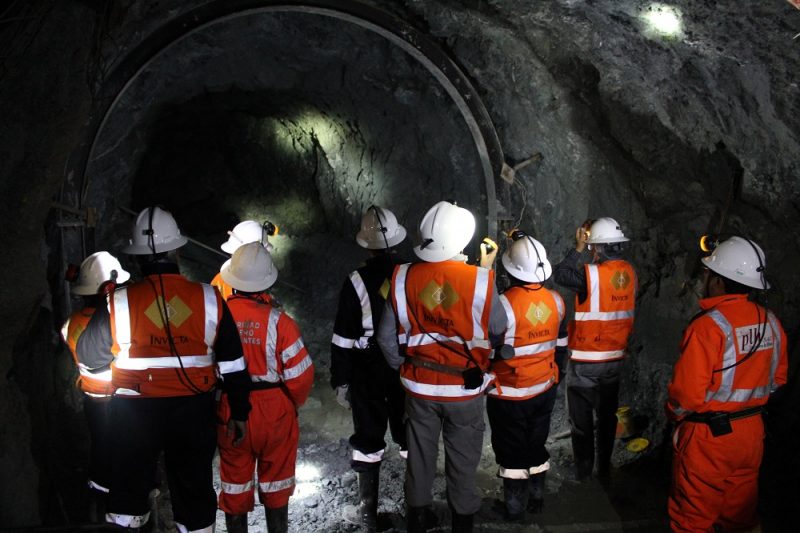
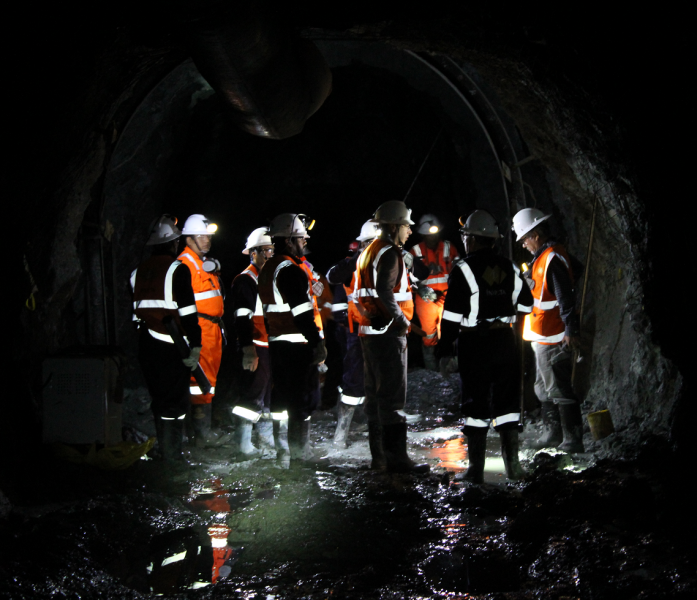


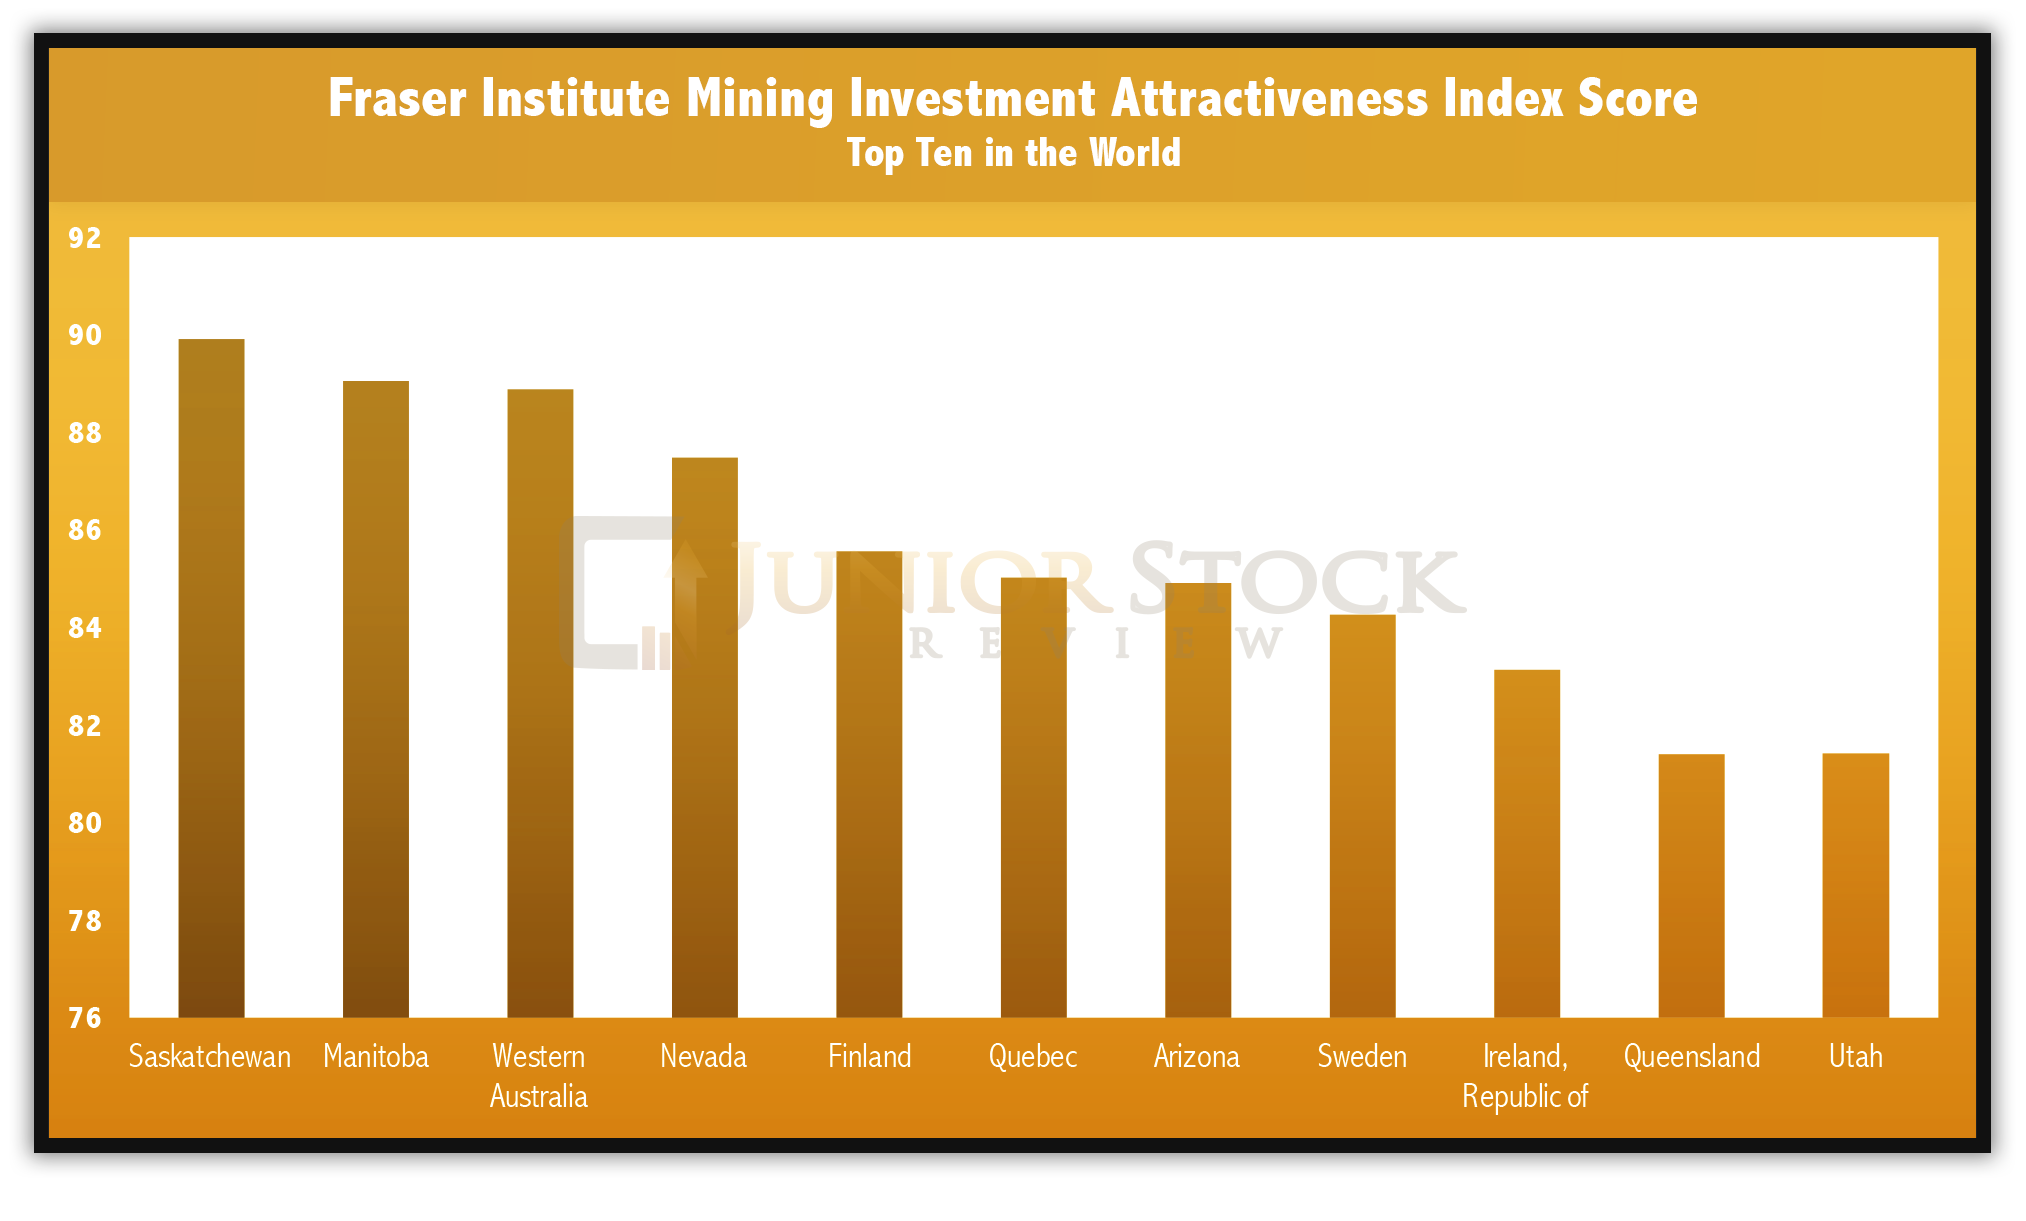
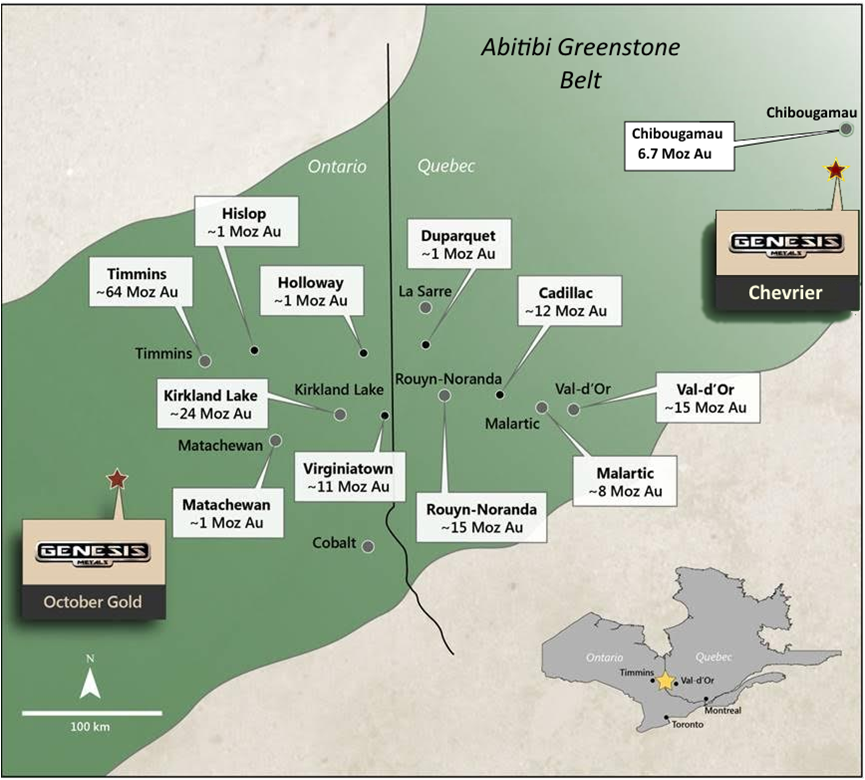

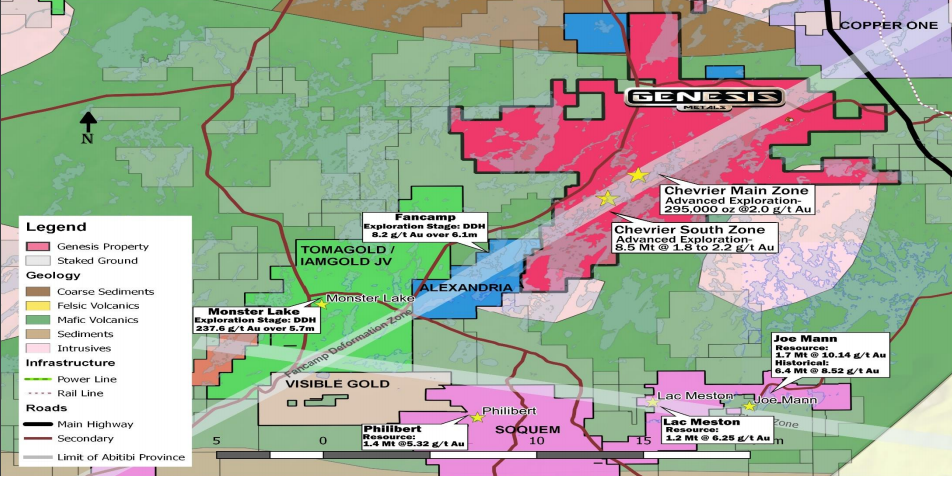
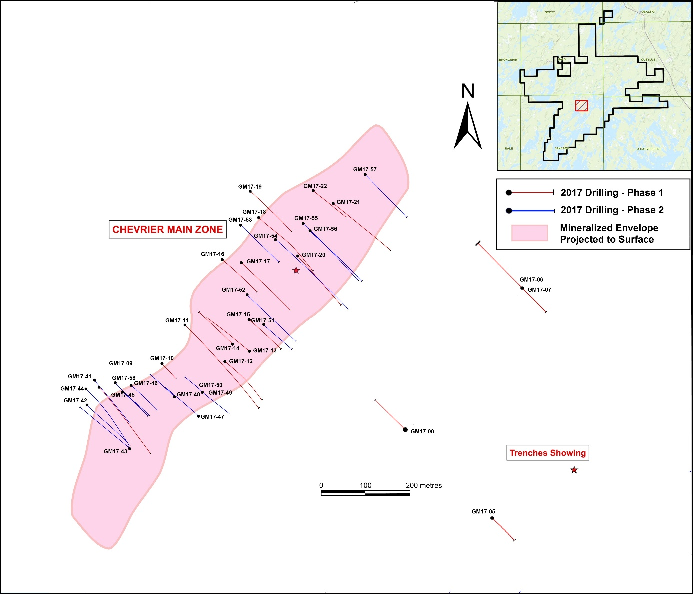
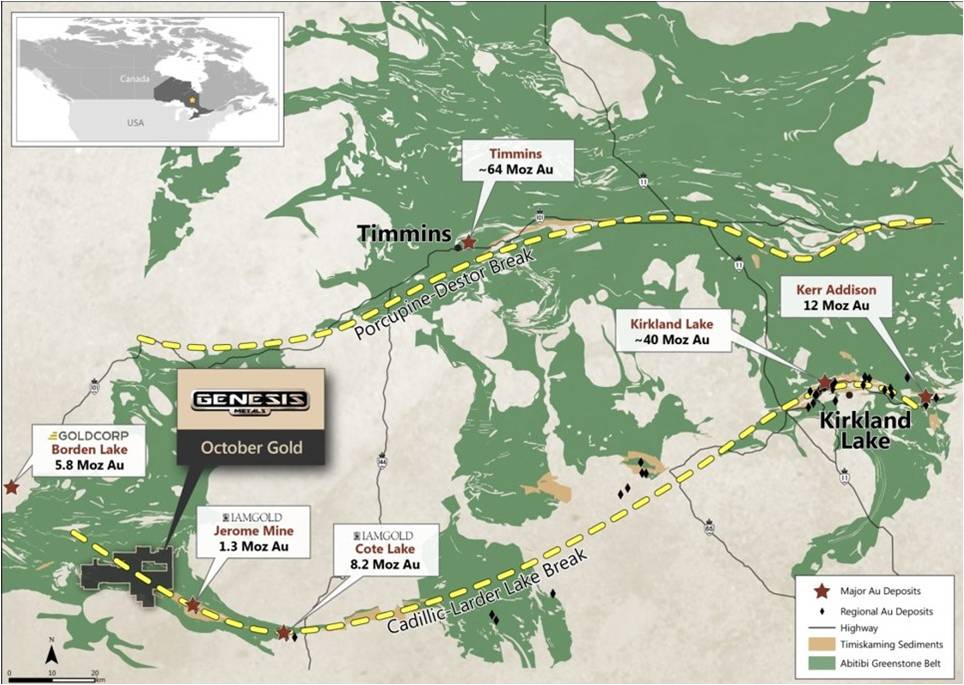

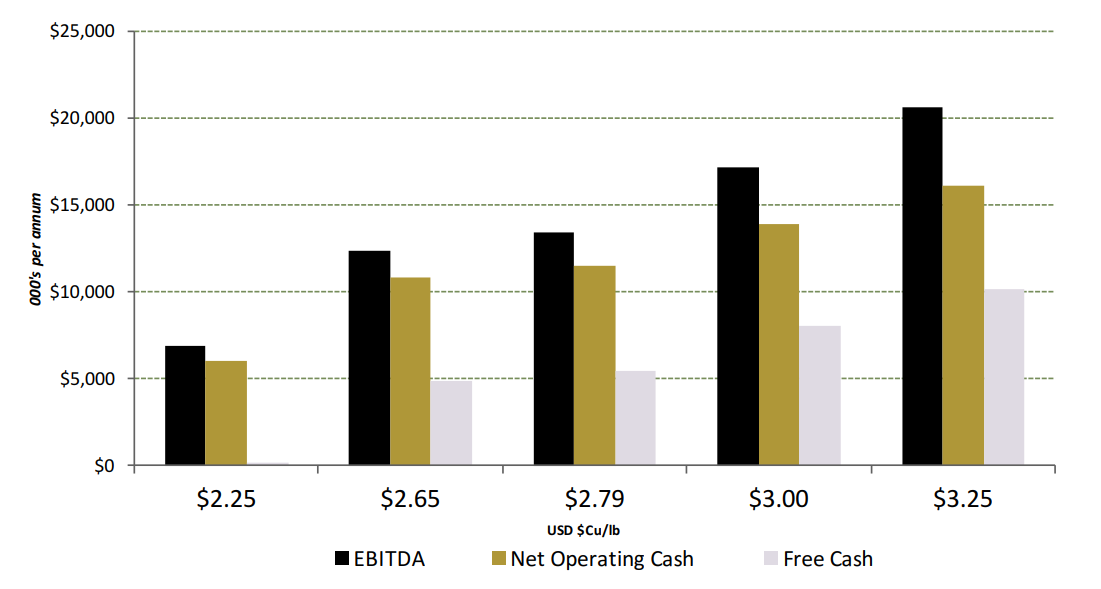

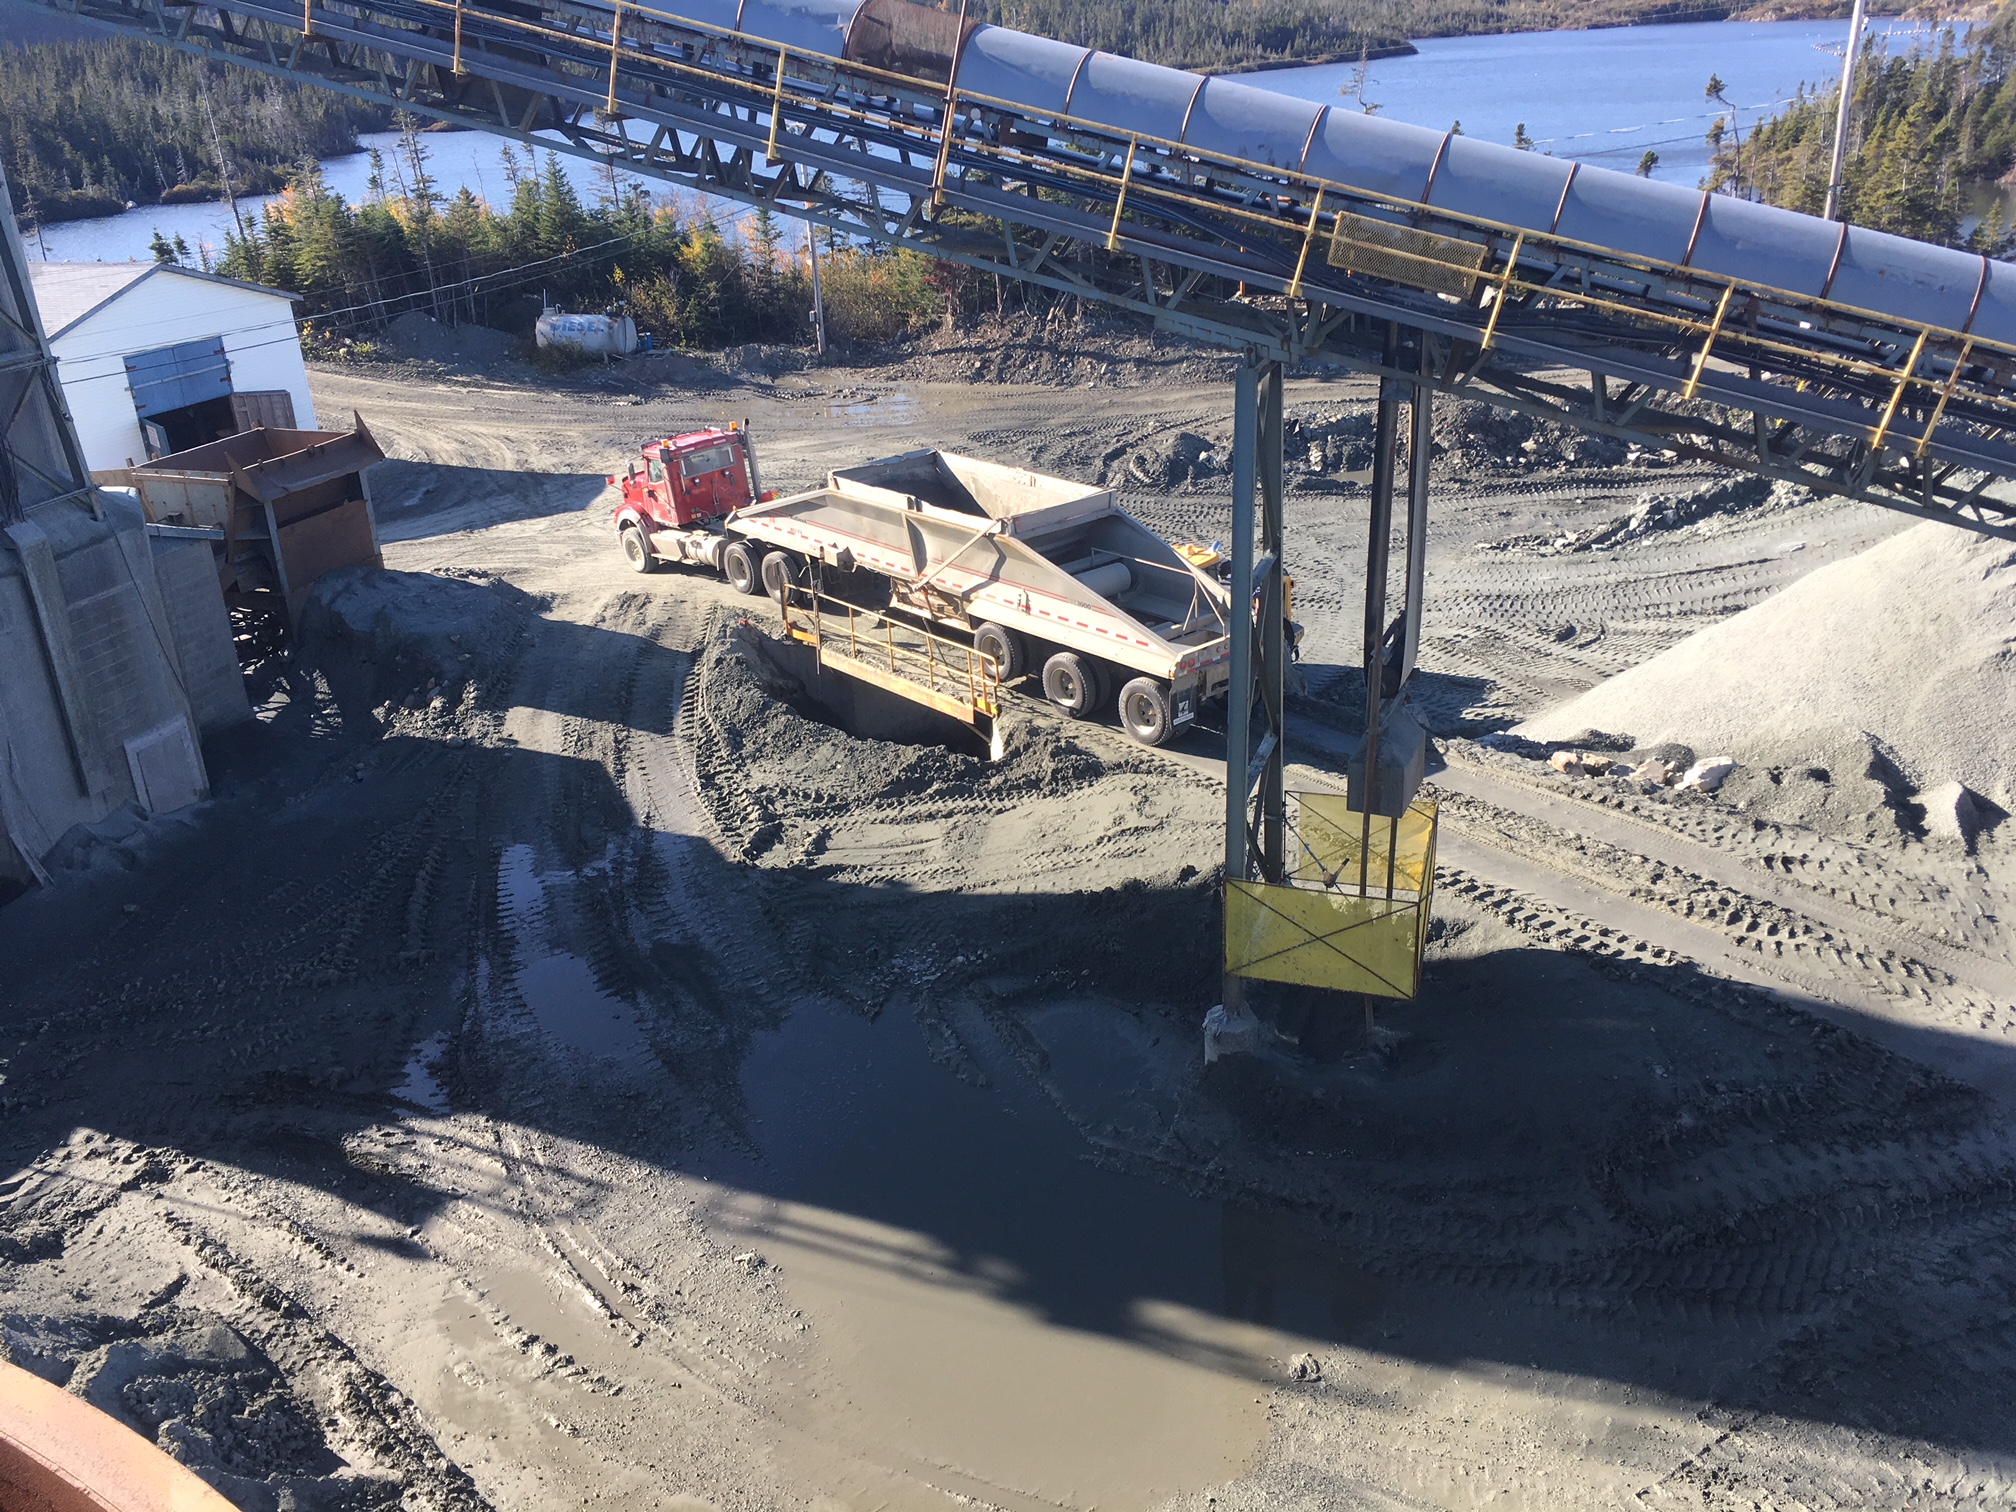
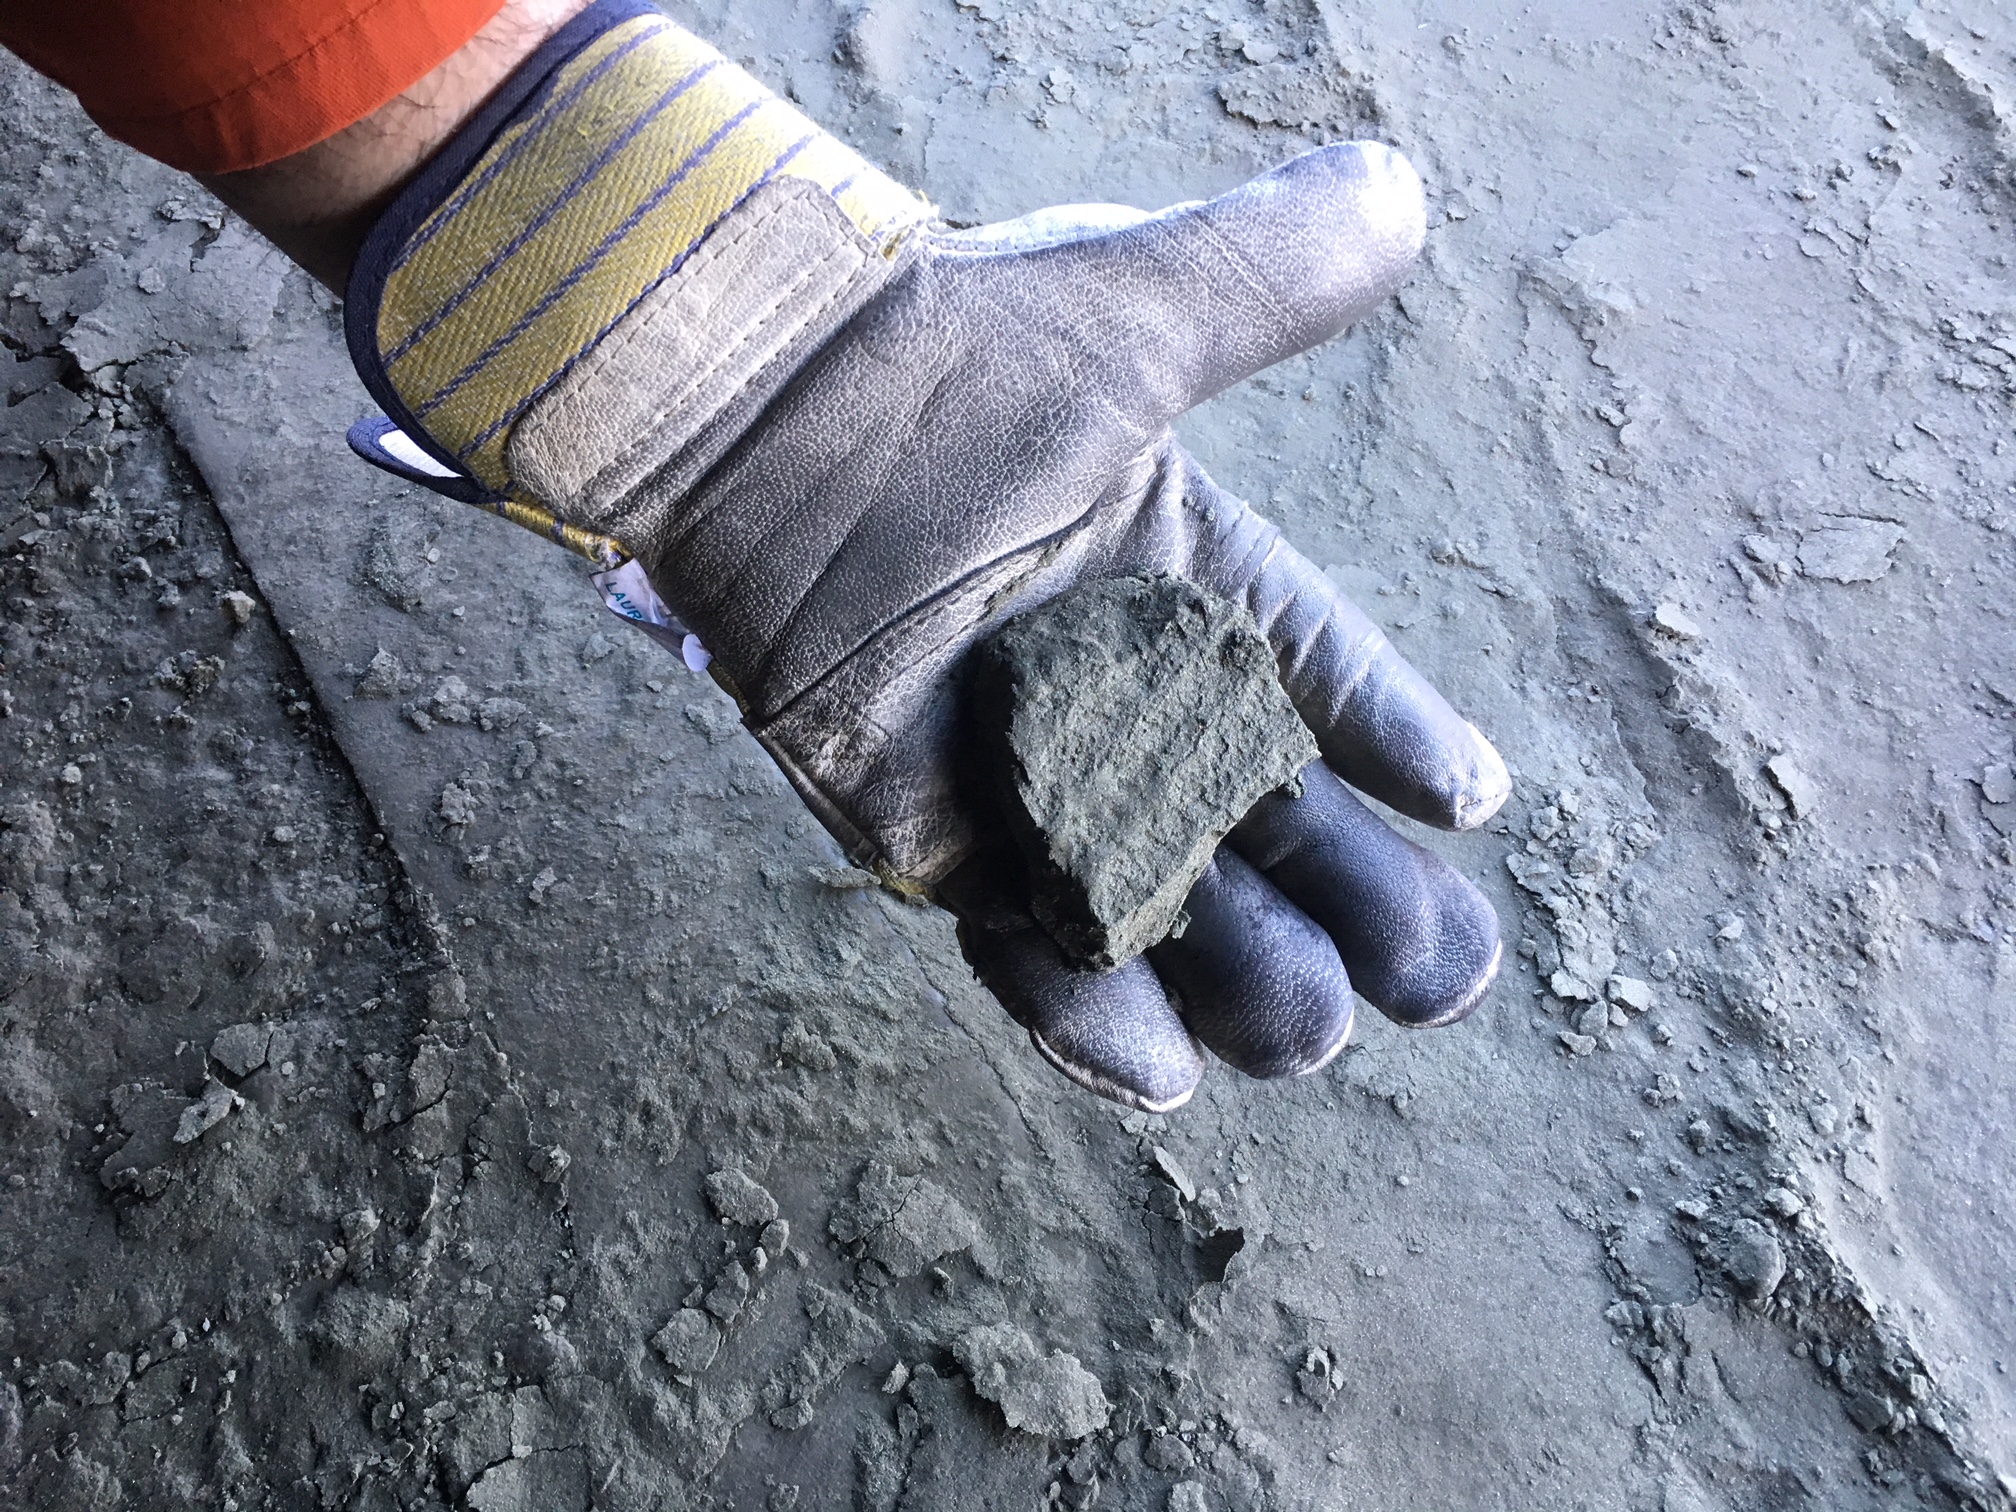
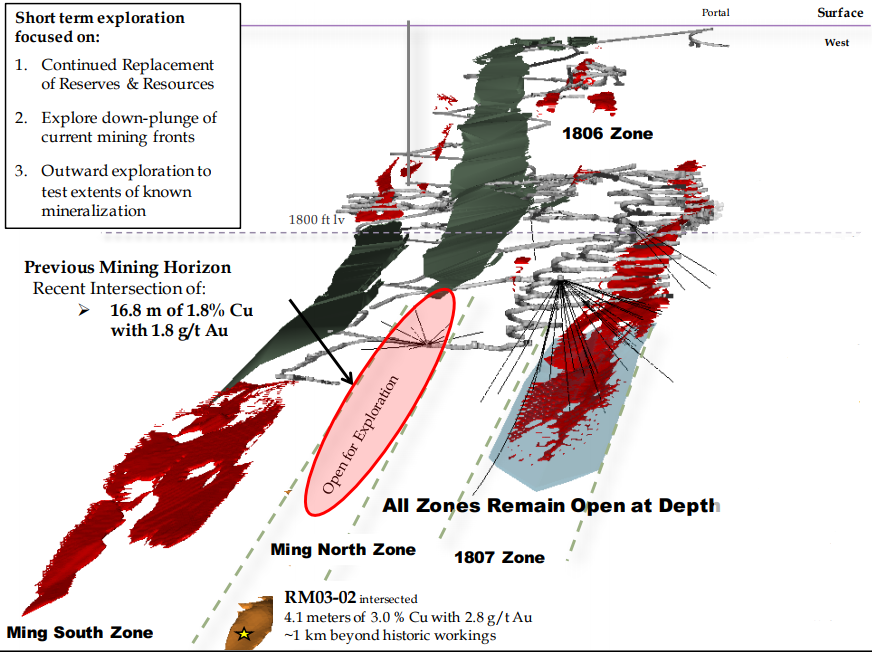
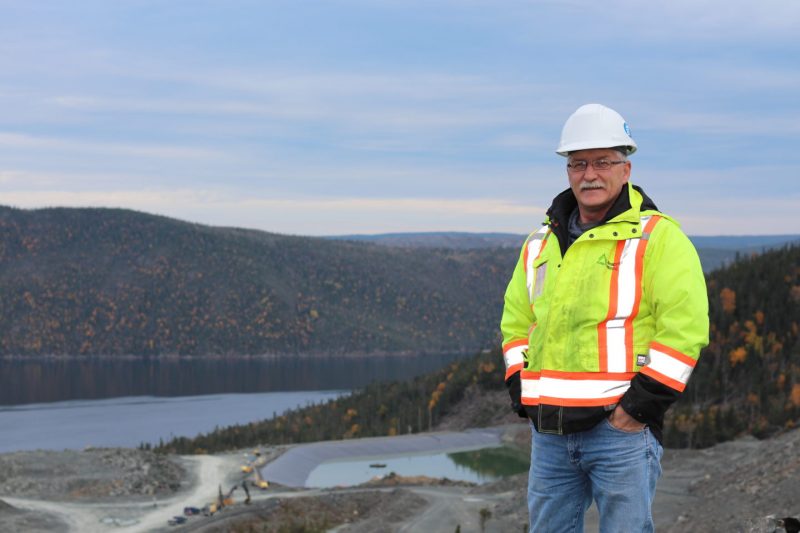


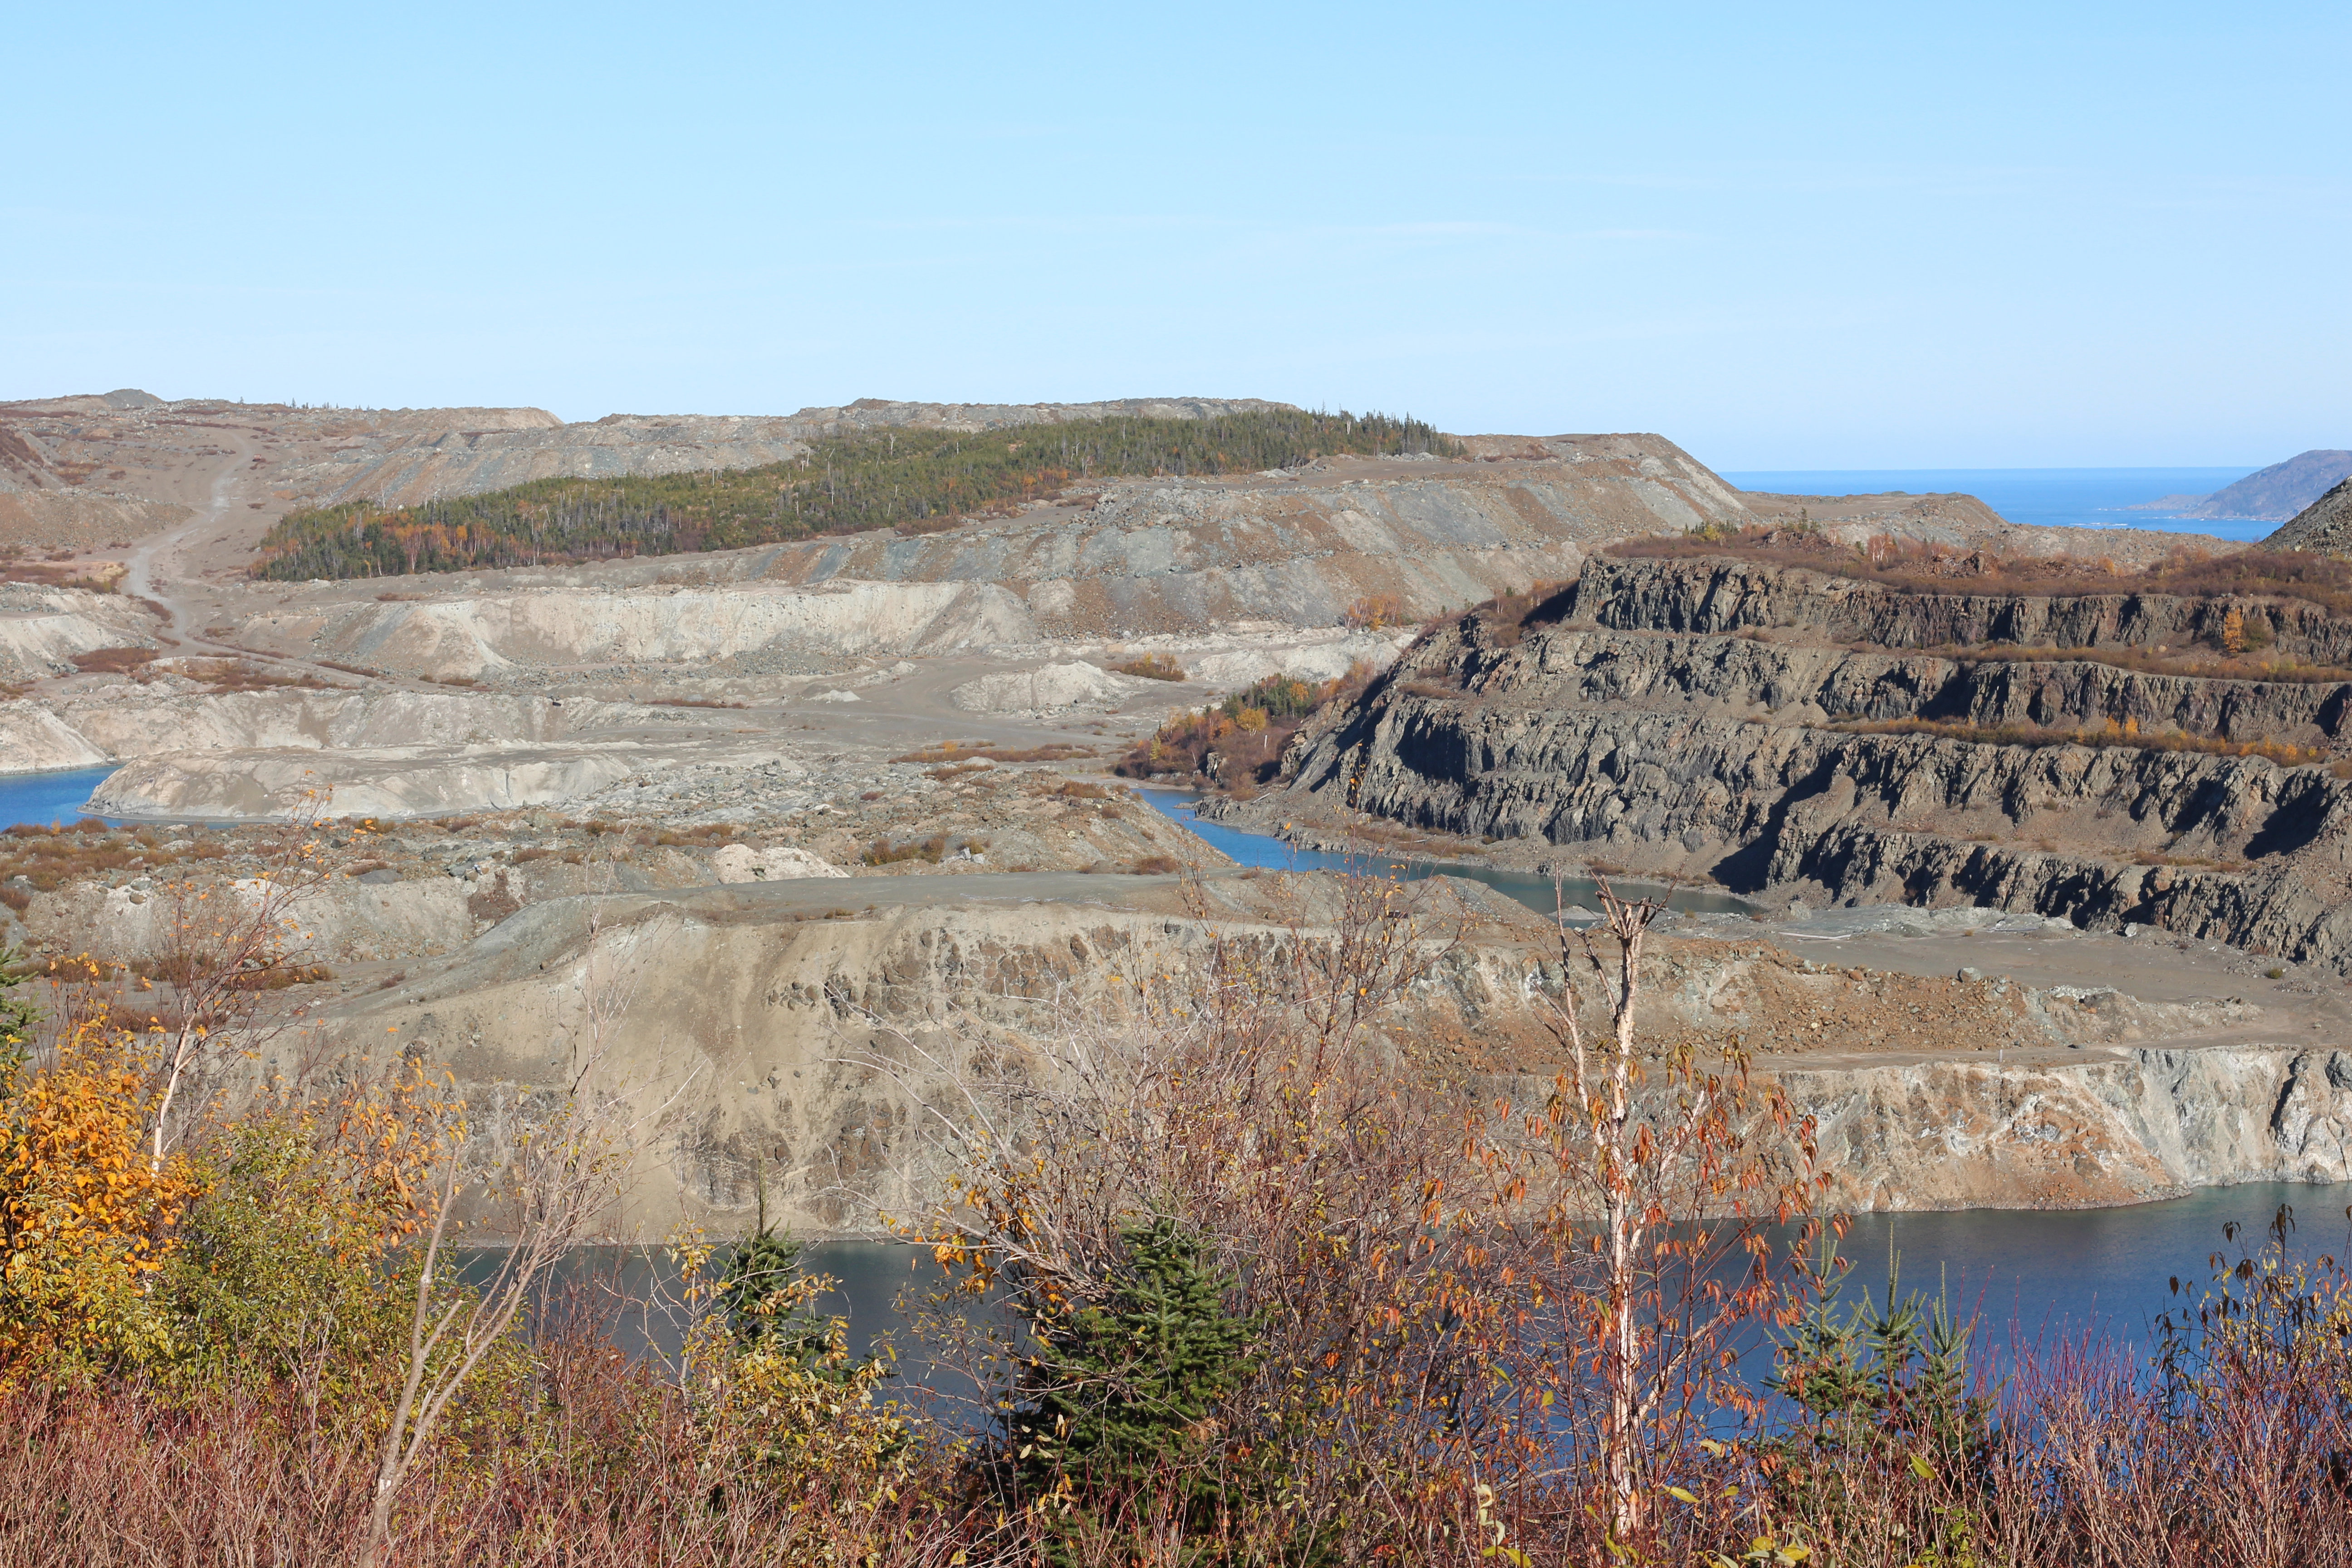

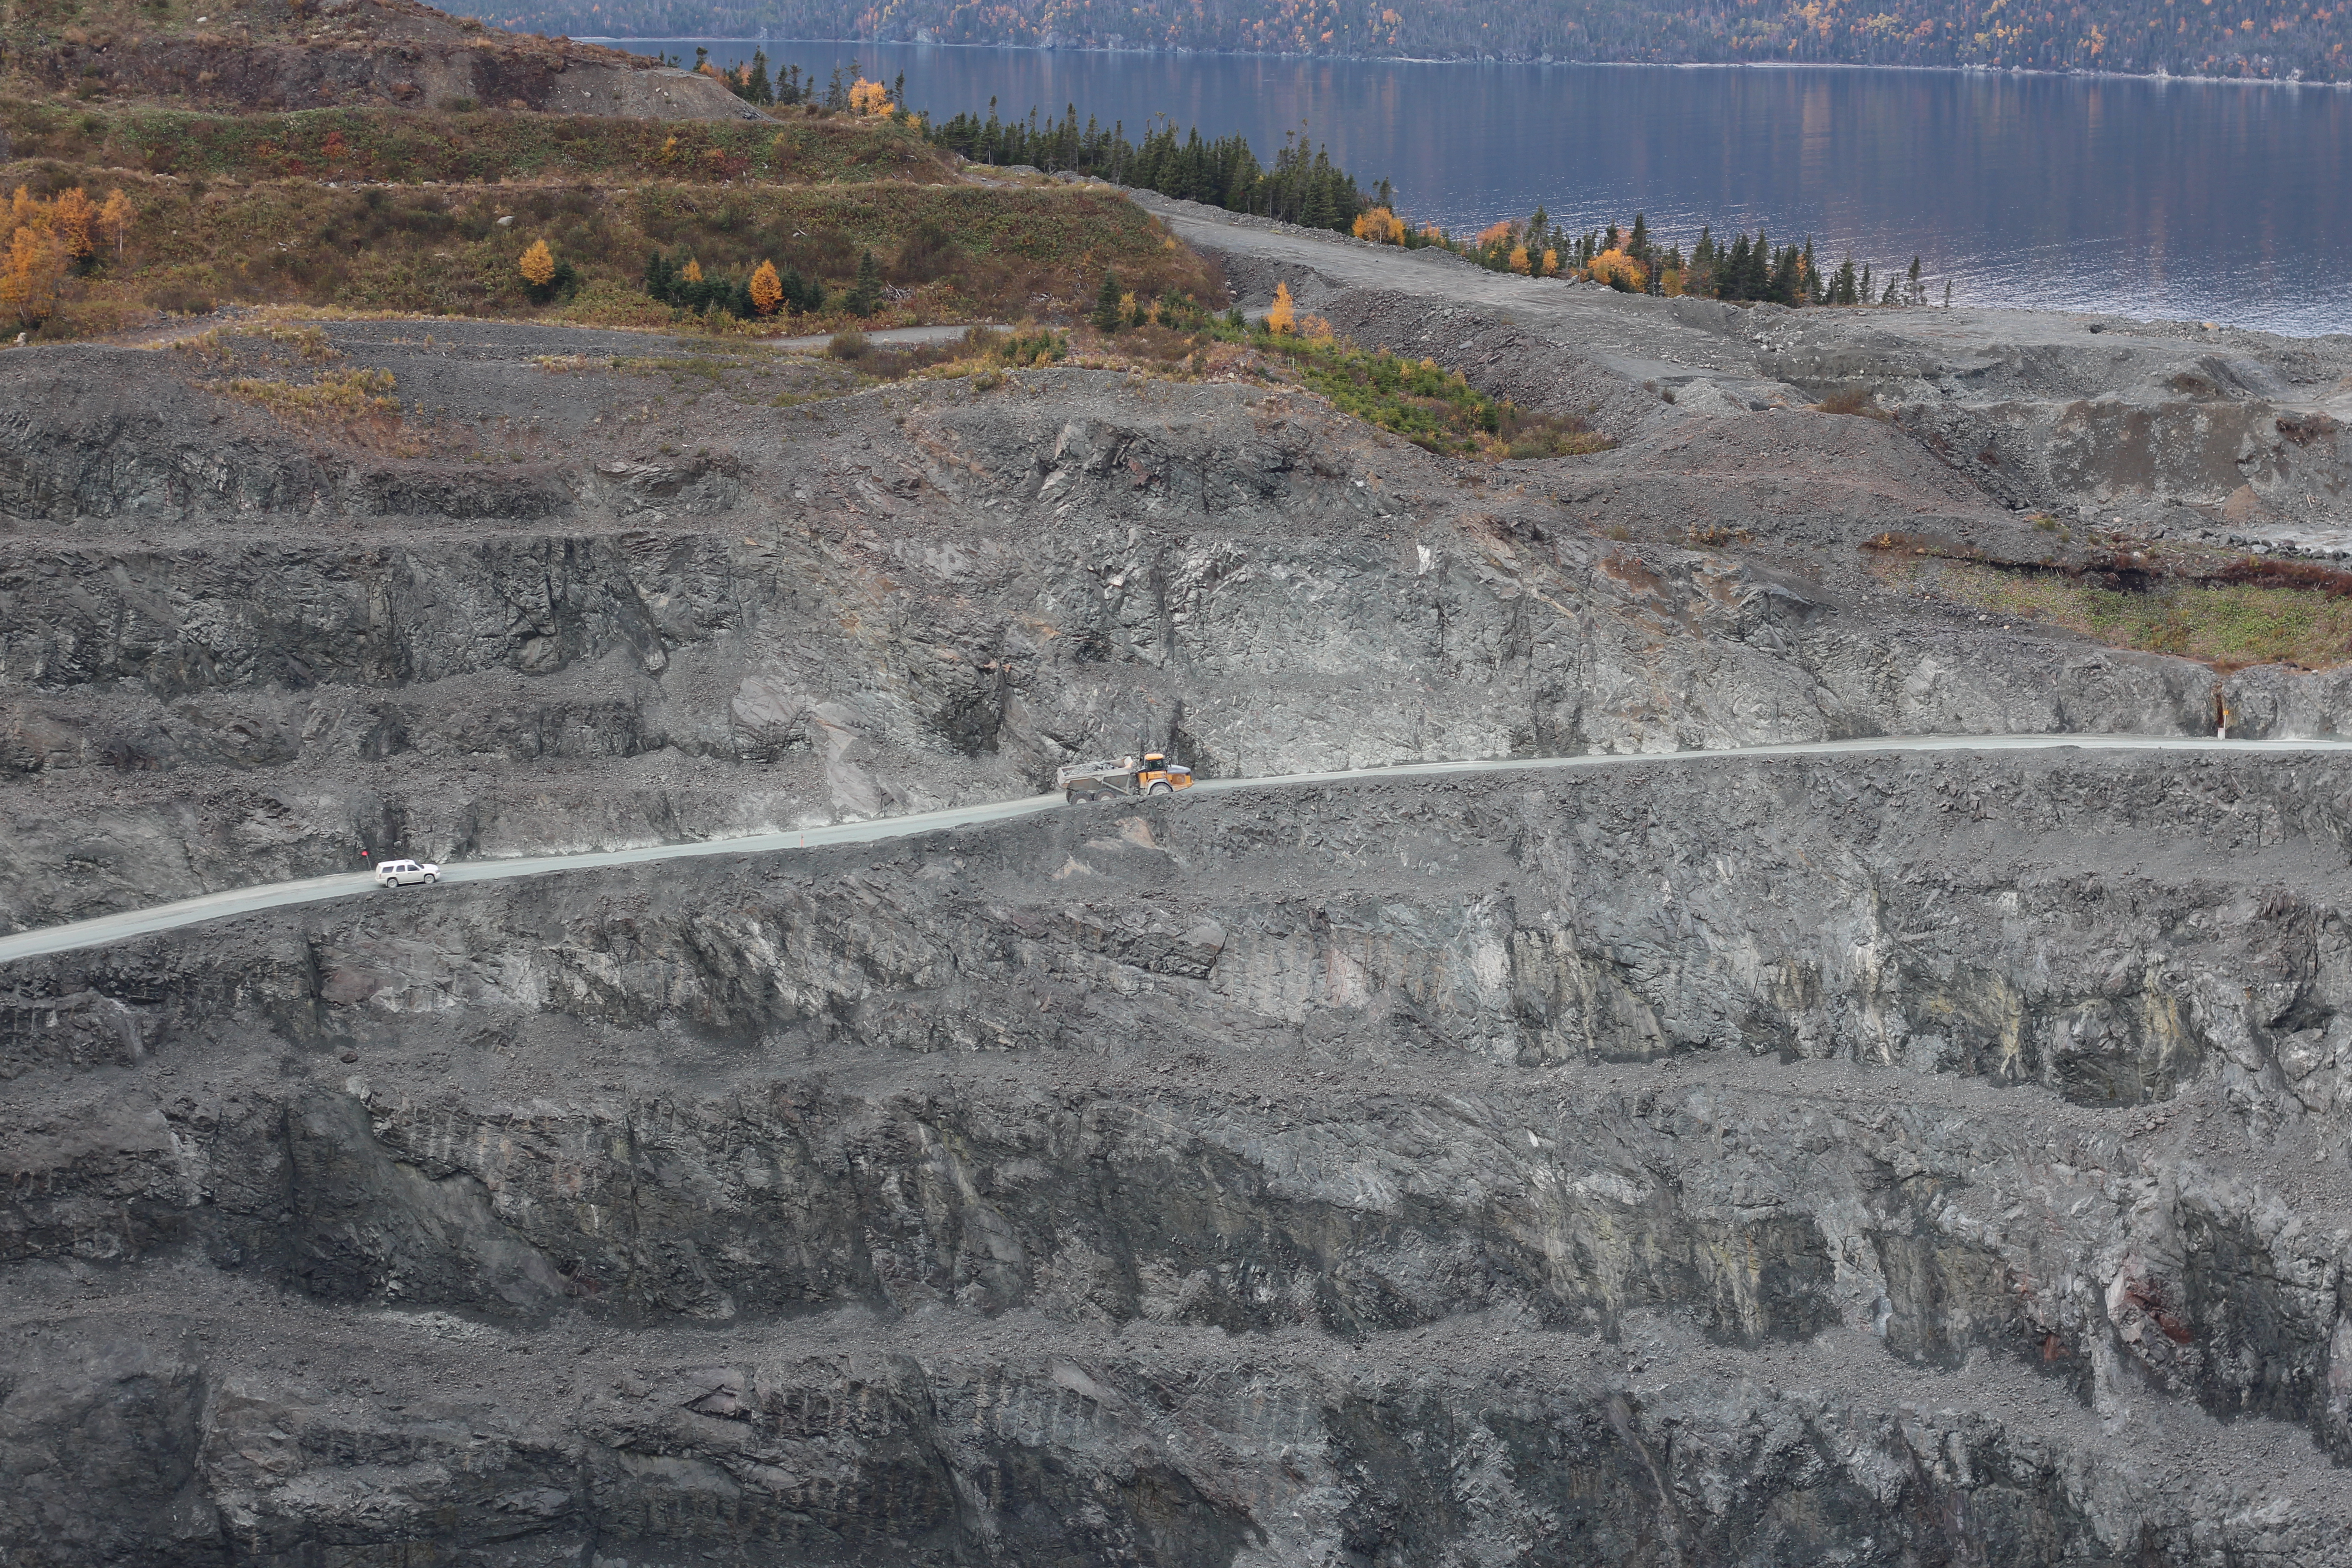
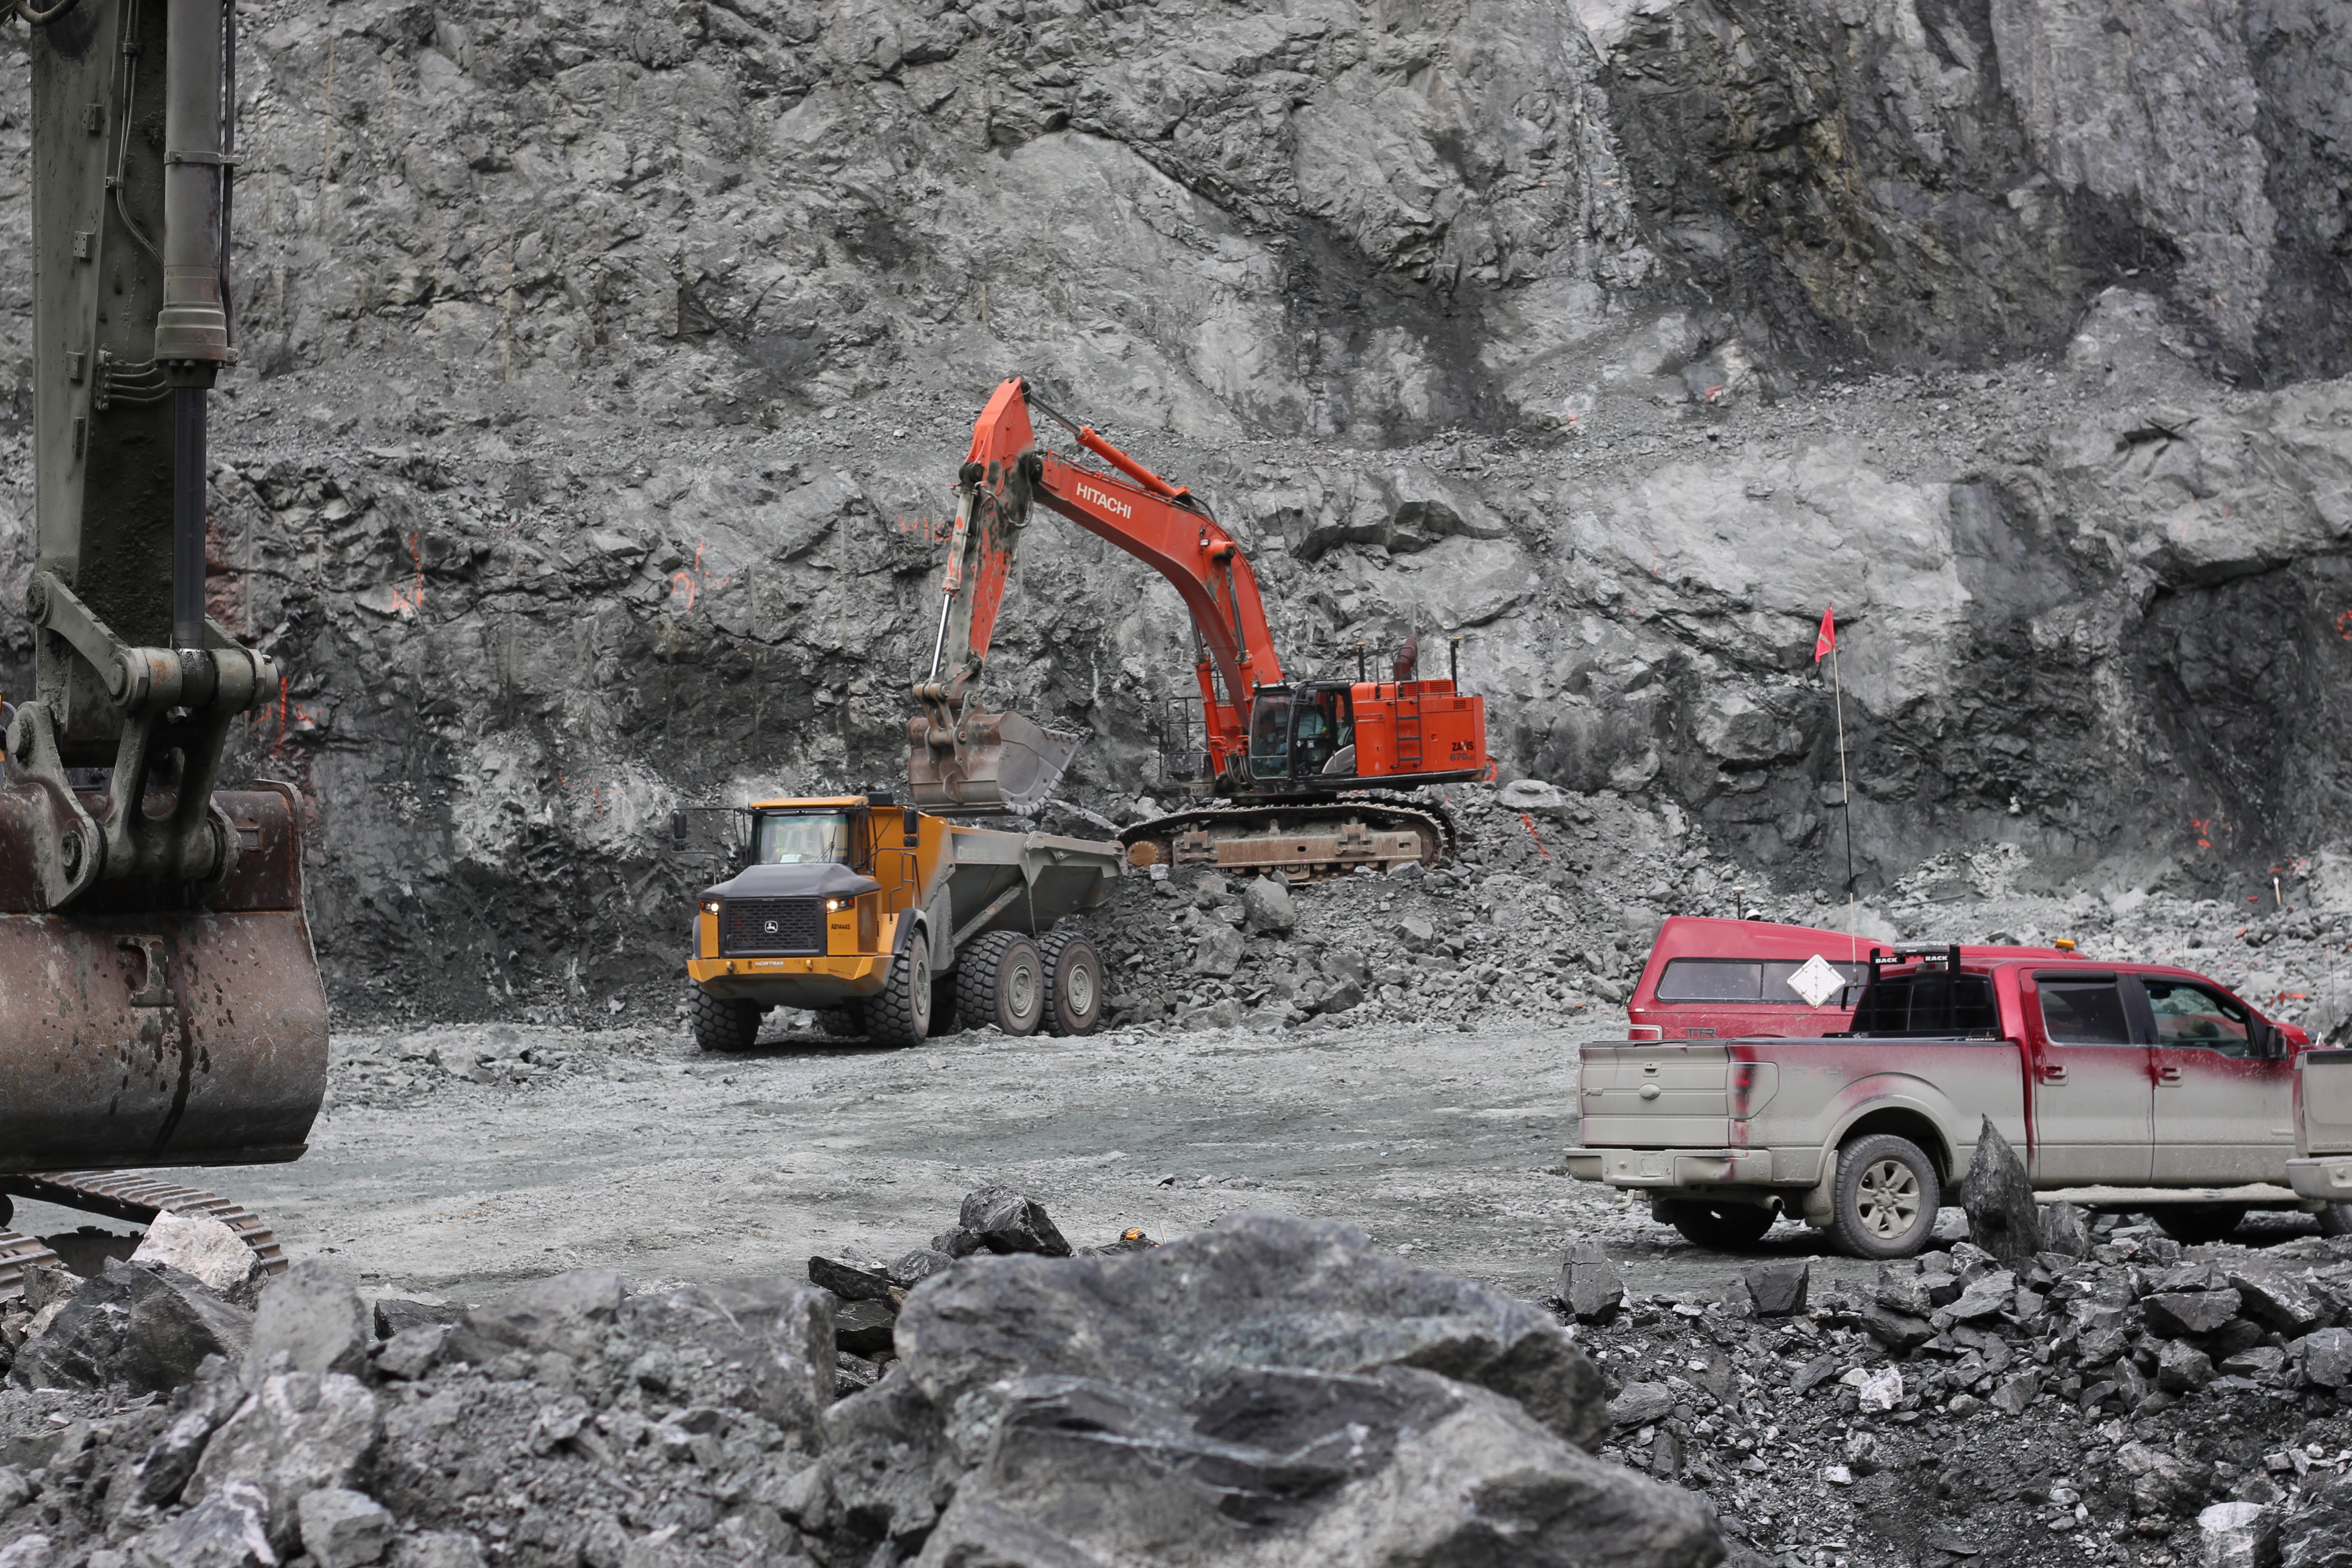
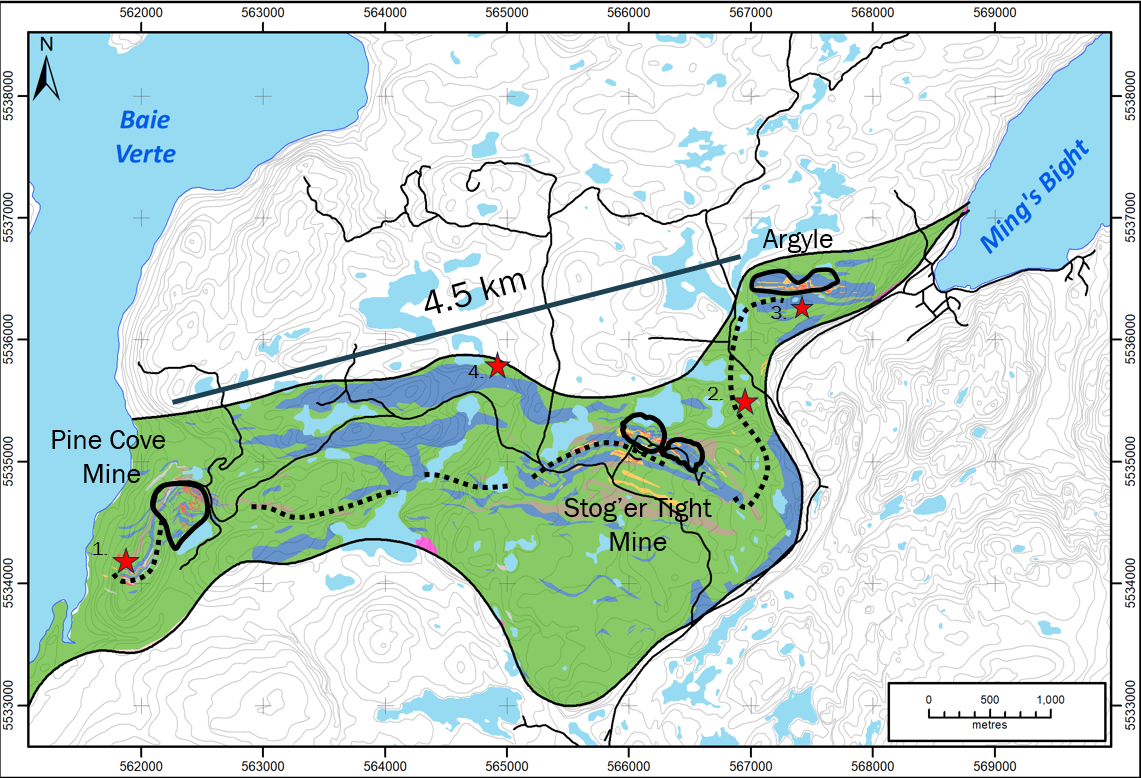
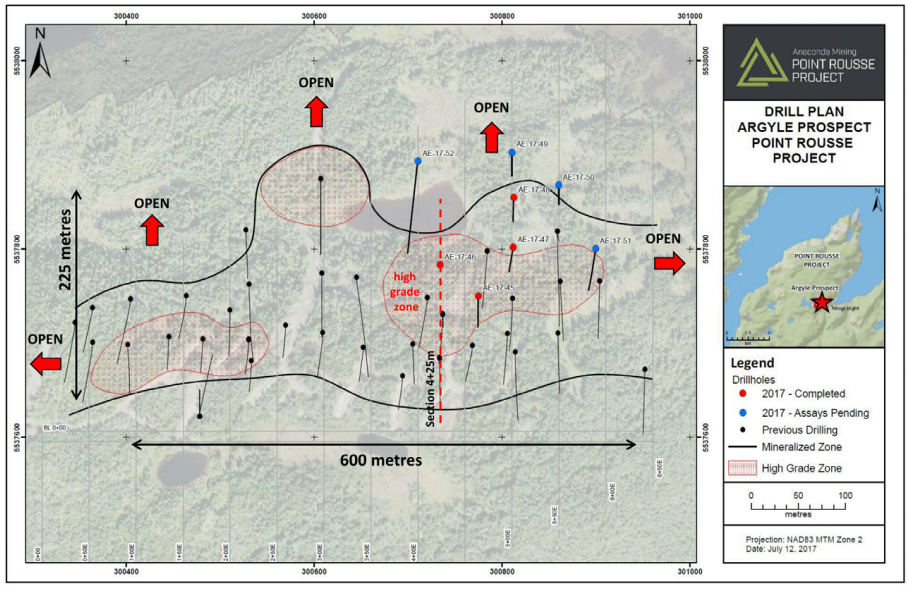
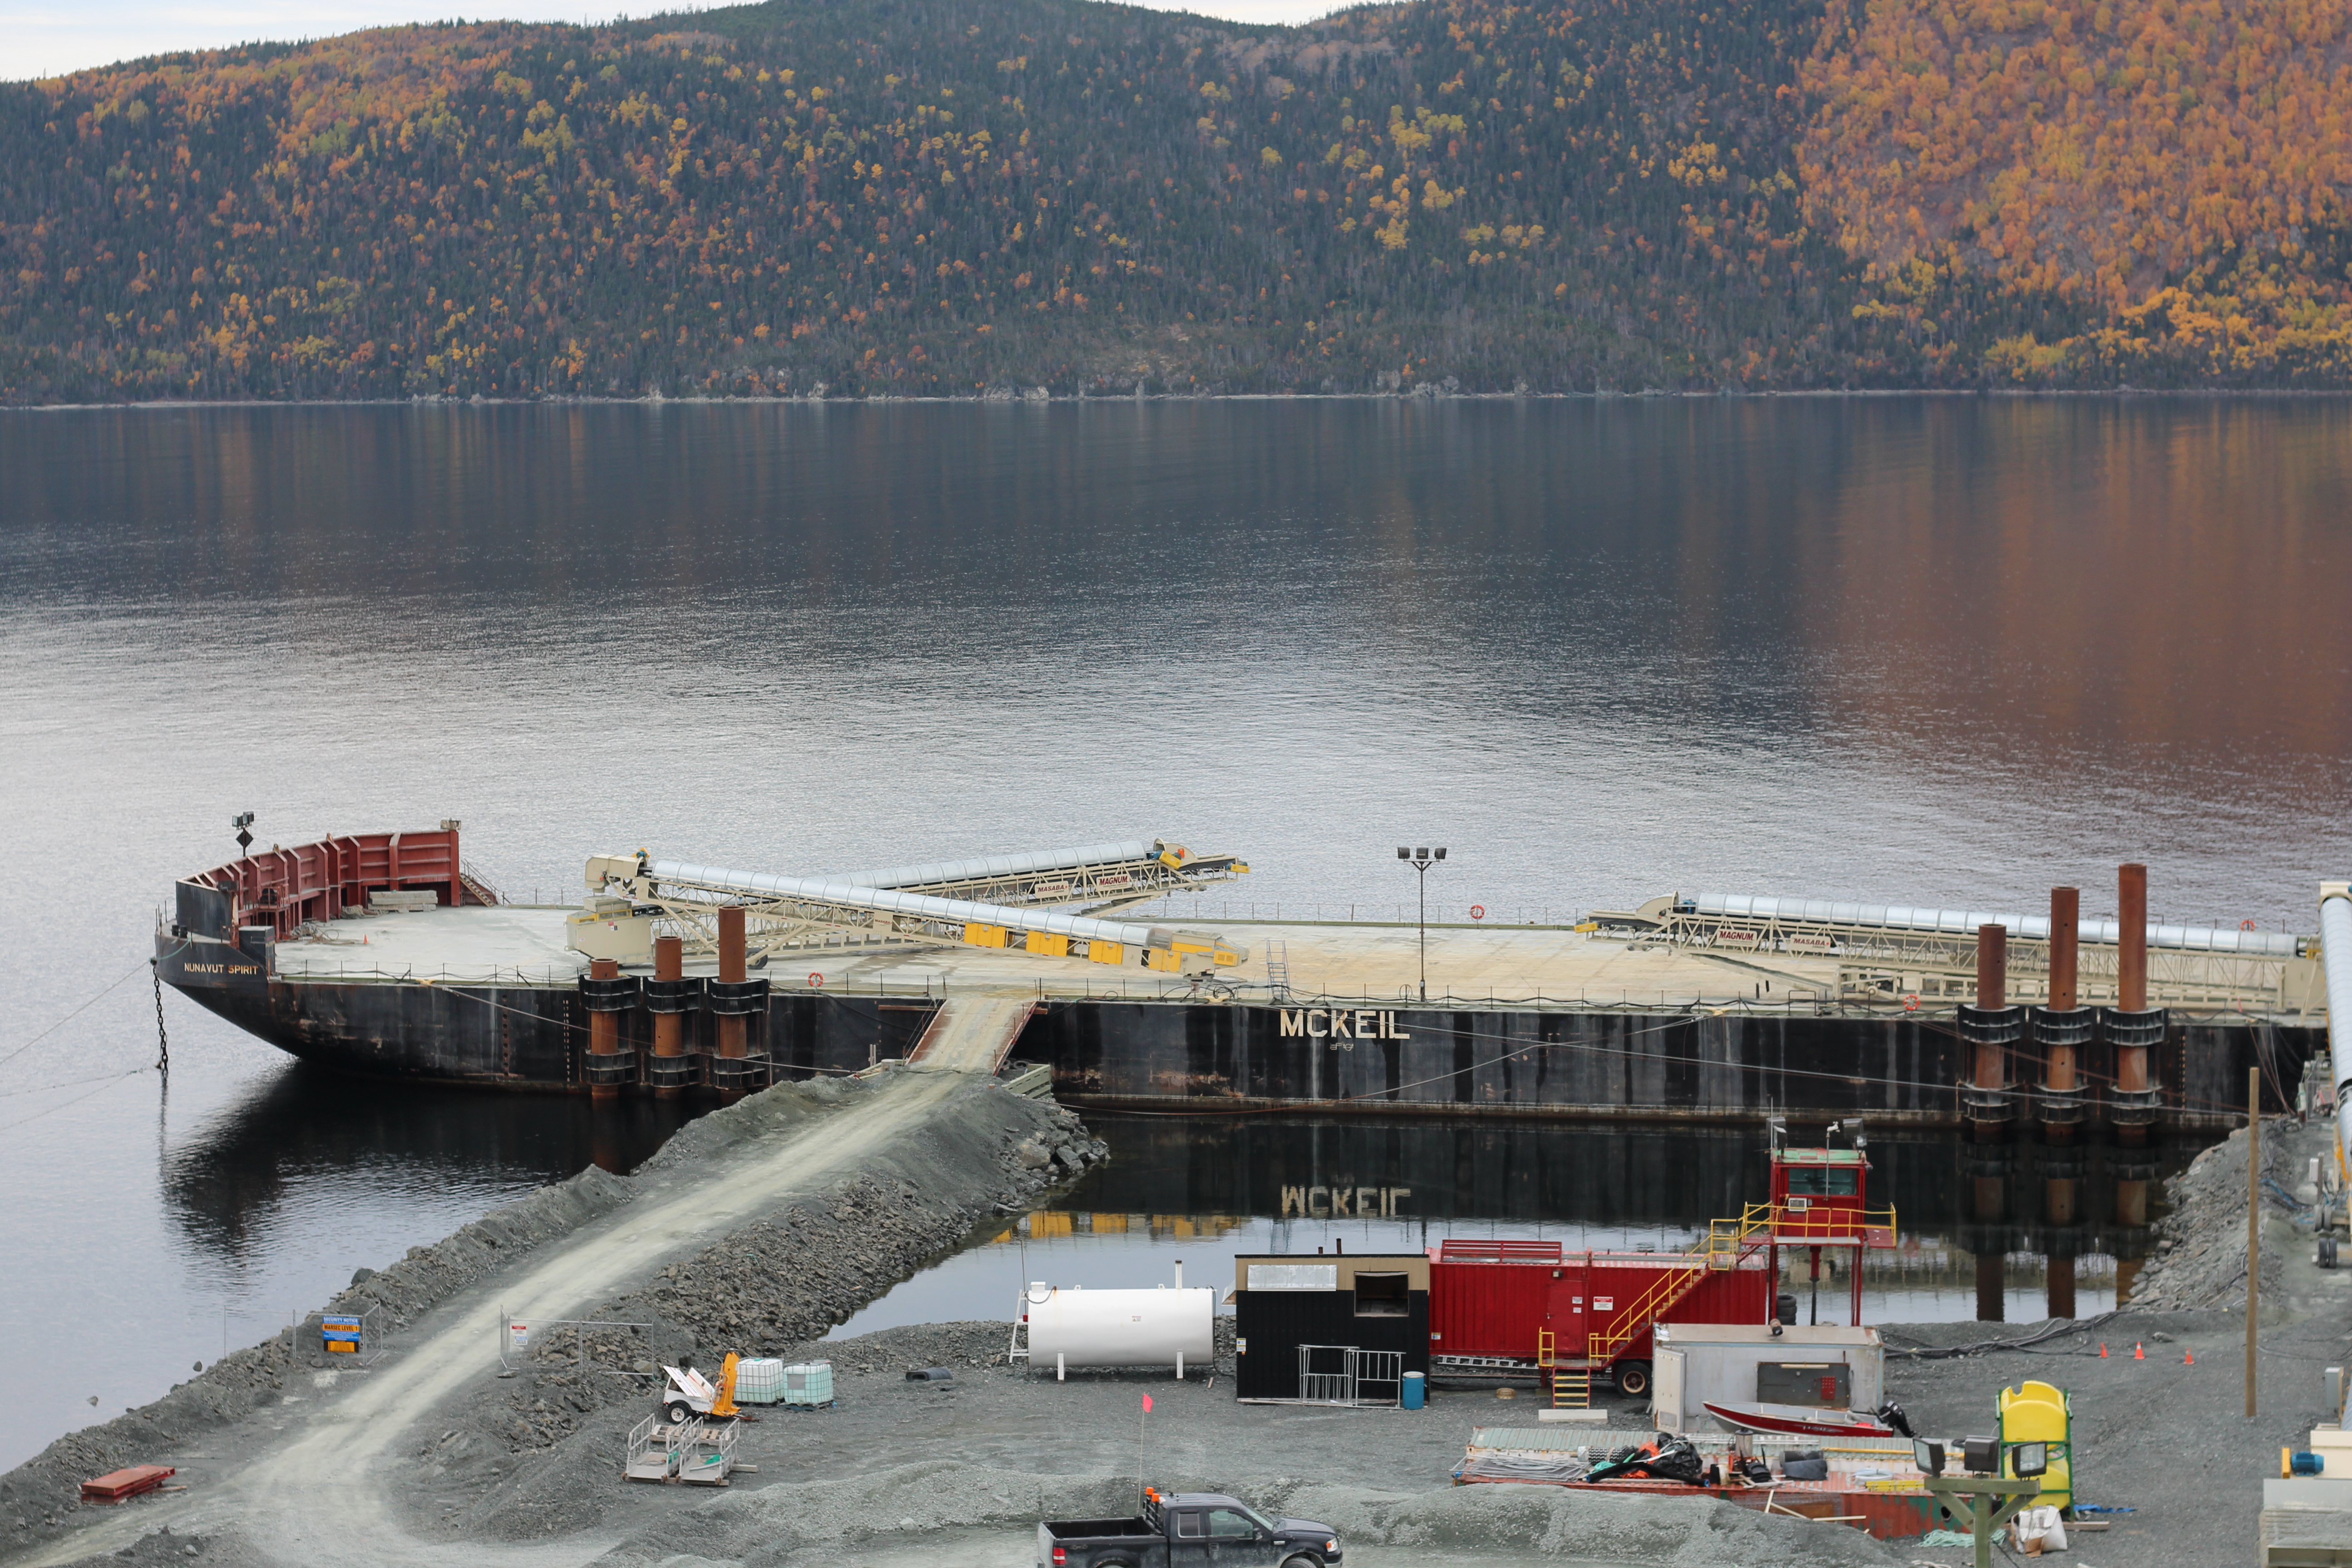
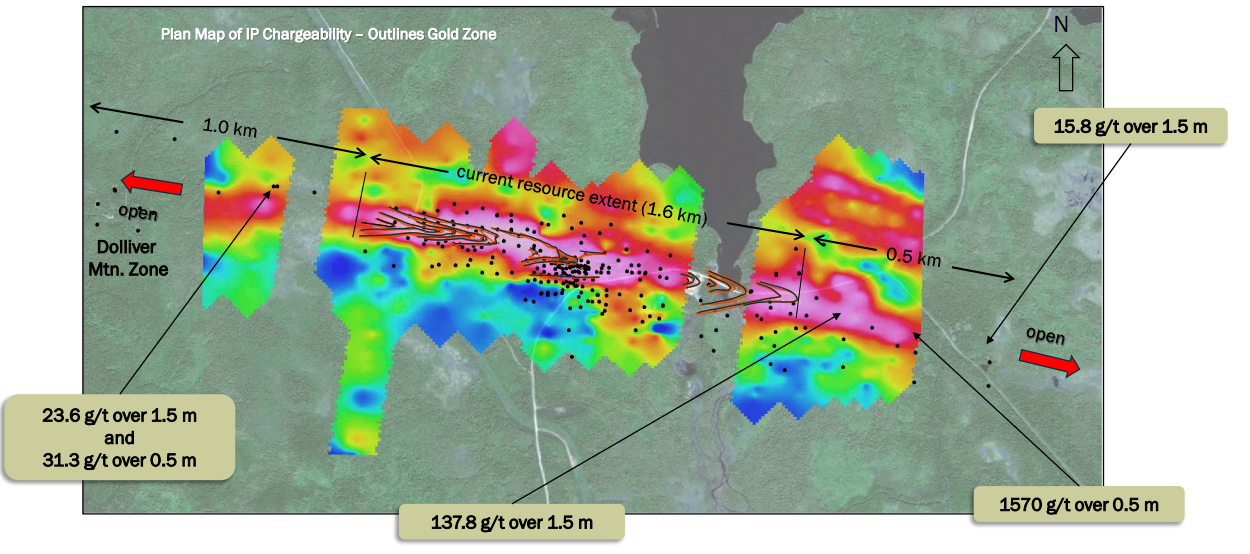
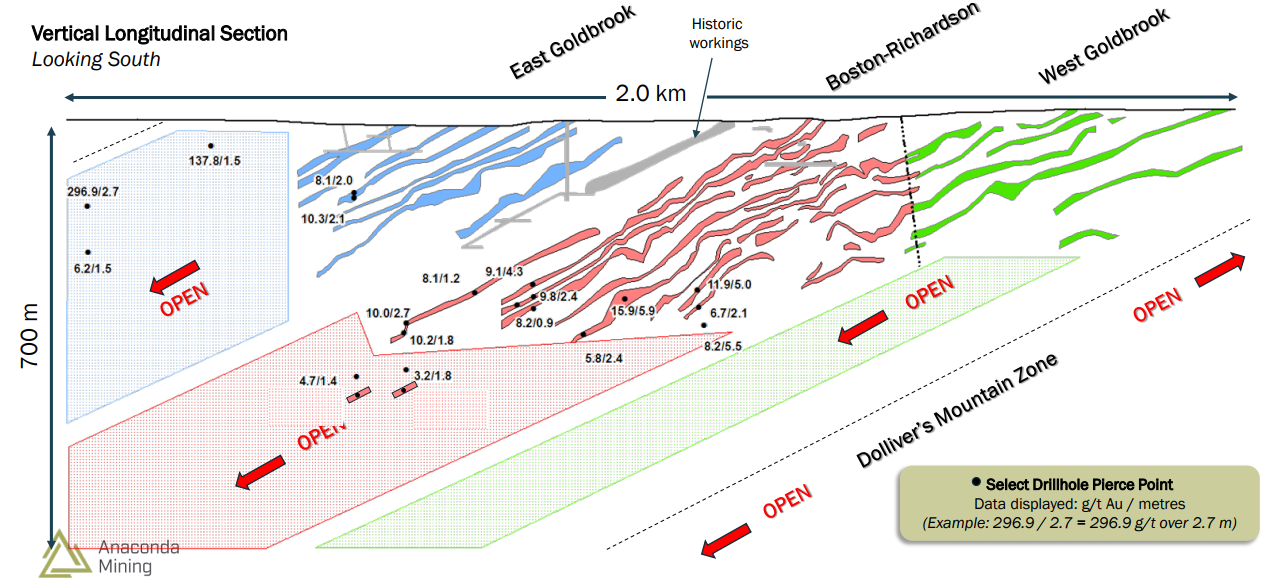
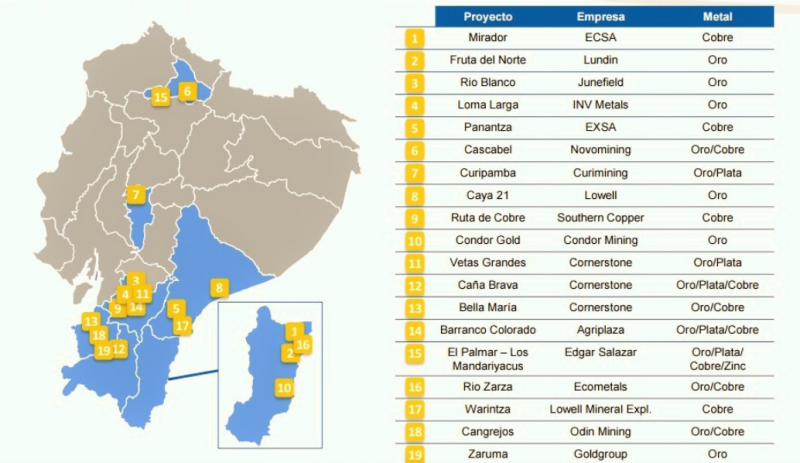
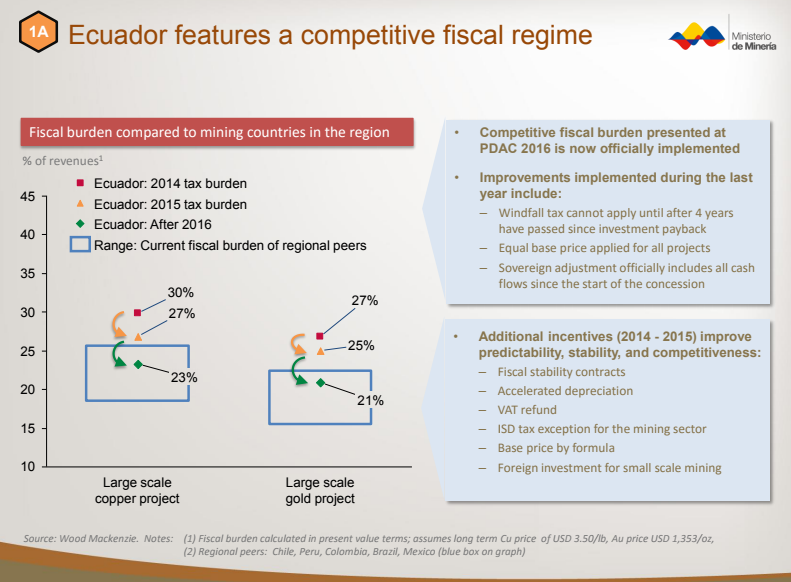

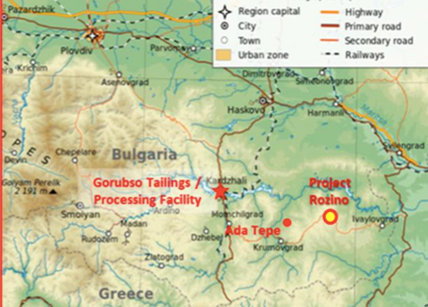
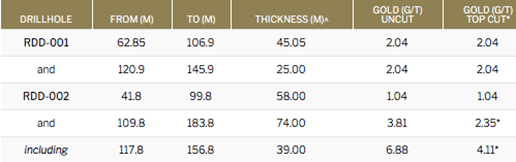
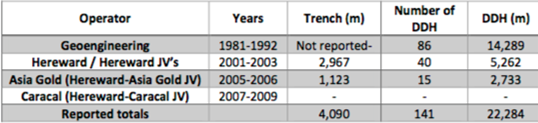
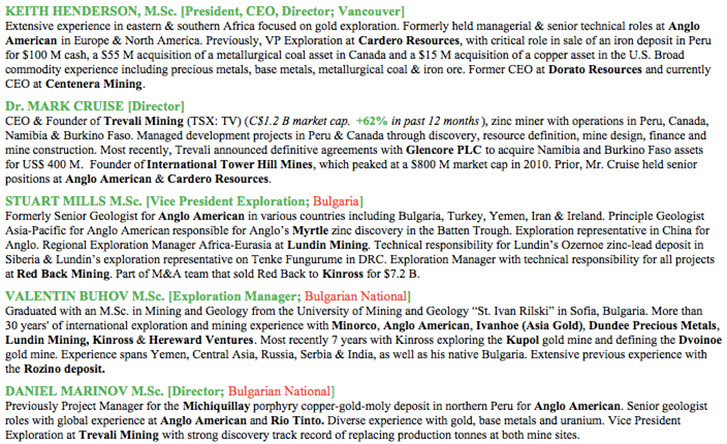
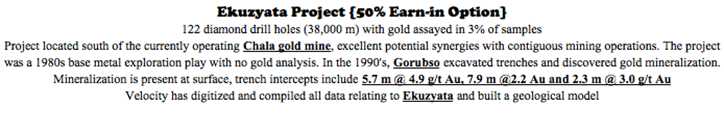
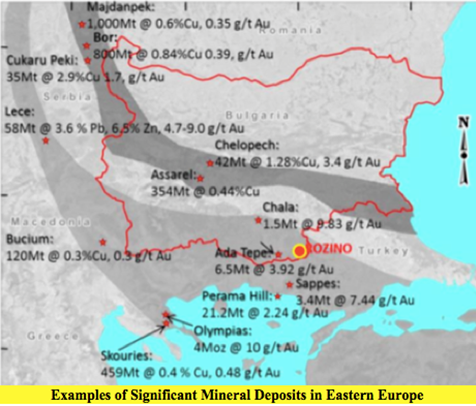


 Follow us on Twitter
 Become our facebook fan


