
The battered silver miners’ stocks surged in recent months, staging a strong rebound rally. That overdue turnaround was fueled by silver mean reverting higher on improving sentiment after gold’s decisive bull-market breakout. But silver miners still had a challenging Q2, as most of silver’s gains came after last quarter ended. They continued diversifying into gold to help weather silver’s endlessly-languishing low prices.
Four times a year publicly-traded companies release treasure troves of valuable information in the form of quarterly reports. Required by the U.S. Securities and Exchange Commission, these 10-Qs and 10-Ks contain the best fundamental data available to traders. They dispel all the sentiment distortions inevitably surrounding prevailing stock-price levels, revealing corporations’ underlying hard fundamental realities.
The definitive list of major silver-mining stocks to analyze comes from the world’s most-popular silver-stock investment vehicle, the SIL Global X Silver Miners ETF. Launched way back in April 2010, it has maintained a big first-mover advantage. SIL’s net assets ran $476m in mid-August near the end of Q2’s earnings season, 5.3x greater than its next-biggest competitor’s. SIL is the leading silver-stock benchmark.
In mid-August SIL included 23 component stocks, which are weighted somewhat proportionally to their market capitalizations. This list contains the world’s largest silver miners, including the biggest primary ones. Every quarter I dive into the latest operating and financial results from SIL’s top 17 companies. That’s simply an arbitrary number that fits neatly into the table below, but still a commanding sample.
As of mid-August these major silver miners accounted for fully 94.1% of SIL’s total weighting. In Q2’19 they collectively mined 73.7m ounces of silver. The latest comprehensive data available for global silver supply and demand came from the Silver Institute in April 2019. That covered 2018, when world silver mine production totaled 855.7m ounces. That equates to a run rate around 213.9m ounces per quarter.
Assuming that mining pace persisted in Q2’19, SIL’s top 17 silver miners were responsible for over 34% of world production. That’s fairly high considering just 26% of 2018’s global silver output was produced at primary silver mines! 38% came from lead/zinc mines, 23% from copper, and 12% from gold. Nearly 3/4ths of all silver produced worldwide is just a byproduct. Primary silver mines and miners are quite rare.
Scarce silver-heavy deposits are required to support primary silver mines, where over half their revenue comes from silver. They are increasingly difficult to discover and ever-more expensive to develop. And silver’s challenging economics of recent years argue against miners even pursuing it. So even traditional major silver miners have shifted their investment focus into actively diversifying into far-more-profitable gold.
Silver price levels are best measured relative to prevailing gold prices, which overwhelmingly drive silver price action. In early July the Silver/Gold Ratio continued collapsing to its worst levels witnessed in 26.8 years, since October 1992! Those secular extremes of the worst silver price levels in over a quarter century sure added to the misery racking this once-proud sector. That compounded miners’ challenges in Q2.
The largest silver miners dominating SIL’s ranks are scattered around the world. 11 of the top 17 mainly trade in U.S. stock markets, 3 in the United Kingdom, and 1 each in South Korea, Mexico, and Canada. SIL’s geopolitical diversity is good for investors, but makes it difficult to analyze and compare the biggest silver miners’ results. Financial-reporting requirements vary considerably from country to country.
In the U.K., companies report in half-year increments instead of quarterly. Some silver miners still publish quarterly updates, but their data is limited. In cases where half-year data is all that was made available, I split it in half for a Q2 approximation. Canada has quarterly reporting, but the deadlines are looser than in the States. Some Canadian miners really drag their feet, publishing their quarterlies close to legal limits.
The big silver companies in South Korea and Mexico present other problems. Their reporting is naturally done in their own languages, which I can’t decipher. Some release limited information in English, but even those translations can be difficult to interpret due to differing accounting standards and focuses. It is definitely challenging bringing all the quarterly data together for these diverse SIL-top-17 silver miners.
But analyzing them in the aggregate is essential to understand how they are faring. So each quarter I wade through all available operational and financial reports and dump the data into a big spreadsheet for analysis. Some highlights make it into this table. Blank fields mean a company hadn’t reported that data by mid-August, as Q2’s earnings season wound down. Some of SIL’s components report in gold-centric terms.
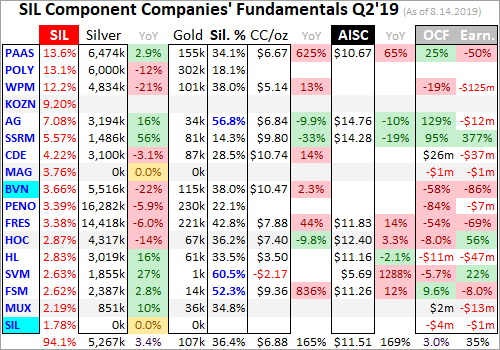
The first couple columns of this table show each SIL component’s symbol and weighting within this ETF as of mid-August. While most of these stocks trade on US exchanges, some symbols are listings from companies’ primary foreign stock exchanges. That’s followed by each miner’s Q2’19 silver production in ounces, along with its absolute year-over-year change. Next comes this same quarter’s gold production.
Nearly all the major silver miners in SIL also produce significant-to-large amounts of gold! That’s truly a double-edged sword. While gold really stabilizes and boosts silver miners’ cash flows, it also retards their stocks’ sensitivity to silver itself. So the next column reveals how pure these elite silver miners are, approximating their percentages of Q2’19 revenues actually derived from silver. This is calculated one of two ways.
The large majority of these SIL silver miners reported total Q2 revenues. Quarterly silver production multiplied by silver’s average price in Q2 can be divided by these sales to yield an accurate relative-purity gauge. When Q2 sales weren’t reported, I estimated them by adding silver sales to gold sales based on their production and average quarterly prices. But that’s less optimal, as it ignores any base-metals byproducts.
Next comes the major silver miners’ most-important fundamental data for investors, cash costs and all-in sustaining costs per ounce mined. The latter directly drives profitability which ultimately determines stock prices. These key costs are also followed by YoY changes. Last but not least the annual changes are shown in operating cash flows generated and hard GAAP earnings, with a couple exceptions necessary.
Percentage changes aren’t relevant or meaningful if data shifted from positive to negative or vice versa, or if derived from two negative numbers. So in those cases I included raw underlying data rather than weird or misleading percentage changes. Companies with symbols highlighted in light-blue have newly climbed into the elite ranks of SIL’s top 17 over this past year. This entire dataset together is quite valuable.
It offers a fantastic high-level read on how the major silver miners are faring fundamentally as an industry and individually. The super-low silver prices for most of Q2 really weighed on operating cash flows and earnings last quarter. But the major silver miners’ years-old and still-ongoing diversification into gold helped them weather the brutal low-silver-price storm. They still need silver to power far higher to thrive again.
The silver miners had the cards stacked against them last quarter, so their Q2 results weren’t going to look good. In addition to slumping towards early July’s incredible 26.8-year secular low relative to gold, silver languished for most of Q2. By late May it had fallen 5.0% quarter-to-date, far worse than gold’s own 1.0% QTD loss. While it did rally 6.6% into quarter-end from that nadir, that lagged gold’s 10.2% rebound.
Overall in Q2’19, silver merely eked out a pathetic 1.3% gain despite gold’s blistering 9.1% rally. And silver prices averaged a miserable $14.88 last quarter, plunging 9.9% year-over-year from Q2’18’s levels! Silver was about as deeply out of favor as it can get, which naturally killed any interest at all in the silver-mining stocks. At worst in late May, SIL had dropped 12.2% year-to-date on silver’s own 7.2% YTD loss.
So there weren’t going to be any silver-stock fireworks coming out of such a dismal quarter. Considering that nigh-apocalyptic silver backdrop, the major silver miners fared reasonably well in Q2. They kept on plugging away despite the choking pall of despair. The chronically-weak silver prices continued to justify the years-old shift into gold by traditional silver miners, which was again evident in the top SIL miners’ outputs.
That 73.7m ounces of silver these SIL-top-17 miners produced last quarter fell 1.8% YoY from Q2’18’s levels. Over the 13 quarters since Q2’16 when I started this deep-quarterly-results research thread, the SIL-top-17 peak was 78.6m ounces in Q4’17. Silver production is waning even among traditional major silver miners, its economics have been too constrained. They are increasingly shifting into gold instead.
The collective gold production from these elite silver majors ran 1.5m ounces in Q2’19, shooting up 13.4% YoY! They’ve been increasingly diversifying into gold in recent years as silver languished, since the yellow metal has had way-superior economics. The bombed-out silver prices have heavily impaired silver mines’ generation of operating cash flows and profits. So the silver miners have been forced to adapt.
Silver mining is as capital-intensive as gold mining, requiring similar large expenses to plan, permit, and construct new mines, mills, and expansions. It needs similar fleets of heavy excavators and haul trucks to dig and move the silver-bearing ore. Similar levels of employees are necessary to run silver mines. But at recent years’ average precious-metals prices, silver mines generate far lower returns than gold mines.
So even longtime traditional silver miners have reallocated much of their capital investments into growing gold outputs at silver’s expense. According to the Silver Institute’s latest World Silver Survey, 2018 was the third year in a row of waning global silver mine production. The mined-silver-supply shrinkage is even accelerating, running 0.0% in 2016, 1.8% in 2017, and 2.4% in 2018! Peak silver could really be upon us.
SIL’s top 3 component stocks commanding fully 38.9% of its total weighting sure exemplify the yellowing of the major silver miners. Pan American Silver currently crowns this leading silver-stock ETF, and has a proud heritage of mining its namesake metal. Last quarter its silver output only grew 2.9% YoY, yet its gold production skyrocketed 190.1% higher to 155k ounces! Thus its silver purity collapsed to merely 34.1%.
PAAS acquired troubled silver miner Tahoe Resources back in mid-November. Tahoe had owned what was once the world’s largest primary silver mine, Escobal in Guatemala. It had produced 5.7m ounces in Q1’17 before that country’s government unjustly shut it down after a frivolous lawsuit on a trivial bureaucratic misstep by the regulator. PAAS hopes to work through the red tape to win approval to restart Escobal.
But the real prize in that fire-sale buyout was Tahoe’s gold production from other mines. That deal closed in late February, so that new gold wasn’t fully reflected until PAAS’s latest Q2 results. Now this former silver giant is forecasting midpoint production of 575.0k ounces of gold and 25.8m ounces of silver in 2019. That is actually deep into mid-tier-gold territory and a far cry from 2018’s output of 178.9k and 24.8m!
SIL’s second-largest component in mid-August as this latest earnings season ended was the Russian-founded but UK-listed Polymetal. Its silver production fell 11.8% YoY in Q2, yet its gold output soared 30.2% to 302k ounces. That actually makes this company a major gold miner, exceeding 1m ounces annually! So not surprisingly only 18.1% of its Q2 revenues were derived from silver, among the lowest of SIL.
SIL’s third-largest component is Wheaton Precious Metals. It used to be a pure silver-streaming play known as Silver Wheaton. Silver streamers make big upfront payments to miners to pre-purchase some of their future silver production at far-below-market unit prices. This is beneficial to miners because they use the large initial capital infusions to help finance mine builds, which banks often charge usurious rates for.
Back in May 2017 Wheaton changed its name and symbol to reflect its increasing diversification into gold streaming. In Q2’19 WPM’s silver output collapsed 20.6% YoY, but its gold surged 17.9% higher! That pushed its silver-purity percentage in sales terms to just 38.0%, way below the 50%+ threshold defining primary silver miners. This gold-heavy ratio is forecast to persist, with WPM allocating more capital to gold.
Pan American will probably soon follow in Wheaton’s footsteps and change its name and symbol to reflect its new gold-dominated future. As miserable as silver has fared in recent years, I’m starting to wonder if the word “silver” in a miner’s name has become a liability with investors. The major primary silver miners are a dying breed, as it’s exceedingly difficult to generate sufficient cash flows and profits mining silver alone.
Major silver miners are becoming so scarce that SIL’s fourth-largest component is Korea Zinc. Actually a base-metals smelter, this company has nothing to do with silver mining. It ought to be kicked out of SIL posthaste, as its presence and big 1/11th weighting really retards this ETF’s performance. Korea Zinc smelted about 64.0m ounces of silver in 2018, which approximates roughly 17% of its full-year revenue.
Global X was really scraping the bottom of the barrel to include a company like Korea Zinc in SIL. I’m sure there’s not a single SIL investor who wants base-metals-smelting exposure in what is advertised as a “Silver Miners ETF”. The weighting and capital allocated to Korea Zinc should be reallocated and spread proportionally across the other SIL stocks. The ranks of major silver miners are becoming more rarefied.
In Q2’19 the SIL-top-17 silver miners averaged just 36.4% of their quarterly revenues from that metal! That was on the lower side of the recent years’ range. Only 3 of SIL’s top-17 component stocks were still primary silver miners last quarter, First Majestic Silver, Silvercorp Metals, and Fortuna Silver Mines. SIL is effectively another gold miners’ ETF, where its holdings derive nearly 2/3rds of their revenues from gold!
With SIL-top-17 silver production sliding 1.8% YoY in Q2’19, the per-ounce mining costs should’ve risen proportionally. Silver-mining costs are largely fixed quarter after quarter, with actual mining requiring the same levels of infrastructure, equipment, and employees. So the lower production, the fewer ounces to spread mining’s big fixed costs across. But the major silver miners’ Q2’19 costs surged disproportionally.
There are two major ways to measure silver-mining costs, classic cash costs per ounce and the superior all-in sustaining costs. Both are useful metrics. Cash costs are the acid test of silver-miner survivability in lower-silver-price environments, revealing the worst-case silver levels necessary to keep the mines running. All-in sustaining costs show where silver needs to trade to maintain current mining tempos indefinitely.
Cash costs naturally encompass all cash expenses necessary to produce each ounce of silver, including all direct production costs, mine-level administration, smelting, refining, transport, regulatory, royalty, and tax expenses. In Q2’19 these SIL-top-17 silver miners reported cash costs averaging $6.88 per ounce, which soared 73.9% YoY! While sounding catastrophic, that remains well under Q2’s average silver price.
That means the silver miners faced no existential threat last quarter despite its terrible silver prices. The reason cash costs soared is because Hecla Mining and Silvercorp Metals both reported negative cash costs in Q2’18 due to big byproduct credits. Excluding them, the comparable cash costs a year ago ran $6.49 which is much closer to last quarter’s levels. The silver miners are doing well holding the line on costs.
Way more important than cash costs are the far-superior all-in sustaining costs. They were introduced by the World Gold Council in June 2013 to give investors a much-better understanding of what it really costs to maintain silver mines as ongoing concerns. AISCs include all direct cash costs, but then add on everything else that is necessary to maintain and replenish operations at current silver-production levels.
These additional expenses include exploration for new silver to mine to replace depleting deposits, mine-development and construction expenses, remediation, and mine reclamation. They also include the corporate-level administration expenses necessary to oversee silver mines. All-in sustaining costs are the most-important silver-mining cost metric by far for investors, revealing silver miners’ true operating profitability.
The SIL-top-17 silver miners reporting AISCs in Q2’19 averaged $11.51 per ounce, which was only up 5.3% YoY. That was really impressive considering their waning silver production, and the challenges of producing this metal at such low prices. That was well under late May’s silver low of $14.34, as well as mid-November’s 2.8-year secular low of $13.99. The silver miners are nicely navigating silver’s vexing slump.
At Q2’19’s average silver price of $14.88 and average SIL-top-17 AISCs of $11.51, these miners were earning $3.37 per ounce. That’s not bad for a sector that investors mostly left for dead, convinced it must be doomed. Being so wildly undervalued relative to gold, silver has the potential to surge much higher in this resurgent gold bull. Historically the Silver/Gold Ratio has averaged around 55x, which has big implications.
At early July’s apocalyptic 26.8-year low relative to gold, the SGR plunged all the way to 93.5x! In other words, it took 93.5 ounces of silver to equal the value of a single ounce of gold. But silver was awoken from its zombified stupor soon after, thanks to gold’s decisive bull-market breakout to major new secular highs. So by mid-August as Q2’s earnings season wrapped up, silver had clawed back up to an 88.5x SGR.
By August 15 silver had regained $17.22 at best, which was merely an 18.4-month high. That was still a joke compared to gold though, which at $1524 had soared to its own 6.3-year secular high! In order to mean revert back up to historical norms compared to gold, silver has a long way to go. At $1524 gold, a 55x SGR implies a silver price of $27.71. That’s another 61% higher from silver’s still-weak mid-August levels.
Industry-wide all-in sustaining costs don’t change much regardless of prevailing silver prices. That is because they are largely determined during mine-planning stages, when engineers and geologists decide which ores to mine, how to dig to them, and how to process them to extract the silver. So higher silver prices yield explosive profits growth, which is what makes the volatile silver-mining stocks so alluring to traders.
A silver mean reversion to 1/55th the price of gold at its mid-August prices would catapult silver-mining profits 381% higher at Q2’s AISCs! Capital would deluge into this forsaken sector if these miners were earning $16.20 per ounce on $27.71 silver. And mean reversions out of extreme lows never stop at the historical averages, but their strong upside momentum carries them to proportional upside overshoots.
So the potential silver-miner earnings growth and thus stock-price gains when silver normalizes relative to gold are colossal. But lest that seem like a pie-in-the-sky pipe dream, consider just the first half of Q3’19 already in the books when Q2’s earnings season concluded. As of August 15th, silver had already risen to a $16.10 QTD average. That was 8.2% higher than Q2’s miserable $14.88, and very bullish for the miners.
Assuming Q3’s AISCs stay in line with Q2’s which is highly likely, silver-mining profits could be exploding 36.2% higher QoQ in this current quarter! That of course supports much higher silver-stock prices. All silver and its miners’ stocks need to thrive is for traders to be convinced gold is likely to keep climbing on balance. That necessary shift in overall precious-metals sentiment back to bullish is finally underway.
The caveat is the degree to which silver miners’ earnings amplify this metal’s upside is dependent on how much of their sales are still derived from silver as it reverts north. If the SIL top 17 are still getting 36% of their sales from silver, their stocks should surge with silver. But the more they diversify into gold, the more dependent they will be on gold-price moves. Those aren’t as big as silver’s since gold is a far-larger market.
Back to Q2’19 results, the SIL-top-17 silver miners’ hard accounting metrics mostly weakened. And that makes sense with average silver prices falling 9.9% YoY and these elite silver miners producing 1.8% less. They did manage to achieve a 2.4% gain in total revenues to $3.6b last quarter. That was solely thanks to their collective gold output growing 13.4% YoY. Without that gold, Q2 would’ve looked terrible.
Operating-cash-flow generation was weak, plunging 43.8% YoY to $555m across the SIL top 17. That makes it harder for these miners to invest in future production growth. Their total cash treasuries reported at the end of Q2 also fell 33.9% to $2.4b. Silver needs to rally considerably and stay higher for at least a few quarters before the silver miners can spin off strong cashflows again. Hopefully that’s now underway.
These major silver miners’ hard GAAP earnings in Q2’19 proved really weak, reflecting the miserable prevailing silver prices. Together they reported a collective net loss of $134m, compared to a $463m group profit in Q2’18. Out of the 13 of these SIL-top-17 miners that reported last quarter’s earnings, 8 were losses. Leading the way was the streaming giant Wheaton Precious Metals, which lost $125m alone.
WPM wrote down $166m on a streaming agreement it had overpaid for, a massive non-cash charge that helped torpedo the silver miners’ profits. But I didn’t see any other major writedowns, which was on the impressive side given last quarter’s super-low silver prices. Thankfully traders don’t buy silver stocks for how they’re faring today, but for how they are likely to do as silver mean reverts higher. It’s all about potential.
Silver’s last major upleg erupted in essentially the first half of 2016, when silver soared 50.2% higher on a parallel 29.9% gold upleg. SIL blasted 247.8% higher in just 6.9 months, a heck of a gain for major silver stocks. But the purer primary silver miners did far better. The purest major silver miner First Majestic’s stock was a moonshot, skyrocketing a staggering 633.9% higher in that same short span! SIL’s gains are muted.
The key takeaway here is avoid SIL. The world’s leading “Silver Miners ETF” is increasingly burdened with primary gold miners with waning silver exposure. And having over 1/11th of your capital allocated to silver miners squandered in Korea Zinc is sheer madness! If you want to leverage silver’s long-overdue mean reversion higher relative to gold, it’s far better to deploy in smaller purer primary silver miners alone.
To multiply your capital in the markets, you have to trade like a contrarian. That means buying low when few others are willing, so you can later sell high when few others can. In the first half of 2019 well before gold’s breakout, we recommended buying many fundamentally-superior gold and silver miners in our popular weekly and monthly newsletters. We’ve recently realized big gains including 109.7%, 105.8%, and 103.0%!
To profitably trade high-potential silver stocks, you need to stay informed about the broader market cycles that drive gold. Our newsletters are a great way, easy to read and affordable. They draw on my vast experience, knowledge, wisdom, and ongoing research to explain what’s going on in the markets, why, and how to trade them with specific stocks. Subscribe today and take advantage of our 20%-off summer-doldrums sale! The biggest gains are won by traders diligently staying abreast so they can ride entire uplegs.
The bottom line is the major silver miners had a challenging Q2. Silver languished the entire quarter, on its way to horrific quarter-century-plus lows relative to gold. Silver didn’t start perking up until mid-July, after gold’s decisive bull-market breakout had lasted long enough to convince traders gold’s upside was real and sustainable. So silver miners’ operating cash flows and earnings were way down last quarter.
That will really change in Q3 as long as silver doesn’t plummet into quarter-end. It’s incredible how fast silver miners’ fundamentals improve with higher silver prices. And silver’s upside potential is enormous, as it has a vast way to go to normalize relative to prevailing gold prices. The more that precious-metals sentiment improves, the more capital will flow into the tiny silver sector catapulting miners’ stocks far higher.
Adam Hamilton, CPA
September 3, 2019
Copyright 2000 – 2019 Zeal LLC (www.ZealLLC.com)
Fed week is exciting for some. Gold bulls and bugs alike hope the Fed will do something or say something that will trigger a huge move in precious metals. It doesn’t work like that. The Fed follows the market, which for the Fed Funds rate (FFR) is the 2-year yield. The 2-year yield has been screaming higher over the past 12 months and it implies at least another two rate hikes in the future. That’s not good for precious metals and could be partly why (among other reasons) Gold and gold stocks have lost their 200-day moving averages. Whatever the reason, the short-term technicals are negative and there is risk of increased selling before a potential rebound in July.
First, let’s take a look at Gold and gold against the equity market. As we can see from the chart, Gold in June has failed twice at its 200-day moving average. That is different from 2017 when each time Gold lost its 200-day moving average, it made a V rebound back above it.
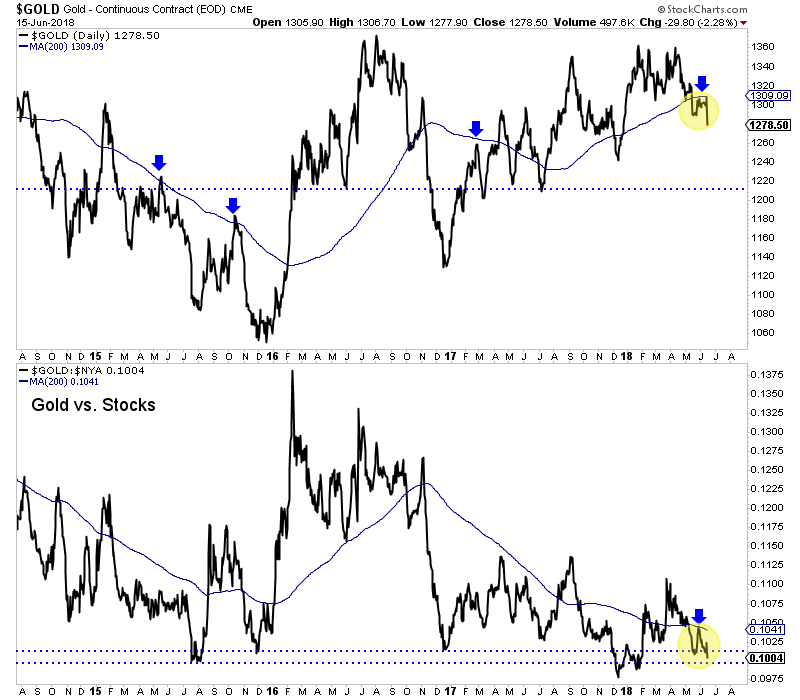
Gold’s weakness against the broad equity market is another concern. At the bottom of the chart we plot Gold against the NYSE, a broad stock market index. The ratio recently failed at its downtrending 200-day moving average and is also threatening a move to new lows for essentially the first time since 2015. (The December 2017 break was not sustained to the downside).
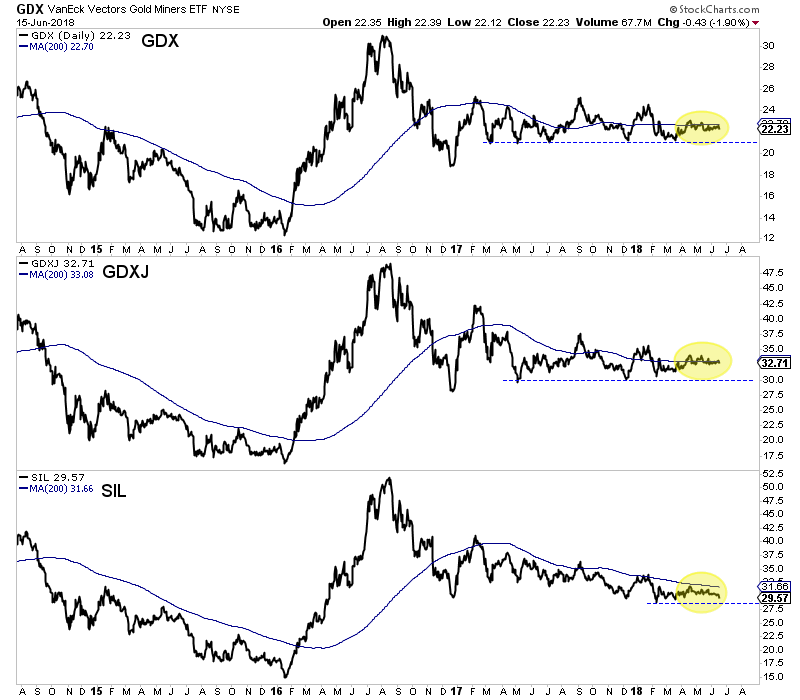
Elsewhere, the miners have spent the second quarter wrestling with their 200-day moving averages. GDX failed at its 200-dma twice in the past month, including last week. Meanwhile, GDXJ has shown a tiny bit more strength but essentially has wrestled with its 200-dma since April. The silver stocks (SIL) have been weaker as they have not traded above their 200-dma since January and could have started to breakdown on Friday by closing at 3-month low.
The immediate outlook for precious metals is negative as the price action suggests but current bearish sentiment implies a rebound is on the horizon. The summer could be playing out as we anticipated three weeks ago. An immediate move lower could push Gold to strong support around $1260 and that would put sentiment indicators into truly extreme territory. From there, it is critical that the sector recaptures 200-day moving averages. Given our recent cautious views, we have narrowed our focus to a smaller group of companies capable of performing well in this environment. To follow our guidance and learn our favorite juniors for the next 6 to 12 months, consider learning about our premium service.
The major silver miners’ stocks remain deeply out of favor, languishing near multi-year lows. Of course that reflects investors’ lack of interest in silver itself. It has greatly lagged, not following gold higher like usual over the past year and a half. That’s really torpedoed silver-stock sentiment, making for a challenging environment for silver miners. But they’re weathering it as their recently-released Q1’18 results show.
Four times a year publicly-traded companies release treasure troves of valuable information in the form of quarterly reports. Companies trading in the States are required to file 10-Qs with the US Securities and Exchange Commission by 45 calendar days after quarter-ends. Canadian companies have similar requirements. In other countries with half-year reporting, many companies still partially report quarterly.
Unfortunately the universe of major silver miners to analyze and invest in is pretty small. Silver mining is a tough business both geologically and economically. Primary silver deposits, those with enough silver to generate over half their revenues when mined, are quite rare. Most of the world’s silver ore formed alongside base metals or gold. Their value usually well outweighs silver’s, relegating it to byproduct status.
The Silver Institute has long been the authority on world silver supply-and-demand trends. It published its latest annual World Silver Survey covering 2017 in mid-April. Last year only 28% of the silver mined around the globe came from primary silver mines! 36% came from primary lead/zinc mines, 23% copper, and 12% gold. That’s nothing new, the silver miners have long supplied less than a third of world mined supply.
It’s very challenging to find and develop the scarce silver-heavy deposits supporting primary silver mines. And it’s even harder forging them into primary-silver-mining businesses. Since silver isn’t very valuable, most silver miners need multiple mines in order to generate sufficient cash flows. Traditional major silver miners are increasingly diversifying into gold production at silver’s expense, chasing its superior economics.
So there aren’t many major silver miners left out there, and their purity is shrinking. The definitive list of these companies to analyze comes from the most-popular silver-stock investment vehicle, the SIL Global X Silver Miners ETF. In mid-May at the end of Q1’s earnings season, SIL’s net assets were running 6.4x greater than its next-largest competitor’s. So SIL continues to dominate this small niche contrarian sector.
While SIL has its flaws, it’s the closest thing we have to a silver-stock index. As ETF investing continues to eclipse individual-stock picking, SIL inclusion is very important for silver miners. It grants them better access to the vast pools of stock-market capital. Differential SIL-share buying by investors requires this ETF’s managers to buy more shares in its underlying component companies, bidding their stock prices higher.
In mid-May as the major silver miners were finishing reporting their Q1’18 results, SIL included 24 “Silver Miners”. Unfortunately the great majority aren’t primary silver miners, most generate well under half their revenues from silver. That’s not necessarily an indictment against SIL’s stock picking, but a reflection of the state of this industry. There aren’t enough significant primary silver miners left to fully flesh out an ETF.
This disappointing reality makes SIL somewhat problematic. The only reason investors would buy SIL is they want silver-stock exposure. But if SIL’s underlying component companies generate well under 40% of their sales from silver mining, they aren’t going to be very responsive to silver price moves. And most of that capital intended to go into primary silver miners is instead diverted into byproduct silver miners.
So the silver-mining ETFs sucking in capital investors thought they were allocating to real primary silver miners effectively starves them. Their stock prices aren’t bid high enough to attract in more investors, so they can’t issue sufficient new shares to finance big silver-mining expansions. This is exacerbating the silver-as-a-byproduct trend. Only sustained much-higher silver prices for years to come could reverse this tragedy.
Every quarter I dig into the latest results from the major silver miners of SIL to get a better understanding of how they and this industry are faring fundamentally. I feed a bunch of data into a big spreadsheet, some of which made it into the table below. It includes key data for the top 17 SIL component companies, an arbitrary number that fits in this table. That’s a commanding sample at 95.1% of SIL’s total weighting!
While most of these top 17 SIL components had reported on Q1’18 by mid-May, not all had. Some of these major silver miners trade in the UK or Mexico, where financial results are only required in half-year increments. If a field is left blank in this table, it means that data wasn’t available by the end of Q1’s earnings season. Some of SIL’s components also report in gold-centric terms, excluding silver-specific data.
The first couple columns of this table show each SIL component’s symbol and weighting within this ETF as of mid-May. While most of these stocks trade on US exchanges, some symbols are listings from companies’ primary foreign stock exchanges. That’s followed by each miner’s Q1’18 silver production in ounces, along with its absolute year-over-year change. Next comes this same quarter’s gold production.
Nearly all the major silver miners in SIL also produce significant-to-large amounts of gold! That’s truly a double-edged sword. While gold really stabilizes and boosts silver miners’ cash flows, it also retards their stocks’ sensitivity to silver itself. So the next column reveals how pure these elite silver miners are, approximating their percentages of Q1’18 revenues actually derived from silver. This is calculated two ways.
The large majority of these top SIL silver miners reported total Q1 sales. Those are divided by quarterly silver production multiplied by silver’s average price in Q1, yielding an accurate relative-purity gauge. In cases where Q1 sales weren’t reported, I estimated them by adding silver sales to gold sales based on their production and average quarterly prices. That’s less optimal, since it ignores any base-metals production.
Next comes the major silver miners’ most-important fundamental data for investors, cash costs and all-in sustaining costs per ounce mined. The latter directly drives profitability which ultimately determines stock prices. These key costs are also followed by YoY changes. Last but not least the annual changes are shown in operating cash flows generated and hard GAAP earnings, with a couple exceptions necessary.
Percentage changes aren’t relevant or meaningful if data shifted from positive to negative or vice versa, or if derived from two negative numbers. So in those cases I included raw underlying data rather than weird or misleading percentage changes. This whole dataset together offers a fantastic high-level read on how the major silver miners are faring fundamentally as an industry. They kept hanging in there in Q1’18.
Silver has always been driven by gold, effectively acting like a gold sentiment gauge. Generally big silver uplegs only happen after gold has rallied long enough and high enough to convince traders its gains are sustainable. Then the way-smaller silver market tends to start leveraging and amplifying gold’s moves by 2x to 3x. But strangely gold’s strength over the past year didn’t spill into silver, leaving its miners struggling.
Silver’s average price actually fell 4.1% between Q1’17 and Q1’18, despite a sizable 8.9% YoY rally in gold’s average price! Normally silver would’ve powered 18% to 27% higher on such a meaningful gold advance. But it went the other way because gold sentiment remained poor. Investors spent 2017 deeply enamored with the extraordinary levitating general stock markets, ignoring everything else including gold and silver.
With investors not interested, the already-battered silver stocks continued to languish near lows for most of 2017. These miners had insufficient capital and incentives to grow production, which is the lifeblood of mining. So unfortunately these top 17 SIL components collectively suffered sharp declines in both silver and gold production over the past year. That naturally hurt their operating and financial results in Q1’18.
These elite major silver miners’ total silver mined last quarter fell 5.3% YoY to 72.0m ounces! That was certainly not offset by higher gold production, which dropped an even-worse 8.1% YoY to 1243k ounces. And sadly those production declines are actually skewed smaller than sector reality. Note above the only big absolute gains in silver production came from two silver behemoths, Fresnillo and Industrias Peñoles.
Their silver production soared 14.0% and 13.1% YoY in Q1, bucking the weakening trend seen in many of the rest of these major miners. Together Fresnillo and Peñoles added 3.9m ounces of silver mined to the SIL-top-17 total. Without that huge boost, the overall silver production for these elite miners would’ve fallen a huge 10.4% YoY. And I suspect these Mexican giants’ silver production may be double-counted.
Fresnillo and Industrias Peñoles have an incestuous relationship, as the former used to be wholly owned by the latter. Industrias Peñoles spun off Fresnillo back in May 2008 on the London Stock Exchange. While Fresnillo’s financial reporting is decent, Industrias Peñoles’ is murky. Neither my decades studying financial statements as a Certified Public Accountant nor my rudimentary Spanish can penetrate very deep.
So I haven’t been able to track down how much of Fresnillo that Industrias Peñoles still owns, nor whether the silver production reported by these silver-mining monsters is actually fully mutually exclusive. I’m assuming it is for this analysis, but I’m skeptical. Both companies reported their huge YoY growth in silver production was the result of Fresnillo’s new San Julián silver mine ramping up, which is a big one.
San Julián produced 3568k ounces of silver in Q1’18 alone, along with fairly-large gold, zinc, and lead byproducts. It’s anticipated to produce 11.6m and 63.7k ounces of silver and gold annually for 12 years. Without San Julián, which could be double-reported between Fresnillo and Industrias Peñoles, the top SIL silver miners’ production would look very different. These elite silver miners have had a challenging year.
Fully excluding Fresnillo and Peñoles, the rest of these top SIL components saw their collective silver production plunge 16.8% YoY to 39.2m ounces! The mediocre silver-mining economics from these weak silver prices combined with company-specific problems have really hit this industry. Leading the drop in silver production were a couple of long-time American favorites, Tahoe Resources and SSR Mining.
Tahoe was originally spun off by Goldcorp to develop the incredible high-grade Escobal silver mine in Guatemala. Everything went well for its first few years, with this mine providing 1000+ great high-paying jobs to locals and contributing big taxes to the national economy. Then a group of anti-mining activists filed a frivolous and baseless lawsuit with the intent of shutting down Escobal. The whole thing was a farce.
Tahoe wasn’t even the target, Guatemala’s Ministry of Energy and Mines was. This regulator allegedly did not sufficiently consult with the Xinca indigenous people before granting Escobal’s permits! Only in a third-world country plagued with rampant government corruption would that be Tahoe’s problem instead of bureaucrats’. They apparently didn’t hold enough meetings, so Escobal’s mining license was actually suspended.
Tahoe was forced to temporarily mothball its crown-jewel silver mine, and eventually fire many of its local Guatemalan employees. The dishonorable Guatemalan government continues to drag its feet on this case, inexplicably strangling one of its largest taxpayers. It has even allowed violent anti-mine militants to illegally blockade the road to Escobal, often physically attacking trucks and drivers supplying this mine!
Thus Tahoe’s silver production plummeted 100% YoY from 5700k ounces to zero! That’s certainly not an existential threat, as Tahoe still has other sizable gold-mining operations. In early May’s Q1’18 report, Tahoe’s management is still optimistic a court ruling in its favor is soon coming. Then its licenses will be reinstated and it can slowly resume mining at Escobal. Hopefully this whole mess isn’t a stealth expropriation.
SSR Mining’s silver production fell a less-extreme-but-still-huge 38.3% YoY to 938k ounces in Q1’18. This has nothing to do with geopolitics like Tahoe’s nightmare, but is simply the forecast depletion of its old Pirquitas silver mine. SSR Mining, which used to be called Silver Standard Resources, is exploring in the area trying to extend the life of this mine. But most of its financial resources are being poured into its gold mines.
That gold focus among these top silver miners is common across SIL’s components. As the silver-percentage column above shows, most of these elite silver miners are actually primary gold miners by revenue! Only 3 of these 17 earned more than half of their Q1’18 sales from mining silver, and they are highlighted in blue. WPM, HL, PAAS, CDE, and TAHO are also top-34 components in the leading GDX gold miners’ ETF!
While they only comprised 8.7% of GDX’s total weighting in mid-May, this highlights how difficult it is to find primary silver miners. SIL’s managers have an impossible job these days with the major silver miners increasingly shifting to gold. They are really scraping the bottom of the barrel to find more silver miners. In Q3’17 they added Korea Zinc, and it’s now SIL’s 3rd-biggest holding with a hefty 11.9% total weighting.
That was intriguing, as I’d never heard of this company after decades of intensely studying and actively trading silver stocks. So I looked into Korea Zinc and found it was merely a smelter, not even a miner! The latest financial data I could find in English was 2015’s. That year Korea Zinc “produced” 63.3m ounces of silver, which was largely a byproduct from its main business of smelting zinc, lead, copper, and gold.
I ran the numbers for the heck of it, and silver was implied as 32% of Korea Zinc’s 2015 revenues. The fact SIL’s managers included a company like this that doesn’t even mine silver as a top SIL component shows how rare major silver miners have become. The economics of silver mining at today’s prices are inferior to gold mining. Thus the average silver-purity percentage of revenues of these SIL miners is only 36.8%.
That’s right in line with the past year’s trend, with 2017 seeing 38.5%, 37.6%, 40.1%, and 35.8% from Q1 to Q4. This reflects gold mining’s economics being superior to silver mining’s these days. Silver mining is as capital-intensive as gold mining, requiring similar large expenses for planning, permitting, and constructing mines and mills. It needs similar heavy excavators and haul trucks to dig and move the silver-bearing ore.
But silver generates much lower cash flows due to its lower price. Consider hypothetical mid-sized silver and gold miners, which might produce 10m and 300k ounces annually. At last quarter’s average metals prices, these silver and gold mines would yield $167m and $399m of yearly sales. It’s far easier to pay the bills mining gold than silver, which is unfortunate. But until silver surges again, that’s the way things are.
While I understand this, as a long-time silver-stock investor it saddens me primary silver miners have apparently become a dying breed. When silver starts powering higher in one of its gigantic uplegs and way outperforms gold again, this industry’s silver-purity percentage will rise. But unless silver not only shoots far ahead but stays there while gold lags, it’s hard to see major-silver-mining purity significantly reversing.
Unfortunately SIL’s mid-May composition was such that there wasn’t a lot of Q1 cost data reported by its top component miners. A half-dozen of these top SIL companies trade in the UK, South Korea, Mexico, and Peru, where reporting only comes in half-year increments. There are also primary gold miners that don’t report silver costs, and a silver explorer with no production. So silver cost data remains scarce.
Nevertheless it’s always useful to look at what we have. Industrywide silver-mining costs are one of the most-critical fundamental data points for silver-stock investors. As long as the miners can produce silver for well under prevailing silver prices, they remain fundamentally sound. Cost knowledge helps traders weather this sector’s occasional fear-driven plunges without succumbing to selling low like the rest of the herd.
There are two major ways to measure silver-mining costs, classic cash costs per ounce and the superior all-in sustaining costs. Both are useful metrics. Cash costs are the acid test of silver-miner survivability in lower-silver-price environments, revealing the worst-case silver levels necessary to keep the mines running. All-in sustaining costs show where silver needs to trade to maintain current mining tempos indefinitely.
Cash costs naturally encompass all cash expenses necessary to produce each ounce of silver, including all direct production costs, mine-level administration, smelting, refining, transport, regulatory, royalty, and tax expenses. In Q1’18, these top 17 SIL-component silver miners that reported cash costs averaged $5.05 per ounce. That plunged a whopping 25.2% YoY, making it look like silver miners are far more efficient.
But that’s misleading. Because of hefty byproduct credits from gold and base metals, Hecla Mining and Fortuna Silver Mines both reported negative cash costs in Q1. They are an accounting fiction, as mining silver still costs a lot of money. But crediting byproduct sales to silver can slash reported cash costs. In the comparable quarter a year earlier, there were no negative cash costs at any of SIL’s top 17 miners.
Those super-low cash costs offset SSR Mining’s crazy-high $17.07 per ounce. That’s not normal either, the result of that winding down of its lone silver mine. Excluding these extreme outliers, the remaining handful of silver miners had average cash costs of $5.50 per ounce. As long as silver prices stay above those levels, the silver miners can keep the lights on at their mines. Sub-$6 silver is wildly inconceivable.
Way more important than cash costs are the far-superior all-in sustaining costs. They were introduced by the World Gold Council in June 2013 to give investors a much-better understanding of what it really costs to maintain a silver mine as an ongoing concern. AISCs include all direct cash costs, but then add on everything else that is necessary to maintain and replenish operations at current silver-production levels.
These additional expenses include exploration for new silver to mine to replace depleting deposits, mine-development and construction expenses, remediation, and mine reclamation. They also include the corporate-level administration expenses necessary to oversee silver mines. All-in sustaining costs are the most-important silver-mining cost metric by far for investors, revealing silver miners’ true operating profitability.
In Q1’18 these top 17 SIL miners reporting AISCs averaged just $10.92 per ounce. That’s down 5.1% YoY, and still way below last quarter’s low average silver price of $16.72. Excluding SSRM’s $18.37 which is again a non-representative mine-depletion outlier, that slides to $9.42. Despite all the tough challenges the major silver miners are facing, they are still able to produce silver quite profitably today.
All-in sustaining costs and production are inversely related. Lower silver production, which many of SIL’s top components suffered last quarter, leaves fewer ounces to spread the big fixed costs of mining across. Yet average AISCs still retreated, showing these top silver miners are getting more efficient at producing their metal. That will grant the silver miners more upside profits leverage to rising silver as this metal recovers.
With last quarter’s $16.72 average silver price, $10.92 AISCs show the silver miners still earning pretty-fat profits of $5.81 per ounce. That’s actually only down 2.2% YoY because Q1’17’s higher silver prices were paired with higher AISCs. Since mining costs are largely fixed during planning and construction, these silver-mining profits will explode as silver mean reverts higher. And silver has vast room to run from here.
Today’s silver price remains crazy-low relative to prevailing gold levels, portending huge mean-reversion upside. The long-term average Silver/Gold Ratio runs around 56, which means it takes 56 ounces of silver to equal the value of one ounce of gold. Silver is greatly underperforming gold so far in 2018, with the SGR averaging a stock-panic-like 79.6 YTD as of late May! So silver is overdue to catch up with gold.
At a 56 SGR and $1300 gold, silver is easily heading near $23.25. That’s 39% above its Q1 average. Assuming the major silver miners’ all-in sustaining costs hold, that implies profits per ounce soaring 112% higher! Plug in a higher gold price or the usual mean-reversion overshoot after an SGR extreme, and the silver-mining profits upside is far greater. Silver miners’ inherent profits leverage to rising silver is incredible.
While all-in sustaining costs are the single-most-important fundamental measure that investors need to keep an eye on, other metrics offer peripheral reads on the major silver miners’ fundamental health. The more important ones include cash flows generated from operations, GAAP accounting profits, revenues, and cash on hand. They all deteriorated in Q1’18, as you’d expect with lower silver production and prices.
Before we get into them, these comparisons are a bit misleading. In Q1’18 12 of these SIL-top-17 silver miners reported quarterly financial results, compared to 14 a year earlier. So it’s not quite an apples-to-apples comparison. One reason is Silvercorp Metals, which clawed its way back into SIL’s top 17 over the past year. SVM tends to meander in and out of that 17th spot depending on its market cap relative to its peers.
SVM has a fiscal year ending March 31st, so its full-year results that require more time to prepare and get audited come later than normal quarterly results. I did all the underlying data collection and analysis for this essay, and wrote the draft, before they were reported in late May. Korea Zinc also doesn’t report in English as far as I can tell. Both of these light-blue-highlighted stocks weren’t in SIL’s top 17 a year ago.
Among these top SIL components reporting Q1’18 financial results, operating cash flows plunged 33.6% YoY to $528m. That’s still a strong number for such a small industry, proving that silver mines are still heavily cash-flow positive in general. Since cash on balance sheets actually slid 4.6% YoY to $2973m, the silver miners were apparently spending that cash flow on expansions that have yet to bear production fruit.
Overall sales among these elite silver miners dropped 13.0% YoY to $2699m. That makes sense given their 5.3% lower silver production and 4.1% lower average silver prices in Q1. Of course profits amplify falling sales, so the top 17 SIL silver stocks saw earnings plunge 24.1% YoY to $273m. But these silver miners were still enjoying profitable operations even with silver mired near lows in such miserable bearishness.
As silver powers higher in coming quarters, silver-mining profits will really leverage its advance. And that will fundamentally support far-higher silver-stock prices. The investors who will make out like bandits on this are the early contrarians willing to buy in low, before everyone else realizes what is coming. By the time silver surges higher with gold so silver stocks regain favor again, the big gains will have already been won.
While investors and speculators alike can certainly play the silver miners’ long-stalled mean-reversion bull with this leading SIL ETF, individual silver stocks with superior fundamentals will enjoy the best gains by far. Their upside will trounce the ETFs, which are burdened by companies that don’t generate enough of their sales from silver. A handpicked portfolio of purer elite silver miners will yield much-greater wealth creation.
At Zeal we’ve literally spent tens of thousands of hours researching individual silver stocks and markets, so we can better decide what to trade and when. As of the end of Q4, this has resulted in 983 stock trades recommended in real-time to our newsletter subscribers since 2001. Fighting the crowd to buy low and sell high is very profitable, as all these trades averaged stellar annualized realized gains of +20.2%!
The key to this success is staying informed and being contrarian. That means buying low before others figure it out, before undervalued silver stocks soar much higher. An easy way to keep abreast is through our acclaimed weekly and monthly newsletters. They draw on my vast experience, knowledge, wisdom, and ongoing research to explain what’s going on in the markets, why, and how to trade them with specific stocks. For only $12 per issue, you can learn to think, trade, and thrive like contrarians. Subscribe today, and get deployed in the great gold and silver stocks in our full trading books!
The bottom line is the major silver miners fared fine in Q1 despite some real challenges. A combination of silver continuing to seriously lag gold, along with anomalous company-specific problems, weighed on miners’ collective results. Yet they continued to produce silver at all-in sustaining costs way below Q1’s low prevailing silver prices. And their ongoing diversification into gold leaves them financially stronger.
With silver-stock sentiment remaining excessively bearish, this sector is primed to soar as silver itself resumes mean reverting higher to catch up with gold’s young bull market. The silver miners’ profits leverage to rising silver prices remains outstanding. After fleeing silver stocks so relentlessly over the past 21 months, investors will have to do big buying to reestablish silver-mining positions. That will fuel major upside.
Adam Hamilton, CPA
June 1, 2018
Copyright 2000 – 2018 Zeal LLC (www.ZealLLC.com)
If you would like to receive our free newsletter via email, simply enter your email address below & click subscribe.
 Follow us on Twitter
 Become our facebook fan
CONNECT WITH US
Tweets
Tweet with hash tag #miningfeeds or @miningfeeds and your tweets will be displayed across this site.
MOST ACTIVE MINING STOCKS
Daily Gainers
 CMC Metals Ltd. CMC Metals Ltd. |
CMB.V | +900.00% |
 Eden Energy Ltd Eden Energy Ltd |
EDE.AX | +200.00% |
| GoviEx Uranium Inc. |
GXU.V | +42.86% |
| Eagle Nickel Ltd. |
ENL.AX | +41.67% |
| Citigold Corp. Limited |
CTO.AX | +33.33% |
| Mount Burgess Mining NL |
MTB.AX | +33.33% |
| Exalt Resources Limited |
ERD.AX | +31.94% |
| Casa Minerals Inc. |
CASA.V | +30.00% |
| Cariboo Rose Resources Ltd |
CRB.V | +28.57% |
| Belmont Resources Inc. |
BEA.V | +28.57% |


