
SPDR Gold Shares is an ETF that tracks the performance of gold in the financial markets. It is denominated by the ticker GLD and is one of the most widely watched gold indicators. The gold price is influenced by a unique set of factors. These include interest rates, the strength of the USD, supply and demand, etc. For casual traders, it’s important to know that gold is the go-to investment when equities markets sour.
When geopolitical uncertainty rocks the financial markets, investors typically flock to gold as a safe-haven asset. It tends to perform strongly when stock prices are volatile, and when the USD is weak. A strong dollar is a disincentive to gold investors, since gold is a dollar-denominated asset that appreciates when the precious metal is more affordable to foreign buyers.
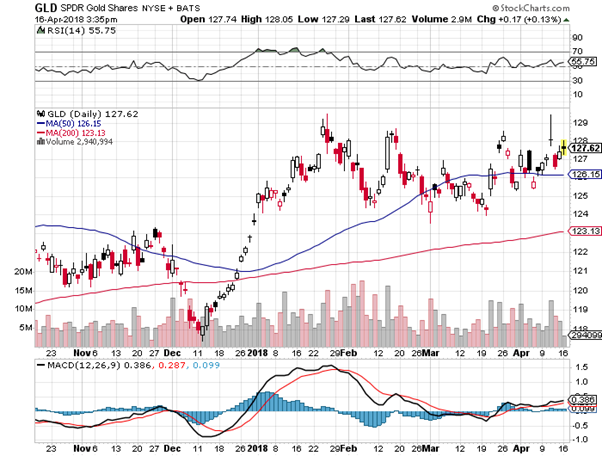
GLD provides one access point to investments in gold (there are many options available), and it is priced at a fraction of the gold price. For example, GLD was trading around $127.62 per share (April 16, 2018), above both the 50-day moving average of $126.15, and the 200-day moving average of $123.13. This clearly illustrates that gold is bullish. Corroborating evidence is available from the anaemic performance of US stock markets.
- The Dow Jones has a year to date return of -0.43%
- The S&P 500 Index has a year to date return of 0.22%
- The NASDAQ Composite Index has a year to date return of 3.72%
Poor Stock Market Performance Feeds Gold Price
The 2018 performance of stock markets is precisely the cannon fodder that commodities like gold need to appreciate. When traders and investors are pulling their money from the stock market, they are either investing it in fixed-interest-bearing securities or shifting resources to gold stocks and physical gold.
The current price of gold (April 16, 2018) is $1,349.10 per ounce on the Comex. Gold was priced at around $1,316.10 on 2 January 2018, and it has consistently appreciated ever since. In percentage terms, gold is up 2.5% for the year to date. This represents the opposite of what we are seeing in equities markets, and it holds true from a theoretical perspective.
Commodities trading options include a wide range of choices These include physical assets, futures contracts, options, exchange traded funds, CFDs, stocks, and even binary options. Gold ranks as one of the most commonly traded commodities and has been a store of value for millennia. Its price is determined by supply & demand considerations, and it is heavily influenced by monetary policy (interest rate hikes), political considerations, and the strength of the USD. A useful barometer of USD strength or weakness is the US dollar index, DXY. This indicator tracks the performance of the greenback against a trade-weighted basket of currencies including the SEK, CAD, GBP, EUR, CHF, and JPY.
Trump and Oil Boosted Gold Prices in 2017
US stock markets have floundered in 2018, and gold is in the black. If we extrapolate back to 2017, gold traded at around $1,151 per ounce in January 2017 and by the end of the year it closed at over $1,309 per ounce. That represents a 13.8% appreciation in the gold price. Equities markets also defied gravity in 2017, with double digit gains for major bourses. It appears that confidence in gold was boosted by uncertainty with oil prices and additional uncertainty related to Trump’s election as president. We have seen a tempering of these concerns as time progressed, and gold has stabilized while equities markets have retreated.
If you would like to receive our free newsletter via email, simply enter your email address below & click subscribe.
 Follow us on Twitter
 Become our facebook fan
CONNECT WITH US
Tweets
Tweet with hash tag #miningfeeds or @miningfeeds and your tweets will be displayed across this site.
MOST ACTIVE MINING STOCKS
Daily Gainers
 CMC Metals Ltd. CMC Metals Ltd. |
CMB.V | +900.00% |
 Eden Energy Ltd Eden Energy Ltd |
EDE.AX | +200.00% |
| GoviEx Uranium Inc. |
GXU.V | +42.86% |
| Eagle Nickel Ltd. |
ENL.AX | +41.67% |
| Citigold Corp. Limited |
CTO.AX | +33.33% |
| Mount Burgess Mining NL |
MTB.AX | +33.33% |
| Exalt Resources Limited |
ERD.AX | +31.94% |
| Casa Minerals Inc. |
CASA.V | +30.00% |
| Cariboo Rose Resources Ltd |
CRB.V | +28.57% |
| Belmont Resources Inc. |
BEA.V | +28.57% |


