
The U.S. stock markets are becoming more unstable, fueling mounting anxiety about what’s likely coming. After surging to new all-time-record highs in late July, stocks plunged in a sharp pullback as the US-China trade war escalated. Stock markets’ resiliency in the face of bearish news is partially determined by how companies are faring fundamentally. The big U.S. stocks’ just-reported Q2’19 results illuminate these key indicators.
Four times a year publicly-traded companies release treasure troves of valuable information in the form of quarterly reports. Required by the US Securities and Exchange Commission, these 10-Qs and 10-Ks contain the best fundamental data available to traders. They dispel all the sentiment distortions inevitably surrounding prevailing stock-price levels, revealing corporations’ underlying hard fundamental realities.
The deadline for filing 10-Qs for “large accelerated filers” is 40 days after fiscal quarter-ends. The SEC defines this as companies with market capitalizations over $700m. That easily includes every stock in the flagship S&P 500 stock index (SPX), which contains the biggest and best American companies. The middle of this week marked 38 days since the end of Q2, so almost all the big US stocks have reported.
The SPX is the world’s most-important stock index by far, with its components commanding a staggering collective market cap of $25.8t at the end of Q2! The vast majority of investors own the big US stocks of the SPX, as some combination of them are usually the top holdings of nearly every investment fund. That includes retirement capital, so the fortunes of the big U.S. stocks are crucial for Americans’ overall wealth.
The huge ETFs that track the S&P 500 dominate the increasingly-popular passive-investment strategies as well. The SPY SPDR S&P 500 ETF, IVV iShares Core S&P 500 ETF, and VOO Vanguard S&P 500 ETF are the 3 largest ETFs in the world. This week they reported colossal net assets running $258.5b, $179.3b, and $115.8b respectively! The big SPX companies overwhelmingly drive the entire stock markets.
Q2’19 proved quite volatile in the U.S. stock markets, leading to increasing unease. The SPX surged 3.9% higher in April, hitting 4 new record closing highs. That capped an unbelievable 25.3% rocketing over just 4.2 months, a crazy move higher. That was driven by extreme Fed dovishness, as it panicked following the SPX’s severe 19.8% near-bear correction that bottomed in late December. Euphoria reigned supreme.
But the big US stocks couldn’t stay at such lofty heights, so the SPX fell on balance through May on the way to a 6.8% pullback by early June. China reneged on major trade commitments it made to the US over a year through 10 rounds of high-level trade talks. So Trump ramped tariffs on a $200b tranche of annual Chinese imports into the US from 10% to 25%. US-China trade-war news was a key market driver in Q2.
That considerable selloff was reversed by a hyper-dovish Fed riding to the rescue. First its chairman said the Fed was ready to start cutting rates again, and later top Fed officials’ collective outlook for future rates shifted from one hike to one cut. The SPX blasted 7.6% higher in a few weeks on that, achieving another new record high in late June. The US-China trade war and Fed jawboning and actions will keep fueling volatility.
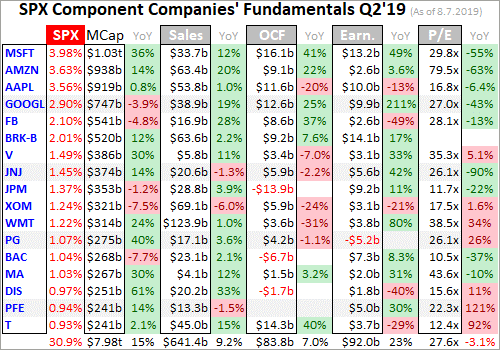
Every quarter I analyze the top 34 SPX/SPY component stocks ranked by market cap. This is just an arbitrary number that fits neatly into the tables below, but a dominant sample of the SPX. As Q2 waned, these American giants alone commanded fully 44.2% of the SPX’s total weighting! Their $11.4t collective market cap exceeded that of the bottom 439 SPX companies. Big US stocks’ importance cannot be overstated.
I wade through the 10-Q or 10-K SEC filings of these top SPX companies for a ton of fundamental data I feed into a spreadsheet for analysis. The highlights make it into these tables below. They start with each company’s symbol, weighting in the SPX and SPY, and market cap as of the final trading day of Q2’19. That’s followed by the year-over-year change in each company’s market capitalization, an important metric.
Major U.S. corporations have been engaged in a wildly-unprecedented stock-buyback binge ever since the Fed forced interest rates to the zero lower bound during 2008’s stock panic. Thus the appreciation in their share prices also reflects shrinking shares outstanding. Looking at market-cap changes instead of just underlying share-price changes effectively normalizes out stock buybacks, offering purer views of value.
That’s followed by quarterly sales along with their YoY change. Top-line revenues are one of the best indicators of businesses’ health. While profits can be easily manipulated quarter to quarter by playing with all kinds of accounting estimates, sales are tougher to artificially inflate. Ultimately sales growth is necessary for companies to expand, as bottom-line profits growth driven by cost-cutting is inherently limited.
Operating cash flows are also important, showing how much capital companies’ businesses are actually generating. Companies must be cash-flow-positive to survive and thrive, using their existing capital to make more cash. Unfortunately many companies now obscure quarterly OCFs by reporting them in year-to-date terms, lumping multiple quarters together. So if necessary to get Q2’s OCFs, I subtracted prior quarters’.
Next are the actual hard quarterly earnings that must be reported to the SEC under Generally Accepted Accounting Principles. Lamentably companies now tend to use fake pro-forma earnings to downplay real GAAP results. These are derided as EBS profits, Everything but the Bad Stuff! Certain expenses are simply ignored on a pro-forma basis to artificially inflate reported corporate profits, often misleading traders.
While I’m also collecting the earnings-per-share data Wall Street loves, it is more important to consider total profits. Stock buybacks are executed to manipulate EPS higher, because the shares-outstanding denominator of its calculation shrinks as shares are repurchased. Raw profits are a cleaner measure, again effectively neutralizing the impacts of stock buybacks. They better reflect underlying business performance.
Finally the trailing-twelve-month price-to-earnings ratios as of the end of Q2’19 are noted. TTM P/Es look at the last four reported quarters of actual GAAP profits compared to prevailing stock prices. They are the gold-standard valuation metric. Wall Street often intentionally conceals these real P/Es by using fictional forward P/Es instead, which are literally mere guesses about future profits that almost always prove too optimistic.
These are mostly calendar-Q2 results, but some big U.S. stocks use fiscal quarters offset from normal ones. Walmart, Cisco, and Home Depot have lagging quarters ending one month after calendar ones, so their results here are current to the end of April instead of June. Oracle uses quarters that end one month before calendar ones, so its results are as of the end of May. Such offset reporting ought to be banned.
Reporting on offset quarters renders companies’ results way less comparable with the vast majority that report on calendar quarters. We traders all naturally think in calendar-quarter terms too. Decades ago there were valid business reasons to run on offset fiscal quarters. But today’s sophisticated accounting systems that are largely automated running in real-time eliminate all excuses for not reporting normally.
Stocks with symbols highlighted in blue have newly climbed into the ranks of the SPX’s top 34 companies over the past year, as investors bid up their stock prices and thus market caps relative to their peers. Overall the big US stocks’ Q2’19 results looked decent, with modest sales and profits growth. But these growth rates are really slowing, and stock valuations remain near bubble levels relative to underlying earnings.

Over the past 19.3 years, I’ve written 873 of these weekly web essays. None are more challenging than these ones analyzing quarterly results. There’s so much data to collect and analyze, so much work to do. So it wasn’t until Q4’17 results that I took on this Herculean task. Understanding the fundamentals of big U.S. stocks is critical to gaming likely coming stock-market performance, so the hard work is well worth it.
Out of the 7 quarters so far in this essay series, the concentration of capital in the top 34 SPX companies has never been higher. A staggering 44.2% of the market capitalization of all 500 stocks is centralized in just 34 stocks! This compares to 41.7% in Q1’18. It is not healthy for a shrinking pool of market-darling stocks to dominate the entire US markets. That leaves market performance overly dependent on them.
Much of this ominous concentration risk comes from the beloved mega-cap technology companies. The SPX’s top 5 component stocks are Microsoft, Amazon, Apple, Alphabet, and Facebook. They commanded fully 16.2% of the SPX’s entire market cap at the end of Q2, nearly 1/6th! Thus if any one of them gets hit by bad company-specific news, it will help drag the entire stock markets lower intensifying any selling.
One of the cool perks of being a professional speculator and newsletter guy is I get to listen to financial television including CNBC and Bloomberg all day every day. That offers excellent reads on the prevailing sentiment that drives markets. Almost every professional money manager interviewed loves these elite mega-cap techs, including them in their top holdings. They are universally-held and incredibly-crowded trades.
When capital deployed in stocks becomes overly concentrated, that feeds on itself for awhile. Investors deploy capital with money managers based on their performance. If they don’t own these mega-cap techs that investment inflows have driven higher for years, they risk falling behind their peers and losing business. So money managers feel forced to buy the high-flying mega-cap techs even at lofty valuations.
Interestingly these guys try to justify their heavy mega-cap-tech holdings by claiming these stocks are less risky than the broader markets because their businesses are so strong. I can’t count the number of times I’ve heard that mega-cap techs are what to own in case of a recession. That’s total nonsense, as high-flying really-popular stocks have greater downside. The more capital invested, the more potential selling.
During that severe near-bear correction where the SPX plummeted 19.8% largely in Q4’18, these top 5 SPX stocks amplified that by 1.3x with a 24.8% average drop. When the SPX pulled back 6.8% mostly in May, MSFT, AMZN, AAPL, GOOGL, and FB averaged big 12.5% declines nearly doubling the SPX’s retreat! And during the sharp 6.0% SPX pullback since late July, their average fall of 7.8% again leveraged it 1.3x.
The serious risks of too much capital in too few stocks aside, the big U.S. stocks as a group enjoyed a solid Q2 fundamentally. Their collective revenues grew 2.7% year-over-year to $978.8b. Much of this was concentrated in those 5 mega-cap tech stocks, which averaged amazing 16.0% top-line growth compared to just 4.4% for the rest of the top 34 SPX stocks. Money managers use this to rationalize being overweight.
These elite tech market-darlings are certainly not recession-proof, despite the euphoria surrounding them. Recessions are often triggered by stock bear markets, which generate enough fear to scare both consumers and businesses into pulling in their horns and spending less. That is likely to lead to falling sales for all 5 of these mega-cap techs, which will hammer their prices sharply lower sucking in the SPX.
Businesses will cut back on their information-technology spending if they are worried about their own sales, hurting the fast-growing cloud-computing sides of Amazon, Microsoft, and Google. Companies will also cut back on their marketing spends if their own perceived prospects dim sufficiently, leading to lower revenues for Google, Facebook, and even Amazon. These high-flying stocks will really suffer in a bear market.
On the consumer side, the sales of Apple’s expensive products will plunge dramatically when consumers get worried about their own futures. They will keep their existing iPhones and iPads longer, extending the critical upgrade cycle. And most of the endless stuff Amazon sells is discretionary not essential, so those purchases will be cut back when people feel financially stressed. The top SPX stocks aren’t immune to a slowdown.
In Q2’19 these top 34 SPX and SPY stocks saw operating-cash-flow generation soar 17.0% YoY to $144.8b. Again those 5 mega-cap techs led the way, with 21.0% average growth compared to 12.9% for the rest. But these market-darling tech companies benefit heavily from the great optimism spawned by record-high stock markets. That convinces both companies and consumers to heavily buy their offerings.
The GAAP-earnings front was more interesting, with these big US stocks’ total profits up just 4.2% YoY to $140.5b in Q2’19. These were dragged down by a couple notable losses, including Procter & Gamble writing down $8.3b in a massive goodwill-impairment charge. That was an admission this company paid far too much for its Gillette shaving business, as men are shaving less and increasingly using cheaper razors.
Then Boeing suffered an ugly $3.4b loss from operations due to its ill-fated 737 MAX airplane. This is a 1960s-era airframe that was upgraded with engines far larger than ever intended in order to maximize fuel efficiency. But these wouldn’t fit under the wings, so they were mounted forward and higher. That screwed up this airplane’s center of gravity and aerodynamics, requiring computer assistance to keep flying.
Either this inherently-unstable flawed design or software bugs caused two horrific crashes killing 346 people. So the entire 737 MAX fleet was grounded, and that airplane was supposed to generate about a third of Boeing’s revenue over the next 5 years! So this company is in a world of hurt until well after this airplane is cleared to fly again. Overall SPX-top-34 profits would’ve been even higher without these losses.
While 4.2% profits growth sounds good, it is still slowing sharply. Overall SPX corporate-earnings growth rocketed 20.5% higher in 2018 largely thanks to the Tax Cuts and Jobs Act. Its centerpiece slashed the US corporate tax rate from 35% to 21%, which went effective as last year dawned. 2018’s four quarters were the only ones comparing pre- and post-TCJA earnings. This year the comparisons are all post-tax-cut.
Thanks to the stock markets’ massive corporate-tax-cut rally in 2017 and 2018, and sharp rebound on the Fed’s radical shift to dovishness earlier this year, valuations remain dangerously high. They are still up near historical bubble levels heralding new bear markets. So low-single-digit earnings growth, with the threat of actual shrinkage in future quarters, isn’t likely to be enough to support these lofty stock prices for long.
Before we get to valuations though, there’s more to consider on the big US stocks’ earnings. One of the main reasons corporations engage in stock buybacks is to artificially boost their reported earnings per share. That masks what their underlying overall GAAP profits are doing, lulling traders into complacency. Some of the companies among these top 34 had yawning gulfs between earnings per share and total profits!
The main culprits were the top 4 mega-cap US banks, JPMorgan Chase, Bank of America, Wells Fargo, and Citigroup. Their financial reporting is mind-bogglingly complex, and full of estimates that allow them to actively manipulate their reported earnings per share. Wall Street loves the big financial stocks, which are often the most-important sector after mega-cap tech for coloring sentiment for the entire stock markets.
JPM’s EPS soared 22.5% YoY in Q2 despite total GAAP earnings only up 10.5%. BAC looked similar at 17.2% EPS growth versus 8.3% overall profits growth. WFC saw earnings per share soar 33.7% YoY despite overall earnings only rising 19.7%. And C’s 19.0% EPS surge literally tripled its 6.3% growth in hard GAAP profits! Something is really wrong here and highly misleading, eventually the truth will catch up.
Some big non-financial stocks also had magical earnings-per-share growth far outstripping underlying corporate-profits growth. Cisco’s EPS rocketed 25.0% higher despite mere 13.1% growth in the bottom-line profits on its income statement. Sooner or later there has to be a reckoning between earnings per share and actual profits, even if huge stock buybacks persist. These key profits measures have to converge.
Wall Street analysts have grown adept at using misdirection to blind investors to the adverse trends in earnings growth. Mighty Apple was a key case in point recently, reporting its Q2’19 results after the close on July 30th. This was heralded as a big beat, with EPS of $2.18 on revenues of $53.8b both exceeding expectations of $2.10 and $53.4b. By those metrics it looked like Apple was thriving, so its stock shot higher.
In after-hours trading it was up 4%+, and by the middle of the next day this monster-market-cap stock had rocketed 6.0% higher! The problem was comparing those Q2 results to estimates is totally deceptive. The analysts always lowball their guesses to ensure companies beat, stoking euphoria and complacency. But all that really matters is companies’ absolute profits and sales growth compared to their year-earlier quarters.
In hard year-over-year terms, Apple’s Q2’19 sales only eked out a 1.0% gain. That was pathetic relative to its other 4 mega-cap-tech peers, which averaged 19.7%. And Apple’s Q2’19 GAAP earnings actually plunged 12.8% YoY from Q2’18! So what Wall Street dishonestly spun into a great quarter was in reality a weaker one. Eventually stock prices have to reflect underlying fundamentals, not perma-bull propaganda.
Ominously stock prices remain dangerously high relative to their underlying corporate earnings. The big U.S. stocks averaged trailing-twelve-month price-to-earnings ratios way up at 27.5x as Q2’19 wrapped up. That is just shy of the historical bubble threshold above 28x! So the current earnings picture over the past 4 quarters certainly doesn’t justify such lofty stock prices. That greatly amplifies market downside risk.
These chronic overvaluations aren’t just concentrated in those top 5 mega-cap tech stocks, which sported 36.2x average P/Es. The rest of the top 34 were still near bubble territory averaging 25.9x. Trading at such high valuations, these stock markets are an accident waiting to happen. It’s only a matter of time until the next bear market arrives. It could be spawned by the mounting US-China trade war, or weaker profits.
Over the past several calendar years, earnings growth among all 500 SPX companies ran 9.3%, 16.2%, and 20.5%. This year even Wall Street analysts expect it to be flat at best. And if corporate revenues actually start shrinking due to mounting trade wars or rolling-over stock markets damaging confidence and spending, profits will amplify that downside. Declining SPX profits will proportionally boost valuations.
Excessive valuations after long bulls always eventually spawn proportional bear markets. And we are way overdue for the next one. At its latest all-time-record high in late July, this current monster SPX bull up 347.3% in 10.4 years ranked as the 2nd-largest and 1st-longest in all of US stock-market history! This powerful secular uptrend can’t persist near bubble valuations as corporate-earnings growth stalls or even reverses.
Bear markets are necessary to maul stock prices sideways to lower long enough for profits to catch up with lofty stock prices. These fearsome beasts are nothing to be trifled with, yet complacent traders mock them. The SPX’s last couple bears that awoke and ravaged due to high valuations pummeled the SPX 49.1% lower in 2.6 years leading into October 2002, and 56.8% lower over 1.4 years leading into March 2009!
Seeing big US stocks’ prices cut in half or worse is common and expected in major bear markets. And there’s a decent chance the current near-bubble valuations in US stock markets will soon look even more extreme. If the big US stocks’ fundamentals deteriorate, the overdue bear reckoning after this monster bull is even more certain. So big US stocks’ coming Q3’19 and Q4’19 results could prove pivotal if they’re weak.
Cash is king in bear markets, since its buying power grows. Investors who hold cash during a 50% bear market can double their holdings at the bottom by buying back their stocks at half-price. But cash doesn’t appreciate in value like gold, which actually grows wealth during major stock-market bears. When stock markets weaken its investment demand surges, which happened in December as the SPX sold off hard.
While the SPX plunged 9.2% that month, gold rallied 4.9% as investors flocked back. The gold miners’ stocks which leverage gold’s gains fared even better, with their leading index surging 10.7% higher. The last time a major SPX selloff awakened gold in the first half of 2016, it soared up 30% fueling a massive 182% gold-stock upleg! Gold’s awesome decisive bull breakout in late June is already attracting traders back.
Absolutely essential to weathering bears is cultivating excellent contrarian intelligence sources. That’s our specialty at Zeal. After decades studying the markets and trading, we really walk the contrarian walk. We buy low when few others will, so we can later sell high when few others can. Lately we’ve been doing this in gold stocks, buying them while out of favor earlier this year to enjoy massive gains in recent months.
This past week we realized absolute gains on gold-stock trades including 109.7%, 105.8%, and 92.0%! All our trades, analyses, and outlooks are detailed in our popular weekly and monthly newsletters for speculators and investors. They draw on my vast experience, knowledge, wisdom, and ongoing research to explain what’s going on in the markets, why, and how to trade them with specific stocks. Subscribe today and take advantage of our 20%-off summer-doldrums sale! Staying informed is essential for success.
The bottom line is big U.S. stocks’ latest fundamentals from Q2’19’s earnings season were decent. These elite companies enjoyed modest sales and earnings growth. But that masked serious and mounting risks. Investment capital is increasingly concentrating in the beloved mega-cap technology stocks, leaving stock markets overly dependent on their fortunes. Any slowing from them will drag the entire stock markets lower.
More ominously big U.S. stocks’ valuations remain way up near dangerous bubble territory. Their earnings aren’t justifying their lofty stock prices. The resulting downside risks are exacerbated with profits growth really slowing, and threatening to stall out entirely or even shrink in coming quarters. This is a potently-bearish situation, even before any bad news like further escalation in the US-China trade war hits stocks.
Adam Hamilton, CPA
August 13, 2019
Copyright 2000 – 2019 Zeal LLC (www.ZealLLC.com)
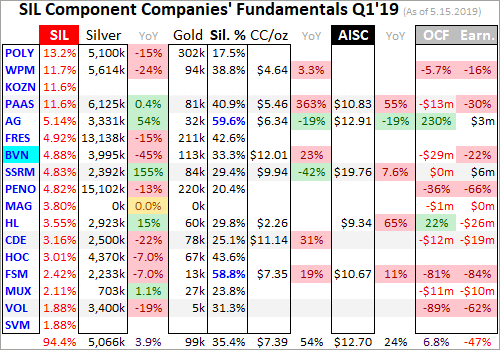
The silver miners’ stocks have been pummeled in recent months, plunging near major secular lows in late May. Sentiment in this tiny sector is miserable, reflecting silver prices continuing to languish relative to gold. This has forced traditional silver miners to increasingly diversify into gold, which has far-superior economics. The major silver miners’ ongoing shift from silver is apparent in their recently-released Q1’19 results.
Four times a year publicly-traded companies release treasure troves of valuable information in the form of quarterly reports. Required by the U.S. Securities and Exchange Commission, these 10-Qs and 10-Ks contain the best fundamental data available to traders. They dispel all the sentiment distortions inevitably surrounding prevailing stock-price levels, revealing corporations’ underlying hard fundamental realities.
The definitive list of major silver-mining stocks to analyze comes from the world’s most-popular silver-stock investment vehicle, the SIL Global X Silver Miners ETF. Launched way back in April 2010, it has maintained a big first-mover advantage. SIL’s net assets were running $294m in mid-May near the end of Q1’s earnings season, 5.6x greater than its next-biggest competitor’s. SIL is the leading silver-stock benchmark.
In mid-May SIL included 24 component stocks, which are weighted somewhat proportionally to their market capitalizations. This list includes the world’s largest silver miners, including the biggest primary ones. Every quarter I dive into the latest operating and financial results from SIL’s top 17 companies. That’s simply an arbitrary number that fits neatly into the table below, but still a commanding sample.
As of mid-May these major silver miners accounted for fully 94.4% of SIL’s total weighting. In Q1’19 they collectively mined 70.9m ounces of silver. The latest comprehensive data available for global silver supply and demand came from the Silver Institute in April 2019. That covered 2018, when world silver mine production totaled 855.7m ounces. That equates to a run rate around 213.9m ounces per quarter.
Assuming that mining pace persisted in Q1’19, SIL’s top 17 silver miners were responsible for about 33% of world production. That’s relatively high considering just 26% of 2018’s global silver output was produced at primary silver mines! 38% came from lead/zinc mines, 23% from copper, and 12% from gold. Nearly 3/4ths of all silver produced worldwide is just a byproduct. Primary silver mines and miners are fairly rare.
Scarce silver-heavy deposits are required to support primary silver mines, where over half their revenue comes from silver. They are increasingly difficult to discover and ever-more expensive to develop. And silver’s challenging economics of recent years argue against miners even pursuing it. So even traditional major silver miners have shifted their investment focus into actively diversifying into far-more-profitable gold.
Silver price levels are best measured relative to prevailing gold prices, which overwhelmingly drive silver price action. In late May the Silver/Gold Ratio continued collapsing to its worst levels witnessed in 26.1 years, since April 1993! These secular extremes of the worst silver price levels in over a quarter century are multiplying the endless misery racking this once-proud sector. This silver environment is utterly wretched.
The largest silver miners dominating SIL’s ranks are scattered around the world. 10 of the top 17 mainly trade in U.S. stock markets, 3 in the United Kingdom, and 1 each in South Korea, Mexico, Peru, and Canada. SIL’s geopolitical diversity is good for investors, but makes it difficult to analyze and compare the biggest silver miners’ results. Financial-reporting requirements vary considerably from country to country.
In the U.K. companies report in half-year increments instead of quarterly. Some silver miners still publish quarterly updates, but their data is limited. In cases where half-year data is all that was made available, I split it in half for a Q1 approximation. Canada has quarterly reporting, but the deadlines are looser than in the States. Some Canadian miners really drag their feet, publishing their quarterlies close to legal limits.
The big silver companies in South Korea, Mexico, and Peru present other problems. Their reporting is naturally done in their own languages, which I can’t decipher. Some release limited information in English, but even those translations can be difficult to interpret due to differing accounting standards and focuses. It’s definitely challenging bringing all the quarterly data together for the diverse SIL-top-17 silver miners.
But analyzing them in the aggregate is essential to understand how they are faring. So each quarter I wade through all available operational and financial reports and dump the data into a big spreadsheet for analysis. Some highlights make it into this table. Blank fields mean a company hadn’t reported that data by mid-May, as Q1’s earnings season wound down. Some of SIL’s components report in gold-centric terms.
The first couple columns of this table show each SIL component’s symbol and weighting within this ETF as of mid-May. While most of these stocks trade on US exchanges, some symbols are listings from companies’ primary foreign stock exchanges. That’s followed by each miner’s Q1’19 silver production in ounces, along with its absolute year-over-year change. Next comes this same quarter’s gold production.
Nearly all the major silver miners in SIL also produce significant-to-large amounts of gold! That’s truly a double-edged sword. While gold really stabilizes and boosts silver miners’ cash flows, it also retards their stocks’ sensitivity to silver itself. So the next column reveals how pure these elite silver miners are, approximating their percentages of Q1’19 revenues actually derived from silver. This is calculated one of two ways.
The large majority of these top SIL silver miners reported total Q1 revenues. Quarterly silver production multiplied by silver’s average price in Q1 can be divided by these sales to yield an accurate relative-purity gauge. When Q1 sales weren’t reported, I estimated them by adding silver sales to gold sales based on their production and average quarterly prices. But that’s less optimal, as it ignores any base-metals byproducts.
Next comes the major silver miners’ most-important fundamental data for investors, cash costs and all-in sustaining costs per ounce mined. The latter directly drives profitability which ultimately determines stock prices. These key costs are also followed by YoY changes. Last but not least the annual changes are shown in operating cash flows generated and hard GAAP earnings, with a couple exceptions necessary.
Percentage changes aren’t relevant or meaningful if data shifted from positive to negative or vice versa, or if derived from two negative numbers. So in those cases I included raw underlying data rather than weird or misleading percentage changes. Companies with symbols highlighted in light-blue have newly climbed into the elite ranks of SIL’s top 17 over this past year. This entire dataset together is quite valuable.
It offers a fantastic high-level read on how the major silver miners are faring fundamentally as an industry and individually. The crazy-low silver prices really weighed on operating cash flows and earnings in Q1, and the silver miners’ years-old shift into gold continued. These companies are having no problem just surviving this silver-sentiment wasteland, but they probably won’t be thriving again before silver recovers.
SIL’s poor performance certainly reflects the challenges of profitably mining silver with its price so darned cheap. Year-to-date in late May, SIL had already lost 12.2%. Silver itself was down 7.2% YTD at worst, starting to threaten mid-November 2018’s 2.8-year secular low of $13.99. And that just extended last year’s losing trend, where SIL plunged 23.3% amplifying silver’s own 8.6% loss by 2.7x. This sector looks ugly.
Silver’s weakest prices relative to gold in over a quarter century have continued to devastate silver-mining sentiment. Investors understandably want nothing to do with the forsaken silver miners, so their stock prices languish near major lows. Even their own managements seem really bearish, increasingly betting their companies’ futures on gold rather than silver. Silver’s Q1 price action further supports this decision.
During Q1’19 silver ground another 2.3% lower despite a 0.8% gold rally, bucking its primary driver. Q1’s average silver price of $15.54 fell 7.1% YoY from Q1’18’s average. That was way worse than gold’s mere 1.9% YoY average-price decline. The silver-mining industry is laboring under a pall of despair. Although production decisions aren’t made quarter by quarter, the chronically-weak silver prices are choking off output.
Production is the lifeblood of silver miners, and it continued to slide. The SIL top 17 that had reported their Q1 results by mid-May again mined 70.9m ounces of silver. That was down 3.1% YoY from Q1’18’s silver production, excluding Silvercorp Metals. SVM’s fiscal years end after Q1s, and it doesn’t report its longer more-comprehensive annual results until well after Q1’s normal quarterly earnings season wraps up.
It’s not just these major silver miners producing less of the white metal, the entire industry is according to the Silver Institute’s latest World Silver Survey. 2018 was the third year in a row of waning global silver mine production. This shrinkage is accelerating too as silver continues to languish, running 0.0% in 2016, 1.8% in 2017, and 2.4% in 2018! Peak silver may have been seen with this metal so unrewarding to mine.
The traditional major silver miners aren’t taking silver’s vexing fading lying down. They’ve spent recent years increasingly diversifying into gold, which has way-superior economics with silver prices so bombed out. The SIL top 17’s total gold production surged 10.9% YoY to 1387k ounces in Q1! This producing-less-silver-and-more-gold trend will continue to grow as long as silver prices waste away in the gutter.
Silver mining is as capital-intensive as gold mining, requiring similar large expenses to plan, permit, and construct new mines, mills, and expansions. It needs similar fleets of heavy excavators and haul trucks to dig and move the silver-bearing ore. Similar levels of employees are necessary to run silver mines. But silver generates much-lower cash flows than gold due its lower price. Silver miners have been forced to adapt.
This is readily evident in the top SIL miners’ production in Q1’19. SIL’s largest component in mid-May as this latest earnings season ended was the Russian-founded but UK-listed Polymetal. Its silver production fell 15.0% YoY in Q1, but its gold output surged 41.1%! Just 17.5% of its Q1 revenues came from silver, making it overwhelmingly a primary gold miner. Its newest mine ramping up is another sizable gold one.
SIL’s second-largest component is Wheaton Precious Metals. It used to be a pure silver-streaming play known as Silver Wheaton. Silver streamers make big upfront payments to miners to pre-purchase some of their future silver production at far-below-market unit prices. This is beneficial to miners because they use the large initial capital infusions to help finance mine builds, which banks often charge usurious rates for.
Back in May 2017 Wheaton changed its name and symbol to reflect its increasing diversification into gold streaming. In Q1’19 WPM’s silver output collapsed 24.4% YoY, but its gold surged 17.4% higher! That pushed its silver-purity percentage in sales terms to just 38.8%, way below the 50%+ threshold defining primary silver miners. WPM’s 5-year guidance issued in February forecasts this gold-heavy ratio persisting.
Major silver miners are becoming so scarce that SIL’s third-largest component is Korea Zinc. Actually a base-metals smelter, this company has nothing to do with silver mining. It ought to be kicked out of SIL post-haste, as its presence and big 1/9th weighting really retards this ETF’s performance. Korea Zinc smelted about 64.0m ounces of silver in 2018, which approximates roughly 17% of its full-year revenue.
Global X was really scraping the bottom of the barrel to include a company like Korea Zinc in SIL. I’m sure there’s not a single SIL investor who wants base-metals-smelting exposure in what is advertised as a “Silver Miners ETF”. The weighting and capital allocated to Korea Zinc can be reallocated and spread proportionally across the other SIL stocks. The ranks of major silver miners are becoming more rarefied.
SIL’s fourth-largest component in mid-May is Pan American Silver, which has a proud heritage mining its namesake metal. In Q1’19 its silver production was flat with a negligible 0.4% YoY increase, yet its gold output soared 74.2%! Thus PAAS’s silver purity slumped to 40.9%, the lowest by far seen in the years I’ve been doing this quarterly research. And it’s going to get much more gold-centric in coming quarters.
PAAS acquired troubled silver miner Tahoe Resources back in mid-November. Tahoe had owned what was once the world’s largest silver mine, Escobal in Guatemala. It had produced 5.7m ounces in Q1’17 before that country’s government unjustly shut it down after a frivolous lawsuit on a trivial bureaucratic misstep by the regulator. PAAS hopes to work through the red tape to win approval for Escobal to restart.
But the real prize in that fire-sale buyout was Tahoe’s gold production from other mines. That deal closed in late February, so that new gold wasn’t fully reflected in PAAS’s Q1 results. Now this former silver giant is forecasting midpoint production of 27.1m ounces of silver and 595.0k ounces of gold in 2019! That is way into mid-tier-gold territory and a far cry from 2018’s output of 24.8m and 178.9k. PAAS has turned yellow.
Pan American will probably soon follow in Wheaton’s footsteps and change its name and symbol to reflect its new gold-dominated future. As miserable as silver has been faring, I’m starting to wonder if the word “silver” in a miner’s name is becoming a liability with investors. The major primary silver miners are going extinct, forced to adapt by diversifying out of silver and into gold as the former languishes deeply out of favor.
In Q1’19 the SIL-top-17 miners averaged only 35.4% of their revenues derived from silver. That’s also the lowest seen since I started this thread of research with Q2’16 results. Only two of these miners remained primary silver ones, and their silver-purity percentages over 50% are highlighted in blue. They are First Majestic Silver and Fortuna Silver Mines, which together accounted for just 7.6% of SIL’s total weighting.
With SIL-top-17 silver production sliding 3.1% YoY in Q1’19, the per-ounce mining costs should’ve risen proportionally. Silver-mining costs are largely fixed quarter after quarter, with actual mining requiring the same levels of infrastructure, equipment, and employees. So the lower production, the fewer ounces to spread mining’s big fixed costs across. SIL’s major silver miners indeed reported higher costs last quarter.
There are two major ways to measure silver-mining costs, classic cash costs per ounce and the superior all-in sustaining costs. Both are useful metrics. Cash costs are the acid test of silver-miner survivability in lower-silver-price environments, revealing the worst-case silver levels necessary to keep the mines running. All-in sustaining costs show where silver needs to trade to maintain current mining tempos indefinitely.
Cash costs naturally encompass all cash expenses necessary to produce each ounce of silver, including all direct production costs, mine-level administration, smelting, refining, transport, regulatory, royalty, and tax expenses. In Q1’19 these SIL-top-17 silver miners reported cash costs averaging $7.39 per ounce. While that surged 23.6% YoY, it still remains far below prevailing prices. Silver miners face no existential threat.
The major silver miners’ average cash costs vary considerably quarter-to-quarter, partially depending on whether or not Silvercorp Metals happens to have edged into the top 17. This Canadian company mining in China has negative cash costs due to massive byproduct credits from lead and zinc. So over the past couple years, SIL-top-17 average cash costs have swung wildly ranging all the way from $3.95 to $6.75.
Way more important than cash costs are the far-superior all-in sustaining costs. They were introduced by the World Gold Council in June 2013 to give investors a much-better understanding of what it really costs to maintain silver mines as ongoing concerns. AISCs include all direct cash costs, but then add on everything else that is necessary to maintain and replenish operations at current silver-production levels.
These additional expenses include exploration for new silver to mine to replace depleting deposits, mine-development and construction expenses, remediation, and mine reclamation. They also include the corporate-level administration expenses necessary to oversee silver mines. All-in sustaining costs are the most-important silver-mining cost metric by far for investors, revealing silver miners’ true operating profitability.
The SIL-top-17 silver miners reporting AISCs in Q1’19 averaged $12.70 per ounce, 7.2% higher YoY. That remained considerably below last quarter’s average silver price of $15.54, as well as late May’s ugly silver low of $14.34. So the silver-mining industry as a whole is still profitable even with silver drifting near quarter-century-plus lows relative to gold. And those AISCs are skewed higher by SSR Mining’s outlying read.
Another traditional silver miner that changed its name, this company used to be known as Silver Standard Resources. SSRM has shifted into gold too, gradually winding down its old Pirquitas silver mine resulting in abnormally-high AISCs of $19.76 per ounce. Excluding these, the SIL-top-17 average in Q1 falls to $10.94 which is a much-more-comfortable profits cushion between production costs and low silver prices.
Interestingly SSRM has been ramping up a new mine close to its old Pirquitas mill, and is starting to run that ore through. That makes SSR Mining one of the rare silver miners that’s going to see growing output this year. It is forecasting a midpoint of 4.9m ounces of silver production in 2019, a 74% jump from last year’s levels! Higher production should lead to lower AISCs going forward, pulling the average back down.
As hopeless as silver has looked in recent months, it won’t stay down forever. Sooner or later gold will catch a major bid, probably on surging investment demand as these dangerous stock markets roll over. Capital will start migrating back into silver like usual once gold rallies long enough and high enough to convince traders its uptrend is sustainable. Since the silver market is so small, that portends much-higher prices.
At Q1’19’s average silver price of $15.54 and average SIL-top-17 AISCs of $12.70, these miners were earning $2.84 per ounce. That’s not bad for a sector that investors have left for dead, convinced it must be doomed. Being so wildly undervalued relative to gold, silver has the potential to surge much higher in the next gold upleg. The average Silver/Gold Ratio since Q1’16 right after today’s gold bull was born was 77.1x.
At $1400 and $1500 gold which are modest upleg gains, silver mean reverting to recent years’ average SGR levels would yield silver targets of $18.16 and $19.46. That’s conservative, ignoring the high odds for a mean-reversion overshoot, and only 16.9% and 25.2% above Q1’s average price. Yet with flat AISCs that would boost the SIL top 17’s profits by 92.3% and 138.0%! Their upside leverage to silver is amazing.
The caveat is the degree to which silver miners’ earnings amplify this metal’s upside is dependent on how much of their sales are still derived from silver when it turns north. If the SIL top 17 are still getting 35% of their sales from silver, their stocks should surge with silver. But the more they diversify into gold, the more dependent they will be on gold-price moves. Those aren’t as big as silver’s since gold is a far-larger market.
On the accounting front the top 17 SIL silver miners’ Q1’19 results highlighted the challenges of super-low silver prices. These companies collectively sold $3.0b worth of metals in Q1, which actually clocked in at an impressive 10.8% YoY increase. That was totally the result of these companies mining 10.9% more gold in Q1. Though it dilutes their silver-price exposure, shifting into gold really strengthens them financially.
But operating-cash-flow generation looked much worse, collapsing 55.1% YoY to $237m across the SIL top 17 that reported them for Q1. There was no single-company disaster, but Q1’s average silver prices being 7.1% lower YoY eroded OCFs universally. That led to these miners’ collective treasuries shrinking 22.9% YoY to $2.3b. That’s plenty to operate on, but not that much to fund many mine builds or expansions.
Hard GAAP profits reported by the SIL top 17 silver miners were very weak too in Q1’19, plunging 54.9% YoY to $123m. But there were no major writedowns from these low silver prices impairing the value of silver mines and deposits. Investors don’t buy silver stocks for how they are doing today, but for what they are likely to do as silver mean reverts higher. Silver-mining earnings surge dramatically as silver recovers.
Silver’s last major upleg erupted in essentially the first half of 2016, when silver soared 50.2% higher on a parallel 29.9% gold upleg. SIL blasted 247.8% higher in just 6.9 months, a heck of a gain for major silver stocks. But the purer primary silver miners did far better. The purest major silver miner First Majestic’s stock was a moonshot, skyrocketing a staggering 633.9% higher in that same short span! SIL’s gains are muted.
The key takeaway here is avoid SIL. The world’s leading “Silver Miners ETF” is increasingly burdened with primary gold miners with waning silver exposure. And having over 1/9th of your capital allocated to silver miners squandered in Korea Zinc is sheer madness! If you want to leverage silver’s long-overdue next mean reversion higher relative to gold, it’s far better to deploy in smaller purer primary silver miners alone.
One of my core missions at Zeal is relentlessly studying the silver-stock world to uncover the stocks with superior fundamentals and upside potential. The trading books in both our popular weekly and monthly newsletters are currently full of these better gold and silver miners. Mostly added in recent months as these stocks recovered from deep lows, their prices remain relatively low with big upside potential as gold rallies!
If you want to multiply your capital in the markets, you have to stay informed. Our newsletters are a great way, easy to read and affordable. They draw on my vast experience, knowledge, wisdom, and ongoing research to explain what’s going on in the markets, why, and how to trade them with specific stocks. As of Q1 we’ve recommended and realized 1089 newsletter stock trades since 2001, averaging annualized realized gains of +15.8%! That’s nearly double the long-term stock-market average. Subscribe today for just $12 per issue!
The bottom line is the major silver miners are still struggling. With silver continuing to languish at quarter-century-plus lows relative to gold, the economics of extracting it remain challenging. That led to slowing silver production and higher costs in Q1. The traditional major silver miners continued their years-long trend of increasingly diversifying into gold. Their percentage of sales derived from silver is still shrinking.
There aren’t enough major primary silver miners left to flesh out their own ETF, which is probably why SIL is dominated by gold miners. While it will rally with silver amplifying its gains, SIL’s upside potential is just dwarfed by the remaining purer silver stocks. Investors will be far-better rewarded buying them instead of settling for a watered-down silver-miners ETF. Their stocks will really surge as silver mean reverts much higher.
Adam Hamilton, CPA
June 4, 2019
Copyright 2000 – 2019 Zeal LLC (www.ZealLLC.com)
The U.S. stock markets sure feel inflectiony, at a major juncture. After achieving new all-time record highs, sentiment was euphoric heading into this week. But those latest heights could be a massive triple top that formed over 15 months. Then heavy selling erupted in recent days as the U.S.-China trade war suddenly went hostile. The big U.S. stocks just-reported Q1’19 fundamentals will help determine where markets go next.
Four times a year publicly-traded companies release treasure troves of valuable information in the form of quarterly reports. Required by the U.S. Securities and Exchange Commission, these 10-Qs and 10-Ks contain the best fundamental data available to traders. They dispel all the sentiment distortions inevitably surrounding prevailing stock-price levels, revealing corporations’ underlying hard fundamental realities.
The deadline for filing 10-Qs for “large accelerated filers” is 40 days after fiscal quarter-ends. The SEC defines this as companies with market capitalizations over $700m. That currently includes every stock in the flagship S&P 500 stock index (SPX), which contains the biggest and best American companies. The middle of this week marked 38 days since the end of Q1, so almost all the big U.S. stocks have reported.
The SPX is the world’s most-important stock index by far, with its components commanding a staggering collective market cap of $24.9t at the end of Q1! The vast majority of investors own the big U.S. stocks of the SPX, as some combination of them are usually the top holdings of nearly every investment fund. That includes retirement capital, so the fortunes of the big U.S. stocks are crucial for Americans’ overall wealth.
The major ETFs that track the S&P 500 dominate the increasingly-popular passive-investment strategies as well. The SPY SPDR S&P 500 ETF, IVV iShares Core S&P 500 ETF, and VOO Vanguard S&P 500 ETF are among the largest in the world. This week they reported colossal net assets running $271.9b, $175.1b, and $111.5b respectively! The big SPX companies overwhelmingly drive the entire stock markets.
Q1’19 proved extraordinary, the SPX soaring 13.1% higher in a massive rebound rally after suffering a severe correction largely in Q4. That pummeled this key benchmark stock index 19.8% lower in jU.S.t 3.1 months, right on the verge of entering a new bear market at -20%. By the end of Q1, fully 5/6ths of those deep losses had been reversed. Did the big U.S. stocks’ fundamental performances support such huge gains?
Corporate-earnings growth was expected to slow dramatically in Q1, stalling out after soaring 20.5% last year. 2018’s four quarters straddled the Tax Cuts and Jobs Act, which became law right when that year dawned. Its centerpiece was slashing the U.S. corporate tax rate from 35% to 21%, which naturally greatly boosted profits from pre-TCJA levels. Q1’19 would be the first quarter with post-TCJA year-over-year comparisons.
Big U.S. stocks’ valuations, where their stock prices are trading relative to their underlying earnings, offer critical clues on what is likely coming next. By late April the epic stock-market bull as measured by the SPX extended to huge 335.4% gains over 10.1 years! That clocked in as the second-largest and first-longest bull in U.S. stock-market history. With the inevitable subsequent bear overdue, valuations really matter.
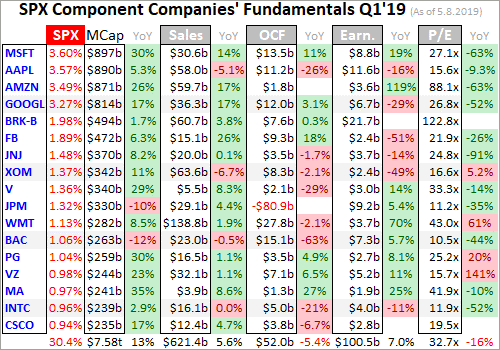
Every quarter I analyze the top 34 SPX/SPY component stocks ranked by market cap. This is just an arbitrary number that fits neatly into the tables below, but a dominant sample of the SPX. As Q1 waned, these American giants alone commanded fully 43.7% of the SPX’s total weighting! Their $10.9t collective market cap exceeded that of the bottom 437 SPX companies. Big U.S. stocks’ importance cannot be overstated.
I wade through the 10-Q or 10-K SEC filings of these top SPX companies for a ton of fundamental data I feed into a spreadsheet for analysis. The highlights make it into these tables below. They start with each company’s symbol, weighting in the SPX and SPY, and market cap as of the final trading day of Q1’19. That’s followed by the year-over-year change in each company’s market capitalization, an important metric.
Major U.S. corporations have been engaged in a wildly-unprecedented stock-buyback binge ever since the Fed forced interest rates to deep artificial lows during 2008’s stock panic. Thus, the appreciation in their share prices also reflects shrinking shares outstanding. Looking at market-cap changes instead of just underlying share-price changes effectively normalizes out stock buybacks, offering purer views of value.
That’s followed by quarterly sales along with their YoY change. Top-line revenues are one of the best indicators of businesses’ health. While profits can be easily manipulated quarter to quarter by playing with all kinds of accounting estimates, sales are tougher to artificially inflate. Ultimately sales growth is necessary for companies to expand, as bottom-line profits growth driven by cost-cutting is inherently limited.
Operating cash flows are also important, showing how much capital companies’ businesses are actually generating. Companies must be cash-flow-positive to survive and thrive, using their existing capital to make more cash. Unfortunately many companies now obscure quarterly OCFs by reporting them in year-to-date terms, lumping multiple quarters together. So if necessary to get Q1’s OCFs, I subtracted prior quarters’.
Next are the actual hard quarterly earnings that must be reported to the SEC under Generally Accepted Accounting Principles. Lamentably companies now tend to use fake pro-forma earnings to downplay real GAAP results. These are derided as EBS profits, Everything but the Bad Stuff! Certain expenses are simply ignored on a pro-forma basis to artificially inflate reported corporate profits, often misleading traders.
While we’re also collecting the earnings-per-share data Wall Street loves, it’s more important to consider total profits. Stock buybacks are executed to manipulate EPS higher, because the shares-outstanding denominator of its calculation shrinks as shares are repurchased. Raw profits are a cleaner measure, again effectively neutralizing the impacts of stock buybacks. They better reflect underlying business performance.
Finally the trailing-twelve-month price-to-earnings ratios as of the end of Q1’19 are noted. TTM P/Es look at the last four reported quarters of actual GAAP profits compared to prevailing stock prices. They are the gold-standard metric for valuations. Wall Street often intentionally conceals these real P/Es by using the fictional forward P/Es instead, which are literally mere guesses about future profits that often prove far too optimistic.
These are mostly calendar-Q1 results, but some big U.S. stocks use fiscal quarters offset from normal ones. Walmart, Home Depot, and Cisco have lagging quarters ending one month after calendar ones, so their results here are current to the end of January instead of March. Oracle uses quarters that end one month before calendar ones, so its results are as of the end of February. Offset reporting ought to be banned.
Reporting on offset quarters renders companies’ results way less comparable with the vast majority that report on calendar quarters. We traders all naturally think in calendar-quarter terms too. Decades ago there were valid business reasons to run on offset fiscal quarters. But today’s sophisticated accounting systems that are largely automated running in real-time eliminate all excuses for not reporting normally.
Stocks with symbols highlighted in blue have newly climbed into the ranks of the SPX’s top 34 companies over the past year, as investors bid up their stock prices and thU.S. market caps relative to their peers. Overall the big U.S. stocks’ Q1’19 results looked pretty mixed, with slight sales growth and strong earnings growth. But these growth rates are really slowing, and valuations remain extreme relative to underlying profits.
From the ends of Q1’18 to Q1’19, the S&P 500 rallied 7.3% higher. While solid, that’s not much relative to the extreme euphoria and complacency during this latest earnings season. These stock markets could really be in a massive-triple-top scenario after this record bull run, a menacing bearish omen. The SPX initially peaked at 2872.9 in late January 2018, mere weeks after those record corporate tax cuts went into effect.
Then it quickly plunged 10.2% in 0.4 months, a sharp-yet-shallow-and-short correction. But with overall SPX earnings growth exceeding 20% YoY comparing post-tax-cut quarters to pre-tax-cut ones, this key benchmark clawed back higher and hit 2930.8 in late September 2018. That was merely a 2.0% marginal gain over 7.8 months which saw some of the strongest corporate-profits surges ever from already-high levels.
From there the SPX plummeted 19.8% in 3.1 months in that severe near-bear correction largely in Q4. This trend of slightly-better record highs followed by far-worse selloffs is troubling. By late April 2019 the SPX had stretched to 2945.8, jU.S.t 2.5% above its initial peak 15.1 months earlier. Such paltry gains in a span with record corporate tax cuts and resulting torrid earnings growth should really give traders pause.
Technically these three major record highs look like a massive triple top. The big U.S. stocks’ Q1 results are critical to supporting or refuting this bearish technical picture. The SPX/SPY top 34 did enjoy superior market-cap appreciation from the ends of Q1’18 to Q1’19, averaging 12.8% gains which ran 1.7x those of the entire SPX. That exacerbated the concentration of capital in the largest SPX stocks, the mega-cap techs.
As Q1 ended, 5 of the 6 largest SPX stocks were Microsoft, Apple, Amazon, Alphabet, and Facebook. Together they accounted for a staggering 15.8% of this flagship index’s entire market cap, closing in on 1/6th! These companies are universally adored by investors, owned by the vast majority of all funds and constantly extolled in glowing terms in the financial media. Investors think mega-cap techs can do no wrong.
Last summer these incredible businesses were viewed as recession-proof, effectively impregnable. But even if there’s some truth to that, it doesn’t guarantee mega-cap-tech stock prices will weather a stock-market selloff. During that 19.8% SPX correction mostly in Q4, these 5 dominant SPX stocks and another SPX-top-34 tech darling Netflix averaged ugly 33.3% selloffs! They amplified the SPX’s decline by 1.7x.
No matter how amazing the sales growth among the mega-cap techs, they aren’t only not immune to SPX selloffs but their lofty stock prices make them more vulnerable. Overall the SPX/SPY top 34 companies reported Q1’19 revenues of $969.3b, which was 0.9% YoY higher than the top 34’s in Q1’18. That’s not great performance considering how universally-loved and -owned these companies are among nearly all funds.
Those 6 mega-cap tech stocks did far better, enjoying order-of-magnitude-better revenues growth of 9.9% YoY! Excluding them the rest of the SPX top 34 actually saw total sales slump 1.8% lower YoY, which sure doesn’t sound like a strong economy. If this trend of stalling or slowing revenue growth continues, profits growth will have to start falling sharply in future quarters. Earnings ultimately amplify sales trends.
Even more bearish, Wall Street analysts headed into Q1’19’s earnings season expecting all 500 SPX companies to enjoy 4.7% total revenues growth. But the top 34 that dominate the U.S. stock markets did much worse at 0.9% even with mega-cap techs included. That was definitely a sharp slowdown too, as the SPX top 34 saw 4.2% YoY sales growth in Q4’18. Slowing revenue growth is a real threat to the stock markets.
Remember the SPX surged dramatically in Q1, fueling quite-euphoric sentiment leading into quarter-end. At the same time traders mostly believed that a U.S.-China trade deal would soon be signed, removing the trade-war risks. High tariffs are a serious problem for the gigantic multinational companies leading the SPX, potentially heavily impacting sales. Yet revenue growth was already slowing even before this week!
Trump had twice delayed hiking U.S. tariffs on Chinese imports from 10% to 25%, a good-faith sign giving time for real trade-deal negotiations. But his patience ran out this past Sunday after China backtracked on key previoU.S. commitments. So Trump tweeted the current 10% U.S. tariffs on $200b of annual Chinese imports would surge to 25% today, and warned that 25% tariffs were coming “shortly” on another $325b!
China will retaliate as long as high U.S. tariffs remain in effect. That will really retard U.S. sales from top-34 SPX companies in that country. Beloved market-darling Apple is a great example. This second-biggest stock in the S&P 500 did $10.2b or 17.6% of its Q1’19 sales in China! The U.S.-China trade war heating up in a serious way portends even-weaker revenues going forward for the big U.S. stocks dominating the SPX.
The total operating cash flows generated by the top 34 SPX/SPY companies looked like a disaster in Q1, plummeting 64.4% YoY to $67.8b. Thankfully that is heavily skewed by a couple of the major U.S. banks. JPMorgan Chase and Citigroup reported staggering negative OCFs of $80.9b and $37.6b in Q1, due to colossal $123.1b and $30.4b negative changes in trading assets! This seems really confusing to me.
Mega-bank financials are fantastically-complex, and no one can hope to understand them unless deeply immersed in that world. I’ve been a certified public accountant for decades now, spending vast amounts of time buried in 10-Qs and 10-Ks to fuel my stock trading. Yet even with my background and experience I can’t interpret mega-bank results. It seems weird trading assets plummeted in Q1 as the SPX surged sharply.
But rather than getting bogged down in mega-bank arcania that may be impossible to comprehend by outsiders, we can just exclude the four SPX-top-34 mega-banks from our OCF analysis. They include JPMorgan Chase, Bank of America, Wells Fargo, and Citigroup. Without them, the rest of the SPX top 34 reported total OCFs of $163.2b in Q1’19. That was dead-flat ex-banks, up just 0.3% YoY from Q1’18’s OCFs.
So the big U.S. stocks’ operating-cash-flow generation really slowed too in Q1, stalling out compared to hefty 11.5% YoY growth in Q4’18. That’s another sign that the U.S. economy must be slowing despite the red-hot stock markets. That’s ominous and bearish considering the coming headwinds if the trade wars continue and if the stock markets roll over decisively. Future quarters’ business environments won’t be as good.
Earnings were a different story entirely last quarter, soaring dramatically among the SPX/SPY top 34. They totaled $149.8b, surging an enormous 36.1% YoY! But that was skewed way higher by Warren Buffett’s famous Berkshire Hathaway, the biggest SPX stock after the mega-cap techs. BRK reported a monster Q1 profit of $21.7b, compared to a $1.1b loss a year earlier. That accounted for 1/7th of the top 34’s total.
But Berkshire’s epic profits are due to the sharp stock-market rebound rally, not underlying operations. A new accounting rule that Warren Buffett hates and rails against at every opportunity requires unrealized capital gains and losses to be flushed through quarterly profits. Thus when the SPX plunged in Q4’18, BRK reported a colossal $25.4b GAAP loss. That was largely reversed in Q1’19 with its gigantic $21.7b gain.
Excluding the $16.1b of BRK’s Q1 profits that were mark-to-market stock-price gains, the SPX top 34’s total profits grew 21.5% YoY to $133.6b in Q1. That’s still impressive, but it masks some big problems on the corporate-earnings front. Those 6 elite mega-cap tech companies dominating the SPX actually saw their collective Q1 GAAP profits plunge 11.2% YoY! Apple, Alphabet, and Facebook suffered sharp declines.
Usually mega-cap tech stocks are the profits engine driving the entire SPX higher. If these market-darling companies that are universally-loved and -held struggled with earnings growth in Q1, what does that say about profits going forward? And again profits can be manipulated quarter-to-quarter by playing with all kinds of accounting estimates. So if anything corporate profits are overstated instead of understated.
One of Wall Street’s great farces is the game of comparing quarterly results to expectations instead of what they were in the comparable quarter a year earlier. Mighty Apple is a great example, reporting after the close on April 30th. Its Q1 earnings per share and sales of $2.47 and $58.0b came in ahead of Wall Street expectations of $2.37 and $57.5b. So Apple’s stock surged 4.9% the next day on those “great results”.
But that expectations bar had been lowered dramatically, which is the only reason Apple beat. On an absolute year-over-year basis compared to Q1’18, Q1’19 saw sales drop 5.1%, OCFs plummet 26.3%, and earnings plunge 16.4% YoY! That was quite weak, and couldn’t be considered good by any honest measure. In this recent Q1 earnings season, the fake expectations game obscured plenty of real weakness.
Yet overall SPX-top-34 profits growth still remained strong, with companies suffering drops offset by other companies seeing big jumps. But earnings can’t be considered in isolation, they are only relevant relative to underlying stock prices. Imagine you own a rental house and someone offers you $1000 a month to move in. The reasonableness of that earnings stream is totally dependent on the value of your property.
If your house is worth $100k, $1k a month looks great. But if it’s worth $1m, $1k a month is terrible. The profits anything generates are only measurable relative to the capital invested in that asset. The classic trailing-twelve-month price-to-earnings ratios show how expensive stock prices are relative to underlying corporate profits. Big SPX-top-34 earnings growth isn’t bullish if overall profits are low compared to stock prices.
At the end of Q1’19 proper before these Q1 results were reported, the SPX/SPY top 34 component stocks averaged TTM P/Es of 30.4x. That is definitely improving compared to the prior four quarters’ trend of 46.0x, 53.4x, 49.0x, and 39.7x. But 30.4x is still dangerously high absolutely. Over the past century-and-a-quarter or so, fair value for the U.S. stock markets was 14x. Double that at 28x is where bubble territory begins.
So the big U.S. stocks were literally trading at bubble valuations exiting Q1! Their stock prices were far too high relative to their underlying earnings production compared to almost all of U.S. stock-market history. And this wasn’t just a mega-cap-tech-stock thing, with these elite companies often being bid to really-high valuations compared to other sectors. The 6 mega-cap techs we’ve discussed indeed averaged a crazy 52.0x.
But the other 28 top-34-SPX companies remained very expensive near bubble territory even excluding the tech giants, averaging 25.8x! Even the strong Q1’19 earnings growth didn’t help much. At the end of April as those Q1 results started to work into TTM P/E calculations, the SPX top 34 averaged a slightly-higher P/E of 31.0x. Literal bubble valuations with stock markets trading near all-time record highs are ominous.
Just last Friday when the SPX closed right at its highest levels in history, I wrote a contrarian essay on these “Dangerous Stock Markets”. It explained how high valuations kill bull markets, summoning bears that are necessary to maul stock prices sideways to lower long enough for profits to catch up with lofty stock prices. These fearsome beasts are nothing to be trifled with, yet complacent traders mock them.
The SPX’s last couple bears that awoke and ravaged due to high valuations pummeled the SPX 49.1% lower in 2.6 years leading into October 2002, and 56.8% lower over 1.4 years leading into March 2009! Seeing big U.S. stocks’ prices cut in half or worse is common and expected in major bear markets. And there’s a decent chance the current bubble valuations in U.S. stock markets will soon look even more extreme.
Over the past several calendar years, earnings growth among all 500 SPX companies ran 9.3%, 16.2%, and 20.5%. This year even Wall Street analysts expect it to be flat at best. And if corporate revenues actually start shrinking due to mounting trade wars or rolling-over stock markets damaging confidence and spending, profits will amplify that downside. Declining SPX profits will proportionally boost valuations.
If the big U.S. stocks’ fundamentals deteriorate, the overdue bear reckoning after this monster bull is even more certain. Cash is king in bear markets, since its buying power grows. Investors who hold cash during a 50% bear market can double their holdings at the bottom by buying back their stocks at half-price. But cash doesn’t appreciate in value like gold, which actually grows wealth during major stock-market bears.
Gold investment demand surges as stock markets weaken, as we got a taste of in December. While the SPX plunged 9.2%, gold rallied 4.9% as investors flocked back. The gold miners’ stocks which leverage gold’s gains fared even better, with their leading index surging 10.7% higher. The last time a major SPX selloff awakened gold in the first half of 2016, it soared 30% higher fueling a massive 182% gold-stock upleg!
Absolutely essential in bear markets is cultivating excellent contrarian intelligence sources. That’s our specialty at Zeal. After decades studying the markets and trading, we really walk the contrarian walk. We buy low when few others will, so we can later sell high when few others can. While Wall Street will deny this coming stock-market bear all the way down, we will help you both understand it and prosper during it.
We’ve long published acclaimed weekly and monthly newsletters for speculators and investors. They draw on my vast experience, knowledge, wisdom, and ongoing research to explain what’s going on in the markets, why, and how to trade them with specific stocks. As of Q1 we’ve recommended and realized 1089 newsletter stock trades since 2001, averaging annualized realized gains of +15.8%! That’s nearly double the long-term stock-market average. Subscribe today for just $12 per issue!
The bottom line is the big U.S. stocks’ Q1’19 results were pretty mixed despite the surging stock markets. Revenues and operating cash flows only grew slightly, which were sharp slowdowns from big surges in previous quarters. While earnings somehow defied sales to soar dramatically again, that disconnect can’t persist. A slowdown looked to be underway even before the U.S.-China trade war flared much hotter this week.
Even the surging corporate profits weren’t enough to rescue super-expensive stock markets from extreme bubble valuations. They are what spawn major bear markets, which are necessary to maul stock prices long enough for valuations to mean revert lower. Make no mistake, these overvalued stock markets are still an accident waiting to happen. Stock investors should diversify, adding substantial gold allocations.
Adam Hamilton, CPA
May 15, 2019
Copyright 2000 – 2019 Zeal LLC (www.ZealLLC.com)
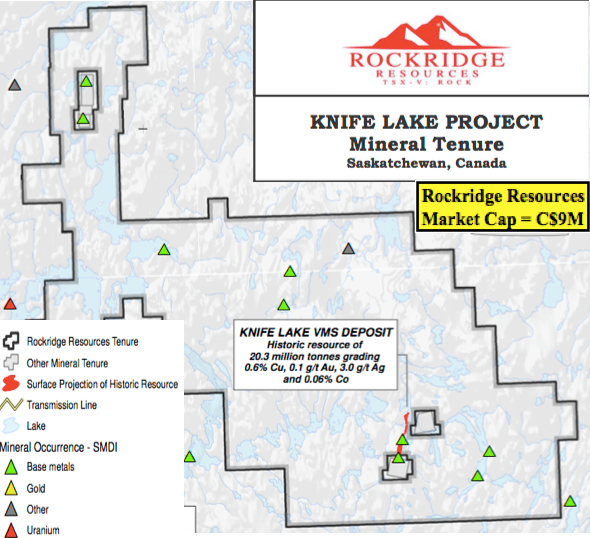
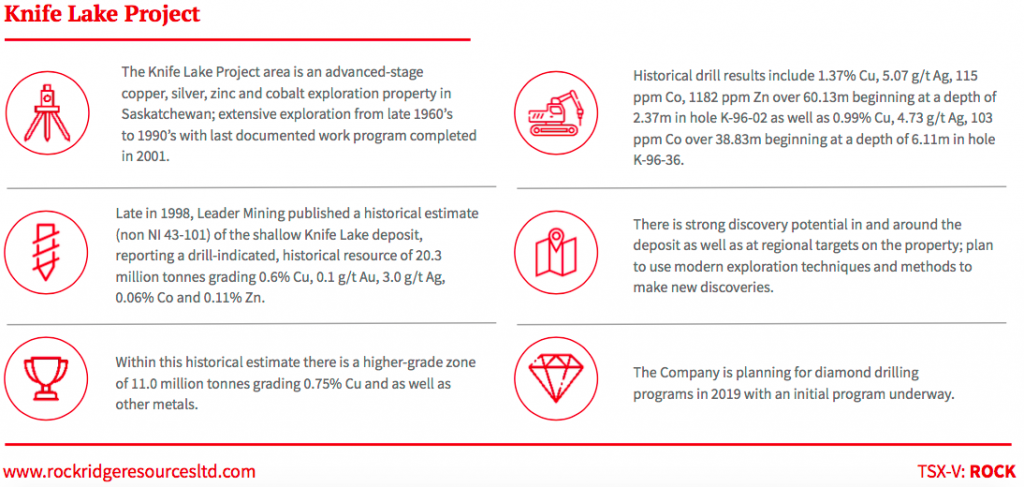
Rockridge Resources (TSX-V: ROCK) is a fairly new mineral exploration company focused on the acquisition, exploration & development of mineral resource properties in Canada. Its focus is copper & base metals. More specifically, base, green energy & battery metals, of which copper is all three! Not just any place in Canada, world-class mining jurisdictions such as Saskatchewan. And, not just good jurisdictions, but in mining camps with significant past exploration, development or production, in close proximity to key mining infrastructure.
The company’s flagship project Knife Lake is in Saskatchewan, Canada, (ranked 3rd best mining jurisdiction in the world) in the Fraser Institute Mining Company Survey. The Project hosts the Knife Lake deposit, a near-surface, (high-grade copper) VMS copper-cobalt-gold-silver-zinc deposit open along strike and at depth. Management believes there’s strong discovery potential in and around the deposit area, and at additional targets on ~85,000 hectares of contiguous claims.
On May 7, Rockridge reported additional results from its Winter diamond drill program at its flagship Knife Lake project in Saskatchewan. Hot on the heels of last week’s press release (April 30th) of 2 holes, comes 3 more. I was planning on writing an article on those excellent results, but Equity.Guru beat me to the punch, putting out this well done piece. Readers following along may recall that the key takeaway was that holes KF19001 & KF19002 largely confirmed historical grades, intercept widths & geological conditions. Fast forward to May 7th, and management’s interpretation of drill holes KF19003, KF19004 & KF19005 was announced. Results on the remaining 7 holes will be released over the next 20-30 days. As a reminder, Rockridge has an option agreement with Eagle Plains Resources to acquire a 100% Interest in the majority of the Knife Lake Cu-Zn-Ag-Au-Co VMS deposit.
Earlier this year, Rockridge drilled 12 holes for a total of 1,053 meters. Importantly, this represents the first work on the property since 2001. Readers may recall from reading past articles & interviews on Epstein Research and Equity.Guru and viewing videos of CEO Trimble, that the company’s primary goal is to explore districts that have been under-explored, never explored, or not recently explored. Management’s highly skilled and experienced technical team & advisors deploy the latest exploration technologies & methods. A lot has changed in 18 years; a simple example would be the use of drones to fly various surveys.
Whatever management is doing seems to be working, as evidenced by 2 of the first 5 holes returning very strong results, and the third hole, KF19003 a true blockbuster.
Hole KF19003 was even better than the first 2 holes. In fact, significantly better, with a grade (Cu Eq.) x thickness (in meters) value of 91, compared to 41 & 49. Make no mistake, KF19001 / 19002 were great, they averaged 1.21 Cu Eq. over an average 38.5m. But, KF19003, WAS something to write home about…. [if under the age of 30, Google the idiom, “nothing to write home about“]. Near-surface like the first 2 holes, the 37.6m interval assayed 2% Cu, 0.2 g/t Au, 9.9 g/t Ag, 0.36% Zn & 0.01% Co, for an estimated 2.42% Cu Eq. grade. 2% Cu over 37.6 meters is a tremendous showing at under 41 meters downhole.
Holes KF19004 & KF19005 were mineralized, but had narrower intercept widths of interest. Still, there were attractive Cu Eq. grades (1.25% & 1.20%, respectively). Interestingly, Gallium (up to 25.6 ppm) & Indium (up to 15.2 ppm) values were found in the mineralized zones of all 3 holes. Those 2 Rare Earth Metals trade at an average of about US$300/kg. Each 10 ppm = 1kg/tonne. KF19004 & KF19005 confirmed mineralization up-dip of historically drilled high grade mineralization. So, those 2 holes were like KF19001 & KF19002, important in building the potential resource size. All activities are advancing the Project toward a NI 43-101 compliant mineral resource estimate later this year.
Perhaps best of all, drill hole KF19003 confirmed high-grade mineralization up-dip of KF19002 in an area where no historical drilling is known to have been done. Therefore, this assay, and perhaps nearby assays to follow, will increase the size & grade of the upcoming mineral resource estimate. There were also encouraging zinc values, incl. 4m (from the 37.6m) of 1.32% Zn, nearly C$50/tonne rock. Gold values up to 0.63 g/t are interesting, but like the zinc, I’m referring to only the best grades, from smaller intercepts. That 4m interval I mentioned also had 7.54% Cu. This is clearly a COPPER deposit, Knife Lake is a near-surface, high-grade Cu project. See drill hole results from KF19001 – KF19005 below. Holes KF19001 & KF19002 were released on April 30, and KF19003-KF19005 on May 7.
Rockridge’s President & CEO, Jordan Trimble commented: “The results from drill hole KF19003, specifically 2.42% Cu Eq. over 37.6m, far exceeded our expectations and represents one of the best holes ever drilled on the project. It is important to note that this drill hole was collared in an area where no historical drilling has been reported. As such these drill results are expected to have a positive impact on the historical resource. Final results from the remaining 7 drill holes are pending and will provide steady news flow over the near term.”
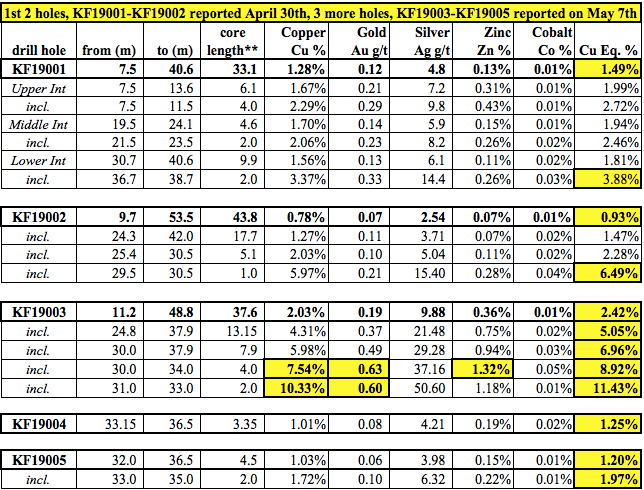
Drill indicated intercepts (core length) are reported as drilled widths and true thickness is undetermined. {details about calculation of Cu Eq. grade can be found in the press release}.{details about calculation of Cu Eq. grade can be found in the press release}.
From the press release, “The Knife Lake area saw extensive exploration from the late 1960s to the 1990s with the last documented work program completed in 2001. Between 1996 & 1998, Leader Mining completed 315 diamond drill holes, outlining a broad zone of mineralization occurring at a depth of less than 100 m. Late in 1998, Leader published an historical estimate, reporting a, “drill-indicated” resource of 20.3 M tonnes, grading 0.6% Cu, 0.1 g/t Au, 3 g/t Ag, 0.06% Co & 0.11% Zn. Within the historical estimate there is a higher grade zone containing 11.0 M tonnes of 0.75% Cu, plus other metals.”
NOTE: These mineral resource estimates are not supported by a compliant NI 43-101 technical report. A qualified person has not done the work to classify these estimates as current mineral resources in accordance with NI 43-101 standards. Furthermore, the categories used for these historical resource estimates are described as, “drill-indicated”. This is not a NI 43-101 resource category, but based on the methodologies & drill hole spacing, management believes it would likely be classified as Inferred.
The Project is within the word famous Flin Flon-Snow Lake mining district that contains a prolific VMS base metals belt. Management paid < half a penny/lb. of copper and they believe there’s tremendous exploration upside. The goal? High-grade discoveries in a mineralized belt that could host multiple deposits, as VMS-style zones often contain clusters of mineralized zones. Of course, the trick is finding them. No modern exploration, drilling or technology has been deployed at Knife Lake. It was discovered 50 years ago and last explored in the 1990s. Airborne geophysics, regional mapping & geochemistry was done. Management believes that modern geophysics; high resolution, deep penetrating EM & drone mag surveys to cover large areas in detail, could make a big difference.
The deposit remains open at depth. Additional discoveries are very possible as the property is > 85,000 hectares in size. The winter drill program marks the end of the beginning of this highly prospective project. Importantly, the program gives the company’s technical team valuable information about geology, alteration & mineralization that will be applied to regional exploration targets. According to the press release, most of the historical work was shallow drilling in and around the deposit area. Very little regional or district work has been documented. In fact, there wasn’t even much drilling done below the deposit. That’s why management is optimistic about discovery potential both at depth and regionally. I’m excited to see what the next 7 assays add to the Rockridge Resources (TSX-V: ROCK) story!
Peter Epstein
May 9, 2019
Disclosures: The content of this article is for information only. Readers fully understand and agree that nothing contained herein, written by Peter Epstein about Rockridge Resources, including but not limited to, commentary, opinions, views, assumptions, reported facts, calculations, etc. is to be considered implicit or explicit investment advice. Nothing contained herein is a recommendation or solicitation to buy or sell any security. [ER] is not responsible under any circumstances for investment actions taken by the reader. [ER] has never been, and is not currently, a registered or licensed financial advisor or broker/dealer, investment advisor, stockbroker, trader, money manager, compliance or legal officer, and does not perform market making activities. [ER] is not directly employed by any company, group, organization, party or person. The shares of Rockridge Resources are highly speculative, not suitable for all investors. Readers understand and agree that investments in small cap stocks can result in a 100% loss of invested funds. It is assumed and agreed upon by readers that they will consult with their own licensed or registered financial advisors before making any investment decisions.
At the time this article was posted, Peter Epstein owned stock in Rockridge Resources and the Company was an advertiser on [ER]. Readers understand and agree that they must conduct their own due diligence above and beyond reading this article. While the author believes he’s diligent in screening out companies that, for any reasons whatsoever, are unattractive investment opportunities, he cannot guarantee that his efforts will (or have been) successful. [ER] is not responsible for any perceived, or actual, errors including, but not limited to, commentary, opinions, views, assumptions, reported facts & financial calculations, or for the completeness of this article or future content. [ER] is not expected or required to subsequently follow or cover events & news, or write about any particular company or topic. [ER] is not an expert in any company, industry sector or investment topic.
These record U.S. stock-market levels are very dangerous, riddled with extreme levels of euphoria and complacency. Largely thanks to the Fed, traders are convinced stocks can rally indefinitely. But stock prices are very expensive relative to underlying corporate earnings, with valuations back up near bubble levels. These are classic topping signs, with profits growth stalling and the Fed out of easy dovish ammunition.
Stock markets are forever cyclical, meandering in an endless series of bulls and bears. The latter phase of these cycles is inevitable, like winter following summer. Traders grow too excited in bull markets, and bid up stock prices far higher than their fundamentals support. Subsequent bear markets are necessary to eradicate unsustainable valuation excesses, forcing stock prices sideways to lower until profits catch up.
This latest bull market grew into a raging monster largely fueled by extreme Fed easing. At its latest all-time record peak hit just this week, the flagship US S&P 500 broad-market stock index (SPX) has soared 335.4% higher over 10.1 years! That makes for the second-biggest and first-longest bull in US history, only possible because it gorged on $3625b of quantitative-easing money printing by the Fed over 6.7 years.
That epic 5.3x mushrooming of the Fed’s balance sheet peaked in February 2015, when the SPX was just clawing over 2100. It soon coasted to a 2130.8 topping in May 2015, before trading sideways to lower for 13.7 months without Fed QE. Modest new highs weren’t seen until July 2016, after the U.K.’s Brexit-vote surprise kindled hopes for more central-bank easing. Another surprise event drove the final third of this bull.
The November 2016 elections were a Republican sweep, with Trump winning the presidency while his party controlled both chambers of Congress. So the SPX started surging to new record highs, initially on hopes for big tax cuts soon and later on record corporate tax cuts becoming law. That ultimately propelled the SPX to 2872.9 in late January 2018 and 2930.8 in late September 2018, lofty new all-time record highs.
But paraphrasing an ancient Biblical passage from Job, the Fed gave then the Fed took away. Right after the SPX peaked, the Fed ramped its year-old quantitative-tightening campaign to full speed in Q4’18. QT was supposed to unwind a large fraction of that $3625b of QE-conjured money, shrinking the Fed’s crazy-bloated balance sheet. $50b per month of QT monetary destruction had to be this QE-fueled bull’s death knell!
Indeed the stock markets crumbled under that Fed-tightening onslaught, plunging 19.8% over the next 3.1 months into late December 2018. That severe correction was right on the verge of crossing the -20% threshold into new-bear territory. Over a third of those serious losses happened in just 4 trading days after the Fed chairman declared full-speed QT was “on automatic pilot”. By that time the SPX was very oversold.
Stock-market extremes never last long, with big and sharp mean-reversion bounces following major selloffs. The SPX reversed hard and soared into early 2019, already 12.3% higher by late January. Then the Fed’s first policy decision after that stock-crushing QT-autopilot one saw this central bank completely cave to the stock markets. It removed references to further rate hikes and declared it was ready to adjust QT.
That dovishness unleashed more waves of momentum buying. By the eve of the Fed’s next meeting in mid-March, the SPX had rocketed 20.5% above its severe-correction near-bear low. But that wasn’t good enough for the Fed, which slashed its future-rate-hike outlook while declaring it would essentially stop QT by September 2019. That is very premature, implying less than 23% of the Fed’s total QE will be unwound!
That goosed the stock markets again, helping push the SPX to an enormous 25.3% rebound-rally gain by this week. At 2945.8, it had edged 0.5% above late September’s then-record peak. With stock markets more than regaining their big losses, euphoria and complacency exploded again. These herd emotions have proven dangerous in market history, marking major toppings including terminal bulls rolling over to bears.
Euphoria is simply “a strong feeling of happiness, confidence, or well-being”. It is always accompanied by complacency, which is “a feeling of contentment or self-satisfaction, especially when coupled with an unawareness of danger or trouble”. This perfectly describes the stock markets’ sentiment-scape in recent months. Speculators and investors just love these lofty stock prices, with virtually no fear of material selloffs.
While euphoria and complacency are ethereal and unmeasurable, they can be inferred. The classic VIX fear gauge is the most-popular way. It quantifies the implied volatility options traders expect in the SPX over the next month, as expressed through their collective trades. While a high VIX reveals fear, a low one shows the direct opposite which is complacency. In mid-April the VIX revisited ominous bull-slaying levels.
This chart superimposes the SPX over its VIX sentiment indicator over the past several years or so. This monster Fed-QE-fueled stock bull sure looks to be carving a massive triple top in its terminal phase. At best in late April, the SPX had merely clawed back 2.5% over its initial peak of late January 2018. That’s terrible progress across 15.1 months where the biggest corporate tax cuts in US history greatly boosted profits.
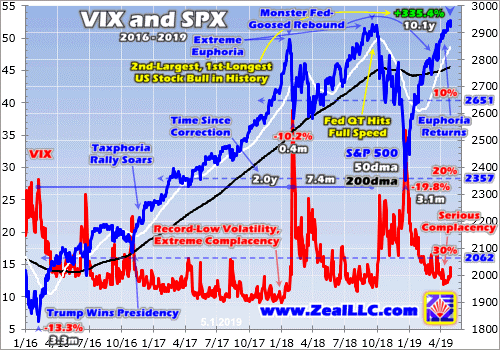
While the first two-thirds of this monster bull were directly driven by the Fed’s extreme QE, the final third was corporate-tax-cut driven. Starting with that November 2016 Republican sweep, there was enormous anticipation of what eventually became the Tax Cuts and Jobs Act. Signed into law in December 2017, it went into effect as 2018 dawned. Its centerpiece was slashing the US corporate tax rate from 35% to 21%.
The SPX surged 19.4% in 2017 in the thrall of taxphoria hopes, driving 62 new record-high closes out of 251 trading days! The first 18 trading days of 2018 saw another 14 more, catapulting both euphoria and complacency off the charts. The VIX slumped into the 9s early that peaking month, proving that fear was nonexistent. Virtually no one expected a selloff when the SPX peaked at 2872.9, when the VIX closed at 11.1.
But just when traders were convinced stock markets could rally indefinitely with no material selloffs, the SPX suddenly nosed over into its first correction in 2.0 years. While sharp yet shallow and short at a 10.2% loss in just 0.4 months, it was a warning shot. Even with elite SPX companies’ corporate profits expected to soar 20%+ that year due to those big tax cuts, stock markets were already too high to rally much.
After that minor flash correction, the SPX started marching higher again throughout 2018. It wasn’t able to eclipse January’s maiden peak until late August, and ultimately crested merely 2.0% above it in late September. Such meager gains again suggested the corporate tax cuts were nearly fully priced in during 2017, leaving little room for additional gains. The day the SPX peaked at 2930.8, the VIX closed at 11.8.
Once again traders’ euphoria and complacency were extreme. The pressure on contrarians to capitulate was immense. But given the extreme stock-market technicals, sentiment, and valuations, I stuck to my guns warning how dangerous the stock markets were. Just a week after that all-time record high in the SPX, I published an essay warning “Fed QT is Bull’s Death Knell” one trading day before QT hit terminal velocity.
Indeed the stock markets fell hard, plunging 19.8% over 3.1 months into late December! That correction was much larger and more menacing than early 2018’s, on the edge of formal bear-market territory. And it happened despite SPX companies’ earnings actually blasting 20.5% higher year-over-year in 2018. Two corrections, including a serious one, in one of the best corporate-profits years on record should give pause.
The stock markets were due for a sharp mean-reversion rebound higher after such a steep drop. But the Fed waxing hyper-dovish and killing both its rate-hike cycle and QT really artificially extended it. Just over half the total rebound rally came after the Fed utterly surrendered to stock traders starting in late January. Many larger SPX-rally days clustered around dovish Fed announcements, they really amplified this rally.
It looked and felt exactly like a bear-market rally, the biggest and fastest ever witnessed in stock markets. The SPX soared in a symmetrical V-bounce out of late December’s deep lows. Those gains were front-loaded, fast initially but fading in recent months despite the Fed’s super-dovish jawboning. That severe near-bear correction that spawned this rally also fit the definition of a waterfall decline, an ominous omen.
They are 15%+ SPX selloffs without any interrupting countertrend rallies exceeding 5%. Since 1946 this had happened only 19 previous times. After every single past selloff, 100% of the time, the SPX retested its waterfall-decline lows! All 19 happened in bear markets. After these retests, fully 15 of the 19 were followed by new lower lows as those bears deepened. Only 4 of the 19 waterfall retests climaxed their bears.
So market history is crystal-clear in warning that the wild stock-market action of the past 7.3 months is exceedingly dangerous technically. Yet euphoria and complacency still exploded again in March and April as the SPX kept stretching skywards. By mid-April as the SPX clawed back up to 2907.4, the VIX fell back under 12.0 on close. Those were the lowest levels of fear seen since October 3rd, a bearish portent.
While that was a couple weeks after the SPX’s late-September then-record peak, this leading stock index was still just 0.2% lower. The selling that would grow into the severe near-bear correction began the very next day, and snowballed from there. Right when traders again delude themselves into believing stock markets can rally indefinitely, the hard reality of market cycles slams them like a sledgehammer to the skull.
Extreme levels of euphoria and complacency are always very dangerous, presaging major stock-market selloffs. Low VIX levels following record or near-record stock-market highs should not be trifled with, but considered a dire warning of serious downside risks. Very-high technicals breed very-lopsided sentiment, blinding traders to markets’ perpetual cyclicality. Today’s risks are compounded by near-bubble valuations.
For a century-and-a-quarter or so before the Fed’s insane QE experiment starting in late 2008, the US stock markets had averaged trailing-twelve-month price-to-earnings ratios around 14x earnings. That is considered fair-value, which makes sense. The reciprocal of 14x is 7.1%, which is a fair rate for both investors to earn to let companies use their saved capital and for companies to pay to use those same funds.
But valuations oscillate well above and below fair value in great waves that correspond with bull and bear markets. In bulls stocks are enthusiastically bid to high valuations not justified by their underlying profits. Valuation extremes start at twice fair value, 28x trailing earnings which is formally bubble territory. That necessitates bears to maul stock prices long enough for earnings to catch up, but stocks usually overshoot.
While major bull markets end above 28x, major bear markets often end between 7x to 10x. That’s the time investors should throw all their capital at the stock markets, when stocks are dirt-cheap and deeply out of favor. But instead they foolishly buy high near bull-market tops, which often leads to selling low later at catastrophic losses. The SPX valuations during this 15-month triple-top span have been scary-high.
This next chart shows the actual SPX in red, superimposed over the average trailing-twelve-month price-to-earnings ratios of its 500 elite companies. Their simple average at the end of every month is shown in light blue, and is what I’m using in this essay. The dark-blue line instead weights SPX-component P/Es by their companies’ market capitalizations. The white line shows where the SPX would be at 14x fair-value.
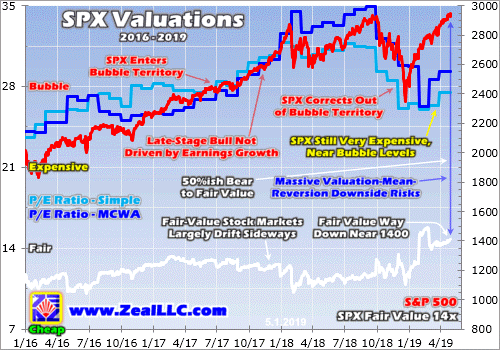
Remember the final third of this monster bull erupted on taxphoria after Trump won the presidency. But following trillions of dollars of QE before that, the SPX wasn’t cheap heading into November 2016. These elite stocks averaged TTM P/Es of 26.3x, just shy of 28x bubble territory. Interestingly that was about the same valuation as the 25.9x when QE ended in February 2015. Stocks had long been very expensive.
SPX corporate earnings did rise nicely in 2017, up about 16%. Republicans streamlining regulations was a factor, but more important was the widespread optimism from stock markets surging to endless new record highs. But the problem was stocks were already so overvalued that higher profits barely made a dent. At best that year the fair-value SPX at 14x hit 1296.0, a staggering 52% below the SPX’s 2017 high!
The SPX first crossed that 28x bubble threshold in late November 2016 after stocks surged higher on that Republican sweep. Valuations hung around 28x until July 2017 when they started climbing even higher. By late January 2018 just after the SPX’s initial peak, its elite companies were averaging TTM P/Es way up at 31.8x! While bubble valuations can persist while euphoria lasts, they are very dangerous for stocks.
SPX corporate-earnings growth in 2018 was amazing, exceeding 20% year-over-year thanks to those record corporate tax cuts. The four quarters of 2018 were the only ones comparing post-tax-cut and pre-tax-cut profits, an enormous one-off discontinuity. Yet damningly the valuations still didn’t retreat, in late September just after the SPX’s record peak its components were still averaging extreme 31.4x TTM P/Es.
That severe near-bear correction largely in Q4 last year certainly helped, dragging valuations back down out of bubble territory. But even at the end of December just after the lows, the SPX was still sporting a 26.1x valuation. That was near bubble territory, right around the levels just before Trump was elected. No bear market would end its predations and start hibernating while valuations remained so darned high!
In recent months many Wall Street apologists have claimed that severe correction was effectively a very-short-lived bear market since it was so close to 20% on a closing basis. They argue that means a new bull is underway that can run for years more. But bears don’t give up their ghosts after a single selloff with price-to-earnings ratios still near bubble levels. Bears ravage until valuations are mauled back under 14x.
Interestingly valuations haven’t soared back up with the massive rebound rally so far this year. By the end of April, the SPX components’ average P/E had only returned to 27.5x. That’s not greatly above the late-December levels. This was due to blowout Q4’18 earnings from SPX companies, the last quarter with profits compared across the Tax Cuts and Jobs Act. Q4’17 also rolled off, which the TCJA heavily distorted.
But 27.5x is still just under bubble territory, dangerously-expensive levels for stocks achieving record highs again. If the inevitable bear following the past decade’s enormous Fed-inflated monster bull just pushed stocks back down to 14x fair value, the SPX would have to plunge way back near 1400. That’s a heck of a long ways down from here, a 52% drop. Cutting stocks in half is right in line with bear-market precedent.
The SPX’s last bear market ran from October 2007 to March 2009, and pummeled this leading American stock index a gut-wrenching 56.8% lower in 1.4 years. That bear-market bottom birthed this current bull, when the SPX traded down to 12.6x earnings. Before that the SPX suffered another bear from March 2000 to October 2002, a 49.1% drop over 2.6 years. So 50%ish SPX losses are par for the course in bears!
Several factors could make this long-overdue next bear even worse. In 2016, 2017, and 2018, the elite SPX companies’ profits grew 9.3%, 16.2%, and 20.5% YoY. This year even Wall Street is forecasting earnings to be flat at best. There’s a real possibility they will even contract in 2019, the first year comparing post-tax-cut quarters. Stalling or shrinking corporate profits make near-bubble valuations even more extreme.
Lower profits actually push valuations even higher, increasing the valuation pressure for a major bear market. And with average month-end SPX TTM P/Es running 30.5x in 2018 at 20% profits growth, there’s no way similar high valuations will fly this year with zero profits growth. The more quarterly earnings fail to climb, the more worried traders will get over high stock prices and the more likely they will start selling.
And after the second-largest and first-longest bull market in US stock-market history, mostly driven by extreme Fed easing no less, the subsequent bear should be proportionally massive. There’s a fairly-high chance this bear won’t stop brutalizing stocks until the average SPX P/E falls near half fair-value around 7x earnings. That’s where the biggest bears in the past have ended, valuations overshot way under 14x.
Finally the Fed is going to have a hard time riding to the rescue again since it has expended all its easy dovish ammunition. It really only has three options left for another dovish surprise, and the latter two are very serious decisions. Top Fed officials’ outlook for rates in their collective dot-plot forecast can still be lowered to show cuts coming. But since these guys downplay the dot plot, that won’t mollify traders for long.
That leaves actually cutting rates or birthing QE4, which are huge course changes that the Fed can’t take lightly or revoke without panicking stock markets! With the Fed just about out of dovish rabbits to pull out of its hat, it doesn’t have many options to slow the selling when stock markets inevitably turn south again. Cutting rates or restarting QE may even exacerbate any selloff, worrying traders about what so scared the Fed.
The overdue bear market is still coming, make no mistake. Extreme technicals, sentiment, and valuations assure it. Investors really need to lighten up on their stock-heavy portfolios, and protect themselves with cash and gold. Holding cash through a 50% bear market allows investors to buy back their stocks at half-price, doubling their holdings. But unlike cash gold actually appreciates in value during bears, growing weath.
Gold investment demand surges as stock markets weaken, as we got a taste of in December. While the SPX plunged 9.2%, gold rallied 4.9% as investors flocked back. The gold miners’ stocks which leverage gold’s gains fared even better, with their leading index surging 10.7% higher. The last time a major SPX selloff awakened gold in the first half of 2016, it soared 30% higher fueling a massive 182% gold-stock upleg!
Absolutely essential in bear markets is cultivating excellent contrarian intelligence sources. That’s our specialty at Zeal. After decades studying the markets and trading, we really walk the contrarian walk. We buy low when few others will, so we can later sell high when few others can. While Wall Street will deny this coming stock-market bear all the way down, we will help you both understand it and prosper during it.
We’ve long published acclaimed weekly and monthly newsletters for speculators and investors. They draw on my vast experience, knowledge, wisdom, and ongoing research to explain what’s going on in the markets, why, and how to trade them with specific stocks. As of Q1 we’ve recommended and realized 1089 newsletter stock trades since 2001, averaging annualized realized gains of +15.8%! That’s nearly double the long-term stock-market average. Subscribe today for just $12 per issue!
The bottom line is these stock markets are very dangerous. A monster bull has been topping over the past year-and-quarter, leading to extreme technicals, sentiment, and valuations. Traders’ euphoria and complacency have been running at bull-slaying levels, while valuations remain way up near perilous bubble territory. All this is happening as corporate profits flatline after surging dramatically on the corporate tax cuts.
Like after every past waterfall decline, the stock markets are due to roll over and retest their deep late-December lows. Odds are they will fail, confirming a major new bear market. And the Fed doesn’t have much dovish ammunition left to retard the heavy selling. Gold investment demand will surge as stocks finally face their reckoning after this artificially-amplified bull. That will push gold and its miners’ stocks far higher.
Adam Hamilton, CPA
May 6, 2019
Copyright 2000 – 2019 Zeal LLC (www.ZealLLC.com)
The major silver miners have rallied higher on balance in recent months, enjoying a young upleg. That’s a welcome change after they suffered a miserable 2018. Times are tough for silver miners, since silver’s prices have languished near extreme lows relative to gold. That has forced many traditional silver miners to increasingly diversify into gold. The major silver miners’ recently-released Q4’18 results illuminate their struggles.
Four times a year publicly-traded companies release treasure troves of valuable information in the form of quarterly reports. Required by the U.S. Securities and Exchange Commission, these 10-Qs and 10-Ks contain the best fundamental data available to traders. They dispel all the sentiment distortions inevitably surrounding prevailing stock-price levels, revealing corporations’ underlying hard fundamental realities.
While 10-Qs with filing deadlines of 40 days after quarter-ends are required for normal quarters, 10-K annual reports are instead mandated after quarters ending fiscal years. Most silver miners logically run their accounting on calendar years, so they issue 10-Ks after Q4s. Since these annual reports are larger and must be audited by independent CPAs, their filing deadlines are extended to 60 days after quarter-ends.
The definitive list of major silver-mining stocks to analyze comes from the world’s most-popular silver-stock investment vehicle, the SIL Global X Silver Miners ETF. Launched way back in April 2010, it has maintained a big first-mover advantage. SIL’s net assets were running $362m in mid-March near the end of Q4’s earnings season, 6.1x greater than its next-biggest competitor’s. SIL is the leading silver-stock benchmark.
In mid-March SIL included 21 component stocks, which are weighted somewhat proportionally to their market capitalizations. This list includes the world’s largest silver miners, including the biggest primary ones. Every quarter I dive into the latest operating and financial results from SIL’s top 17 companies. That’s simply an arbitrary number that fits neatly into the table below, but still a commanding sample.
As of mid-March these major silver miners accounted for fully 97.7% of SIL’s total weighting. In Q4’18 they collectively mined 75.5m ounces of silver. The latest comprehensive data available for global silver supply and demand came from the Silver Institute in April 2018. That covered 2017, when world silver mine production totaled 852.1m ounces. That equates to a run rate around 213.0m ounces per quarter.
Assuming that mining pace persisted to Q4’18, SIL’s top 17 silver miners were responsible for about 35% of world production. That’s relatively high considering just 28% of 2017’s global silver output came from primary silver mines! 36% came from lead/zinc mines, 23% from copper, and 12% from gold. 7/10ths of all silver produced is merely an other-metals-mining byproduct. Primary silver mines and miners are fairly rare.
Scarce silver-heavy deposits are required to support primary silver mines, where over half their revenue comes from silver. They are increasingly difficult to discover and ever-more expensive to develop. And silver’s challenging economics of recent years argue against miners even pursuing it. So even traditional major silver miners have shifted their investment focus into actively diversifying into far-more-profitable gold.
Silver price levels are best measured relative to prevailing gold prices, which overwhelmingly drive silver price action. Q4’18 saw the worst Silver/Gold Ratio witnessed in nearly a quarter century! The SGR collapsed to 86.3x in late November, an extreme 23.8-year secular low. The raw silver price fell under $14 in mid-November, a major 2.8-year low. With such a rotten silver environment, silver miners had to struggle.
The largest primary silver miners dominating SIL’s ranks are scattered around the world. 11 of the top 17 mainly trade in US stock markets, 3 in the United Kingdom, and 1 each in South Korea, Mexico, and Peru. SIL’s geopolitical diversity is good for investors, but makes it difficult to analyze and compare the biggest silver miners’ results. Financial-reporting requirements vary considerably from country to country.
In the U.K., companies report in half-year increments instead of quarterly. Some silver miners still publish quarterly updates, but their data is limited. In cases where half-year data is all that was made available, I split it in half for a Q4 approximation. Canada has quarterly reporting, but the deadlines are looser than in the States. Some Canadian miners trading in the U.S. really drag their feet in getting quarterly results out.
The big silver companies in South Korea, Mexico, and Peru present other problems. Their reporting is naturally done in their own languages, which I can’t read. Some release limited information in English, but even those translations can be difficult to interpret due to differing accounting standards and focuses. It’s definitely challenging bringing all the quarterly data together for the diverse SIL-top-17 silver miners.
But analyzing them in the aggregate is essential to understand how they are faring. So each quarter I wade through all available operational and financial reports and dump the data into a big spreadsheet for analysis. Some highlights make it into this table. Blank fields mean a company hadn’t reported that data by mid-March, as Q4’s earnings season wound down. Some of SIL’s components report in gold-centric terms.
The first couple columns of this table show each SIL component’s symbol and weighting within this ETF as of mid-March. While most of these stocks trade on US exchanges, some symbols are listings from companies’ primary foreign stock exchanges. That’s followed by each miner’s Q4’18 silver production in ounces, along with its absolute year-over-year change. Next comes this same quarter’s gold production.
Nearly all the major silver miners in SIL also produce significant-to-large amounts of gold! That’s truly a double-edged sword. While gold really stabilizes and boosts silver miners’ cash flows, it also retards their stocks’ sensitivity to silver itself. So the next column reveals how pure these elite silver miners are, approximating their percentages of Q4’18 revenues actually derived from silver. This is calculated one of two ways.
The large majority of these top SIL silver miners reported total Q4 revenues. Quarterly silver production multiplied by silver’s average price in Q4 can be divided by these sales to yield an accurate relative-purity gauge. When Q4 sales weren’t reported, I estimated them by adding silver sales to gold sales based on their production and average quarterly prices. But that’s less optimal, as it ignores any base-metals byproducts.
Next comes the major silver miners’ most-important fundamental data for investors, cash costs and all-in sustaining costs per ounce mined. The latter directly drives profitability which ultimately determines stock prices. These key costs are also followed by YoY changes. Last but not least the annual changes are shown in operating cash flows generated and hard GAAP earnings, with a couple exceptions necessary.
Percentage changes aren’t relevant or meaningful if data shifted from positive to negative or vice versa, or if derived from two negative numbers. So in those cases I included raw underlying data rather than weird or misleading percentage changes. This whole dataset together offers a fantastic high-level read on how the major silver miners are faring fundamentally as an industry. They definitely struggled in Q4.
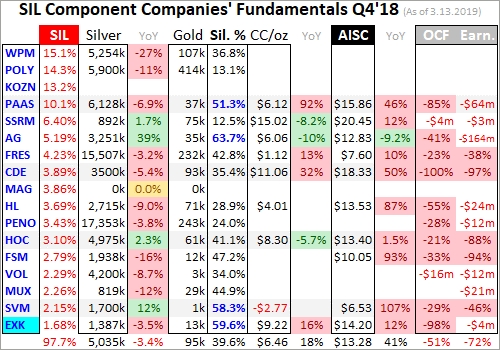
SIL’s performance certainly reflects the challenges of profitably mining silver when its price languishes so darned cheap. In 2018 SIL plunged 23.3%, amplifying silver’s own 8.6% loss by 2.7x. Silver’s weakest prices relative to gold in almost a quarter century wreaked havoc on silver-mining sentiment. Investors didn’t want anything to do with silver miners, and their own managements seemed almost as bearish.
In Q4’18 silver’s average price dropped 12.9% YoY to just $14.53. That was disproportionally worse than gold, which saw its average price decline 3.8% YoY. Such deep lows exacerbated the pall of despair that is plaguing the silver-mining industry. While production decisions aren’t made quarter by quarter, it sure felt like the seriously-weak silver prices were choking off output. Production is the lifeblood of silver miners.
The SIL top 17’s collective silver production fell 3.9% YoY in Q4’18 to 75.5m ounces. Interestingly that’s right in line with what the major gold miners of GDX experienced that quarter, a 4%ish YoY slide when adjusted for mega-mergers. The major silver miners could be experiencing a peak-gold-like decline in their silver production. Peak silver isn’t discussed as much, but world silver mine output has been shrinking.
According to the Silver Institute’s latest annual World Silver Survey current to 2017, world silver mined supply peaked at 895.1m ounces in 2015. It nosed over a slight 0.7% in 2016, but accelerated sharply to another 4.1% drop in 2017. So the SIL top 17’s output contraction in Q4’18 is just continuing this trend. Silver mining has been starved of capital since 2013, when silver plummeted 35.6% on a 27.9% gold collapse!
Silver-mining stocks have been something of a pariah to even contrarian investors for much of the time since then. That’s left their prices largely drifting at relatively-low levels, making it more difficult to obtain financing to expand operations. Investors haven’t been interested in silver-stock shares, leaving miners wary of issuing more to raise capital with stock prices so low. That can really dilute existing shareholders.
With the major silver miners unable or unwilling to invest in developing new silver mines and expansions to offset their depleting output, it has to decline. 11 of the 15 top SIL components reporting Q4’18 silver production mined fewer ounces than in Q4’17. All 15 together averaged silver output shrinkage of 3.4% YoY. That’s a sharp contrast to these same miners’ gold production, which grew an average of 7.9% YoY.
In overall total terms, the SIL top 17’s 1.4m ounces of gold mined in Q4’18 still slipped 1.5% YoY. But with total silver production sliding more than gold, the major silver miners’ long ongoing diversification into the yellow metal continued. At the bombed-out silver prices of recent years, the economics of gold mining are way superior to silver mining. The traditional major silver miners are painfully aware of this and acting on it.
Silver mining is as capital-intensive as gold mining, requiring similar large expenses to plan, permit, and construct new mines, mills, and expansions. It needs similar fleets of heavy excavators and haul trucks to dig and move the silver-bearing ore. Similar levels of employees are necessary to run silver mines. But silver generates much-lower cash flows than gold due its lower price. Silver miners have been forced to adapt.
The major silver miners continued their trend of diversifying into gold at silver’s expense in Q4’18. SIL’s largest component Wheaton Precious Metals was a great example of this. It used to be known as Silver Wheaton, a pure silver-streaming play. Back in May 2017 it changed its name and symbol to reflect the fact it would increasingly diversify into gold. In Q2’17 WPM streamed 7,192k and 80k ounces of silver and gold.
Back then fully 61.9% of WPM’s sales still came from silver, qualifying it as a primary “miner”. Fast-forward to Q4’18 and WPM’s silver output plunged 27.1% YoY to 5,254k ounces! But its gold mined rose 10.5% YoY to 107k ounces. That pushed the implied percentage of WPM’s revenues down to just 36.8% silver, way below the 50% primary threshold. Like it or not, the silver-mining industry is increasingly turning yellow.
This strategic shift is good and bad. The major silver miners’ growing proportion of gold output is helping these companies weather this long dark winter in silver prices. But lower percentages of sales generated from silver leaves their stock prices and SIL less responsive to silver price moves. Silver stocks’ leverage to silver is the main reason investors buy them and their ETFs. Their shift into gold is really degrading that.
In Q4’18 the top 17 SIL silver miners averaged just 39.6% of their sales from silver. Only Pan American Silver, First Majestic Silver, Silvercorp Metals, and Endeavour Silver qualified as primary silver miners with over half their revenues from the white metal. While still low, that 39.6% average of SIL was actually considerably better than Q4’17’s 36.0% despite the ongoing transition into gold. But that’s not a trend shift.
In Q4’17 SIL’s components included Tahoe Resources, which was bought out by Pan American Silver in mid-November. Tahoe owned what was once the world’s largest silver mine, Escobal in Guatemala. It produced 5,700k ounces in Q1’17! But Guatemala’s government shut it down after a frivolous lawsuit by anti-mining activists. I last discussed the whole Tahoe saga in depth in my Q3’18 essay on silver miners’ results.
By Q4’17 Escobal’s production had dropped to zero, leaving Tahoe’s silver purity at 0.0%. That dragged down the SIL top 17’s average, leaving it artificially low. But Pan American buying Tahoe for both its gold production and hopes of convincing Guatemala to allow Escobal to reopen killed Tahoe’s stock and purged it from SIL’s ranks. Endeavour Silver edged into the top 17 to take its place, with 59.6% of sales from silver.
If Tahoe’s silver purity is excluded from Q4’17’s overall calculation while Endeavour is added, SIL would have averaged 39.9%. So in comparable terms Q4’18’s 39.6% remains a declining trend. Primary silver miners continue to get rarer, they may even be a dying breed. That has forced SIL’s managers to really scrape the bottom of the barrel to find components to fill their ETF. That’s what happened with Korea Zinc.
This is no silver miner, but a base-metals smelter! In mid-March it commanded a hefty 13.2% weighting in SIL, over 1/8th the total. I’ve searched and searched, but can’t find English financial reports for this company. But in 2017 it reported smelting 66.2m ounces of silver, a 16.6m quarterly pace. I bet there’s not a single SIL investor looking for base-metals-smelting exposure! Global X really ought to remove it entirely.
The capital allocated to Korea Zinc could be spread across the remaining SIL components proportionally, reallocating and modestly upping their weightings. But the fact Korea Zinc even ever made it into SIL is a testament to how rarified the ranks of major silver miners have become. That won’t reverse unless silver mean reverts dramatically higher relative to gold and remains at much-better price levels for years on end.
With SIL-top-17 silver production sliding 3.9% YoY in Q4’18, the per-ounce mining costs should’ve risen proportionally. Silver-mining costs are largely fixed quarter after quarter, with actual mining requiring the same levels of infrastructure, equipment, and employees. So the lower production, the fewer ounces to spread mining’s big fixed costs across. SIL’s major silver miners indeed reported far-higher costs last quarter.
There are two major ways to measure silver-mining costs, classic cash costs per ounce and the superior all-in sustaining costs. Both are useful metrics. Cash costs are the acid test of silver-miner survivability in lower-silver-price environments, revealing the worst-case silver levels necessary to keep the mines running. All-in sustaining costs show where silver needs to trade to maintain current mining tempos indefinitely.
Cash costs naturally encompass all cash expenses necessary to produce each ounce of silver, including all direct production costs, mine-level administration, smelting, refining, transport, regulatory, royalty, and tax expenses. In Q4’18 these SIL-top-17 silver miners reported cash costs averaging $6.46 per ounce. While that surged 37.0% YoY, it still remains far below prevailing prices. Silver miners face no existential threat.
The major silver miners’ average cash costs vary considerably quarter-to-quarter, partially depending on whether or not Silvercorp Metals happens to be in the top 17 or not. This Canadian company mining in China has negative cash costs due to massive byproduct credits from lead and zinc. So over the past couple years, SIL-top-17 average cash costs have swung wildly ranging all the way from $3.95 to $6.75.
Way more important than cash costs are the far-superior all-in sustaining costs. They were introduced by the World Gold Council in June 2013 to give investors a much-better understanding of what it really costs to maintain silver mines as ongoing concerns. AISCs include all direct cash costs, but then add on everything else that is necessary to maintain and replenish operations at current silver-production levels.
These additional expenses include exploration for new silver to mine to replace depleting deposits, mine-development and construction expenses, remediation, and mine reclamation. They also include the corporate-level administration expenses necessary to oversee silver mines. All-in sustaining costs are the most-important silver-mining cost metric by far for investors, revealing silver miners’ true operating profitability.
The SIL-top-17 silver miners reported average AISCs of $13.28 in Q4’18, surging 31.0% higher YoY! That is troubling, climbing vexingly close to silver’s latest major secular low of $13.99 in mid-November. While Q1’19’s average silver price of $15.55 so far is much better, these profit margins are still tight for a long-struggling industry. Thankfully the major silver miners’ cost structure is better than that number implies.
The highest AISCs by far in Q4 came from SSR Mining, which was formerly known as Silver Standard Resources. They climbed another 11.7% YoY to nosebleed levels of $20.45 per ounce! But that’s not a normal situation. SSRM too is shifting into gold, gradually winding down its old Pirquitas silver mine. As it depletes, there are fewer ounces to spread its fixed costs of mining across which drives up per-ounce costs.
Excluding SSRM, the rest of the SIL top 17 reporting AISCs in Q4’18 averaged a more-reasonable $12.48 per ounce. And these major silver miners providing AISC outlooks for 2019 projected similar levels near $12.70. This is still on the high side, as the SIL top 17’s AISCs ran $10.14, $10.92, $10.93, and $13.53 in the preceding four quarters. But $12.48 is still profitable even with silver seriously languishing relative to gold.
Silver-mining profits really leverage higher silver prices, and big earnings growth attracts in investors to bid up stock prices. In Q4’18 silver averaged $14.53 per ounce. At the SIL top 17’s average AISCs ex-SSRM of $12.48, that implies the major silver miners as an industry were earning profits of $2.05 per ounce. Those are going to grow majorly this quarter. The almost-over Q1’19 has seen silver average $15.55.
With Q4’s AISCs among the highest silver miners have reported in years, they could very well decline in Q1. But assume they remain stable near $12.48. That implies the major silver miners earned about $3.07 per ounce in Q1. A mere 7.0% quarter-on-quarter silver rally could catapult silver-mining profits a massive 49.8% higher QoQ! This awesome profits leverage to silver is why silver stocks amplify silver’s upside.
Of course the greater a silver miner’s exposure to silver, the more its stock will surge as silver advances. First Majestic Silver had the highest silver purity in Q4 at 63.7% of its revenues derived from silver. Thus AG’s stock should thrive with higher silver prices. But SSR Mining’s mere 12.5% silver purity pretty much leaves silver irrelevant. As SSRM is overwhelmingly a primary gold miner, higher silver won’t move the needle.
So investors who want classic silver-stock exposure to leverage silver uplegs need to be smart about how they deploy capital. While buying SIL is easy, it is dominated by primary gold miners. And who on earth wants over 1/8th of their investment wasted in a giant base-metals smelter? The greatest gains in future silver uplegs will come in the stocks with the most silver exposure. They are what investors need to own.
Despite slowing silver production and their ongoing diversification into gold, the major silver miners still remain well-positioned to see huge profits growth as silver marches higher. Especially the primary ones. But with silver hammered to major secular lows in Q4’18, the accounting results of the SIL-top-17 silver miners were quite weak. 3.9%-lower production combined with 12.9%-lower average silver prices wasn’t pretty.
The following accounting comparisons exclude SIL’s largest component WPM. For some reason it waits until the end of March to report Q4 results, which is incredibly disrespectful to its shareholders. Q4 data is getting stale with Q1 ending. There’s no excuse to delay reporting with modern automated accounting systems gathering all data in real-time. For workflow reasons I had to write this essay before WPM reported.
Ex-WPM, the SIL top 17 sold $3.4b worth of metals in Q4’18, which was down 10.9% YoY. Given lower silver production and much-lower silver prices that was relatively good. But cash flows generated from operations collapsed 52.5% YoY to $444m in Q4. That means less capital available to finance mine expansions and new mine builds. Overall corporate treasuries at these companies fell 33.0% YoY to $2.6b.
Surprisingly the hard-GAAP-earnings picture actually improved over Q4’17, though still remained weak. Excluding WPM, the SIL-top-17 silver miners lost $202m in Q4’18. That cut in half Q4’17’s total losses of $412m. But both quarters’ accounting profits were skewed by big non-cash impairment charges. When lower-silver-price forecasts reduce economic reserves at mines, those perceived losses must be recognized.
AG wrote off $168m of its mines’ carrying value on its books in Q4’18 due to lower reserves driven by lower metals prices. The grades within individual ore bodies vary widely. Silver that is economic to mine at $20 might not be worth extracting at $15, so companies have to cut their reserves and flush those non-cash losses through their income statements. PAAS reported a smaller $28m impairment charge as well.
Together these two $196m writedowns alone accounted for 97% of the major silver miners’ Q4 losses. But even without them most of the other SIL top 17 still reported mild-to-moderate GAAP losses with the silver prices so darned low. The comparable Q4’17 results had big writedowns too, primarily $547m by Volcan to meet new accounting standards demanded by another company that bought 55% of its stock.
While the major gold miners had no excuse for their huge impairment charges in Q4’18 since gold was stable last year, silver miners did since silver was hammered. As silver mean reverts higher with gold and outpaces its rallying, the major silver miners’ GAAP profits will improve radically. That will attract in a lot more investors, especially to the primary silver miners. Those capital inflows ought to drive massive gains.
Silver’s last major upleg erupted in essentially the first half of 2016, when silver soared 50.2% higher on a parallel 29.9% gold upleg. SIL blasted 247.8% higher in just 6.9 months, a heck of a gain for major silver stocks. But the purer primary silver miners did far better. The purest major silver miner First Majestic’s stock was a moonshot, skyrocketing a staggering 633.9% higher in that same short span! SIL’s gains are muted.
The key takeaway here is avoid SIL. The world’s leading silver-stock ETF is increasingly burdened with primary gold miners with insufficient silver exposure. And having over 1/8th of your capital allocated to silver miners squandered in Korea Zinc is sheer madness! If you want to leverage silver’s coming huge mean reversion higher relative to gold, it’s far better to deploy in smaller purer primary silver miners alone.
One of my core missions at Zeal is relentlessly studying the silver-stock world to uncover the stocks with superior fundamentals and upside potential. The trading books in both our popular weekly and monthly newsletters are currently full of these better gold and silver miners. Mostly added in recent months as these stocks recovered from deep lows, our unrealized gains are already running as high as 87% this week!
If you want to multiply your capital in the markets, you have to stay informed. Our newsletters are a great way, easy to read and affordable. They draw on my vast experience, knowledge, wisdom, and ongoing research to explain what’s going on in the markets, why, and how to trade them with specific stocks. As of Q4 we’ve recommended and realized 1076 newsletter stock trades since 2001, averaging annualized realized gains of +16.1%! That’s nearly double the long-term stock-market average. Subscribe today for just $12 per issue!
The bottom line is the major silver miners are struggling. With silver falling to nearly a quarter-century low relative to gold in Q4, the miners’ results were naturally weak. Mining costs surged as production kept waning, reflecting the ongoing trend of major silver miners increasingly diversifying into gold. But silver-mining profits are still primed to explode higher as silver continues climbing in its young upleg with gold.
There aren’t enough major primary silver miners left to flesh out their own ETF, which is probably why SIL is dominated by gold miners. While it will rally with silver amplifying its gains, SIL’s upside potential is just dwarfed by the remaining purer silver stocks. Investors will be far-better rewarded buying them instead of settling for a watered-down silver-miners ETF. Their stocks will really surge as silver continues recovering.
Adam Hamilton, CPA
April 1, 2019
Copyright 2000 – 2019 Zeal LLC (www.ZealLLC.com)
Silver recently started outperforming gold again, a watershed event. For long years this white metal has mostly lagged the yellow one, relentlessly battering silver sentiment. But gold surging into year-end 2018 finally sparked some life into moribund silver. This is a bullish sign, as silver has soared in the past once rising prices reach critical mass in attracting new investment capital. Silver looks to be nearing that point again.
Despite a good finish, 2018 was a rough year for silver. Its price slumped 8.6%, way worse than gold’s -1.6% performance. And that still masks miserable intra-year action. At worst in mid-November, silver had plunged 17.3% year-to-date. That was 2.2x gold’s comparable loss, and at $13.99 silver languished at a major 2.8-year low. A soul-crushing 96% of its early-2016 bull market had been reversed and lost!
Back in December 2015 silver had bottomed a few days before gold at a deep 6.4-year secular low. Over the next 7.6 months silver soared 50.2% higher, outpacing gold’s parallel new-bull upleg by 1.7x. That promising start didn’t pan out though, silver crumbed once gold’s advance stalled and failed. Ever since its August 2016 peak of $20.56, silver mostly ground sideways sandwiched between two major downlegs.
It was the latter one that finally bottomed in mid-November 2018, with hope lost and silver bearishness universal and suffocating. Silver’s fortunes are heavily dependent on gold, and silver effectively acts like a gold sentiment gauge. The weak silver prices reflected the lack of enthusiasm for gold, which wasn’t far above its own 19.3-month low of mid-August. Gold had slumped to $1200, and threatened to break below.
For better or worse, gold drives silver. Traders usually ignore the tiny silver market until gold has rallied long enough and high enough to convince them its upside momentum is sustainable. So when gold itself is down in the dumps, silver doesn’t have a prayer. But gold bottomed that day and started clawing back higher, so silver joined along in the bounce. That gradually grew into a new silver upleg over the next 8 weeks.
By early January, silver had rallied 12.4% on a 7.7% gold rally. That made for 1.6x upside leverage to gold, which is still on the low side historically. But it was a welcome change after silver spent much of last year sliding considerably. A sub-span of that advance really caught my attention. Between the hawkish FOMC meeting on December 19th to the young new year on January 3rd, silver surged 7.9% in 9 trading days.
That was 1.9x gold’s 4.2% advance, and silver’s best outperformance relative to gold since that major upleg in H1’16! Something was changing in the left-for-dead silver market, with capital starting to return after more than a couple years of self-imposed exile. Over this past week silver enjoyed another solid stretch of outperformance, offering further confirmation. It started last Friday when gold itself soared 1.7%.
Gold ignited after a Wall Street Journal article claiming the Fed was considering ending its quantitative tightening early! That dovishness hit the U.S. dollar and catapulted gold higher. Over the next 4 trading day’s silver surged 4.8% on gold’s 3.0%, for 1.6x leverage. If that buying can push silver high enough to reach a psychological critical mass and become self-feeding, it portends major silver upside in coming months.
The more silver rallies, the more speculators and investors will want to buy it. The more capital they push into silver, the faster it will ascend. Buying begets buying in silver just like almost everywhere else in the markets. While upside momentum in itself is bullish anytime, silver’s upside potential is far greater than usual because it has been so darned undervalued. That’s made room for massive mean-reversion gains.
Silver’s “valuation” can be inferred relative to gold, its dominant driver. While the global silver and gold supply-and-demand profiles are independent with little direct linkage, these precious metals are joined at the hip psychologically. Silver rarely rallies materially unless gold leads the way. Silver traders look to gold for cues, which makes silver amplify gold’s moves. Silver’s technical relationship to gold is ironclad.
All this makes the Silver/Gold Ratio the most-important fundamental measure of silver-price levels. It is technically calculated by dividing daily silver closes by daily gold closes. But that yields tiny decimals that are hard to parse mentally, like the mid-week SGR of 0.012x. It is far more brain-friendly to consider this ratio from the opposite direction, via the Gold/Silver Ratio. This week it ran at an easier-to-comprehend 82.2x.
Mathematically the SGR is identical to an inverted GSR. So charting the GSR with an upside-down scale yields the same line as the SGR, but with way-more-intelligible numbers. Here this inverted-GSR SGR proxy in blue is superimposed over the silver price in red. Silver has rarely been lower relative to gold than it was in recent months. That portends monster upside as silver mean reverts higher leveraging gold.
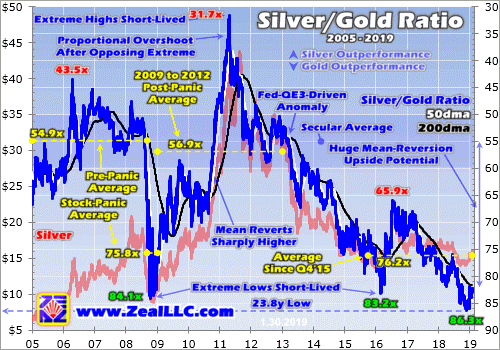
At that latest secular silver low in mid-November, the SGR fell to 85.9x. In other words, it took nearly 86 ounces of silver to equal the value of one ounce of gold. While silver started recovering, it initially lagged gold enough to force the SGR lower still. At the end of November it slumped as low as 86.3x on close, an astounding level. That was actually an extreme 23.8-year secular low in the SGR, nearly a quarter-century!
Silver hadn’t been lower relative to gold since early March 1995, practically a lifetime ago considering all that’s happened in the financial markets since. Even during the greatest market fear event in our lifetimes the SGR wasn’t lower. During late 2008’s first-in-a-century stock panic, the SGR just briefly hit 84.1x in mid-October. Being highly-speculative and super-sensitive to sentiment, silver had plummeted leading into it.
That stock-panic episode of extreme SGR lows shows what’s probable after silver inevitably reverses and mean reverts higher. Over the 3.7 years since 2005 leading into that panic, the SGR averaged 54.9x. That was right in line with the mid-50s that had been normal for decades. Silver had generally oscillated around 1/55th the price of gold, so miners had long used 55x as the proxy for calculating silver-equivalent ounces.
With silver so radically out of whack relative to gold, those extreme SGR panic lows weren’t sustainable. Like a beachball pushed too far under water, silver was ready to explode higher to reestablish its normal relationship with gold. That indeed happened during the post-panic years. After plummeting as low as $8.92 in late-November 2008, silver more than doubled by early December 2009 with a 115.4% gain.
While silver was really outperforming gold after its anomalous lows, at best in that initial post-panic rally the SGR only regained 58.6x. That was still below the 55x secular average. So silver continued slowly grinding higher on balance into late 2010. Then gold started surging again, creating the right sentiment conditions to unleash self-feeding silver buying. Silver skyrocketed from there, surging far faster than gold!
The faster silver soared into early 2011, the more traders wanted to own it and the more capital they poured into it. This psychological phenomenon of higher prices being more attractive runs through nearly all markets. The crazy bitcoin mania in late 2017 was a recent example. Silver’s virtuous circle of surging and new capital inflows finally climaxed in late April 2011 at $48.43 per ounce. That was one heck of a bull.
Starting from those extreme stock-panic lows radically undervalued relative to gold, silver had rocketed 442.9% higher in 2.4 years! And that massive run didn’t simply stop at a 55x SGR, but instead the huge buying momentum drove a proportional upside overshoot. The SGR peaked at 31.7x, which was 4/5ths as far above that long-term 55x mean as the SGR was below it at stock-panic lows. This principle is crucial.
After longstanding price relationships driven by some kind of inexorable fundamental or psychological links are forced to extremes, they don’t just mean revert. That reversion momentum blasts them right through their average to overshoot proportionally towards the opposing extreme! This behavior is very pendulum-like. The farther the SGR is pulled one way, the stronger its swing towards the other side of the arc.
Interestingly that massive mean-reversion-overshoot bull following 2008’s stock panic ultimately dragged the SGR high enough to average 56.9x in those post-panic years between 2009 to 2012. Despite great volatility in this ratio, it continued to gravitate towards that 55x secular mean. That persisted until early 2013 when the Fed’s unprecedented open-ended third quantitative-easing campaign greatly distorted markets.
That year alone the Fed conjured $1020b of QE capital out of thin air to inject into the markets! That forced the flagship US S&P 500 broad-market stock index 29.6% higher that year. Such blistering gains made investors forget about gold and silver, so they fell precipitously. That shattered fragile sentiment leading to multi-year bear markets in the precious metals. Silver leveraged gold’s downside like usual.
Thus the SGR slowly collapsed between early 2013 to early 2016 as gold and silver languished in Fed-driven bear markets. That was a very-challenging time psychologically, scaring away the great majority of contrarian speculators and investors. Ultimately silver plunged so far that the SGR fell to 83.2x at worst in late February 2016. That was an extreme low rivaling the 2008 stock panic’s, which truly defies all reason.
Again such SGR extremes weren’t sustainable, so silver blasted higher with gold and amplified its gains in roughly the first half of 2016. Unfortunately that new-bull upleg was cut short, capping silver at mere 50.2% gains and the SGR at 65.9x. Silver’s typical mean reversion out of extreme SGR lows was indeed underway, but unfortunately it was short-circuited by Trump’s stunning surprise election victory that November.
The stock markets started surging on hopes for big tax cuts soon with Republicans controlling the House, Senate, and presidency. So stock traders dumped gold-ETF shares which hammered the gold price and sucked silver down with it. Silver continued underperforming gold on balance until late November 2018 and that latest extreme 86.3x SGR low. Silver both fell faster than gold and rallied slower than it over this span.
Again that crazy nearly-quarter-century low in silver prices relative to gold prices was more extreme than both during late 2008’s stock panic and after late 2015’s secular low. Shockingly the SGR average since Q4’15 is now running 76.2x, which is actually worse than the 75.8x in the four months in late 2008 hosting that stock panic! Silver has languished far too low relative to gold in recent years, an unsustainable anomaly.
That guarantees a massive mean reversion higher for silver as gold’s young upleg continues to unfold. Seeing gold power higher on balance will motivate speculators and investors to redeploy into silver, which will fuel outsized gains in the white metal. That process is already underway, as proven by silver’s sharp gains relative to gold straddling the dawn of this new year. Silver is starting to outperform gold and mean revert!
Let’s assume the worst-case scenario, a silver upleg that fizzles prematurely due to an exogenous shock like Trump’s election win was back in late 2016. If the SGR merely revisits 65x, at $1250 gold that would mean silver near $19.25. While that’s only a 38% upleg from the mid-November lows, it is still well worth riding. At $1300 and $1350 gold, that very-low 65x SGR would yield silver prices near $20.00 and $20.75.
But with the stock markets almost certainly rolling over into a major new bear, it’s unlikely gold’s upleg will be truncated small again. As long as stocks generally weaken, gold investment demand will remain high driving up gold prices. That will keep traders excited about silver, chasing its gains and bidding it ever higher. It’s hard to imagine the SGR not at least mean reverting to its 55x secular average in this scenario.
At 55x and $1250, $1300, and $1350 gold, silver would power up near $22.75, $23.75, and $24.50. Such levels would make for a total silver upleg of 63%, 70%, and 75% from those deep mid-November lows. So even without a proportional overshoot, silver’s upside potential is big after being hammered to such deep lows relative to gold. Some magnitude of mean reversion higher is certain after such extreme SGR lows.
It would take a major gold upleg running for a couple years to fuel an SGR overshoot. In essentially the first half of 2016, this gold bull’s first upleg powered about 30% higher. That is actually on the small side by historical gold-upleg standards. Apply it to gold’s deep mid-August lows driven by record short selling in gold futures, and that yields an upleg target near $1525. That would work wonders for silver sentiment.
Once gold breaks decisively above its bull-to-date peak of $1365 from July 2016, excitement will explode driving outsized self-feeding investment demand. That should fuel a proportional mean-reversion overshoot in silver. Silver far outperforming gold as capital flooded in could even push the SGR up near 35x briefly. While such an upside extreme wouldn’t last any longer than downside ones, silver would soar.
At $1400, $1450, and $1500 gold, a mean-reversion-overshoot SGR of 35x would catapult silver way up near $40.00, $41.50, and $42.75 per ounce! That implies silver upleg gains ranging from 186% to 206% from mid-November’s low. The key takeaway here is after extreme SGR lows, silver’s resulting mean-reversion gains can grow massive. Silver far outperforms gold for a long time after underperforming for years.
That inevitable outperformance already started through late December and early January, when the SGR recovered sharply from 86.3x to 82.0x. That rapid rebound in silver prices is a strong indication that a major mean reversion is now underway. And history proves that once silver starts moving, it tends to rally fast as momentum builds. Buying begets buying, with higher silver prices fueling larger capital inflows.
As always the biggest gains will be won by the fearless contrarians who buy in early before everyone else figures this out. Investors and speculators alike can play silver’s big coming upside in physical bullion, its leading SLV iShares Silver Trust silver ETF, and the silver miners’ stocks. But only the latter will leverage silver’s gains, making them exceptionally attractive. Consider their example from that last major silver upleg.
Again in 7.6 months in mostly the first half of 2016, silver powered 50.2% higher before Trump’s surprise election win short-circuited that rally. The leading SIL Global X Silver Miners ETF rocketed an immense 247.8% higher in essentially that same span! That made for huge 4.9x upside leverage to silver’s gains, which is pretty awesome. The major silver miners’ stocks will amplify silver’s upside in its next big upleg too.
At Zeal we recognized the extreme anomalous lows in the SGR in late 2015 and early 2016 and deployed aggressively in both gold and silver stocks. The resulting gains were outstanding, with the stock trades in our popular weekly and monthly newsletters averaging +111.0% and +89.7% annualized realized gains in 2016! We’ve filled our trading books again in recent months in anticipation of the next big gold and silver uplegs.
To multiply your wealth in the stock markets, you have to do your homework and stay informed. That’s where our newsletters really help. They draw on my decades of experience, knowledge, wisdom, and ongoing research to explain what’s going on in the markets, why, and how to trade them with specific stocks. I study the markets all day everyday so you don’t have to. Subscribe today and enjoy the fruits of our hard work for just $12 per issue!
The bottom line is silver has started outperforming gold again. After getting pummeled near a quarter-century low relative to gold, silver started surging late last year. Following past extreme SGR lows, silver powered higher in major-to-massive mean-reversion uplegs and bull markets. Their advents have been signaled by silver beginning to rally faster than gold after suffering long periods of underperformance.
That’s now happening again, which is a super-bullish omen for silver. Capital inflows are accelerating as gold’s gains restore more-favorable sentiment. As long as gold continues meandering higher on balance, silver buying will beget more silver buying. That portends big gains coming in silver and especially the stocks of its miners. Silver mean reversions higher out of extreme lows relative to gold can run for years.
Adam Hamilton, CPA
February 4, 2019
Copyright 2000 – 2019 Zeal LLC (www.ZealLLC.com)
Everyone has different reasons for investing or speculating in the resource sector. I believe, for the majority of the participants, it’s the allure of 10 baggers that attract them to the juniors.
While the appeal to windfall profits is attractive to almost anyone, I believe it’s exactly this mindset that keeps many investors from actually realizing the gains they are given in the market.
Too many times, I have spoken to fellow investors who haven’t taken money off the table when it’s there, and are left holding the bag until the market turns or the company successfully answers the next unanswered question.
First, if you are an investor who can stomach the ebb and flow of the market then taking a long-term position in juniors can work. Secondly, and key to the first point, it can only work if you are right about the junior company in which you are invested. Will they continue to get ‘yes’ answers as they pursue the development of their mineral deposit?
The juniors draw much of the attention in the resource market, however, I think that there are larger companies that have big upside potential, pay a dividend, and are actual investment-grade companies.
Let’s take a look at one of them!
Altius Minerals Corporation
I’m very bullish on both precious and base metals moving forward. However, the pragmatist in me is especially drawn to the base metals, as their value proposition in today’s society is so easily understood.
Today, I have for you an interview with Chad Wells, VP of Corporate Development of Altius Minerals Corporation (ALS:TSX). Altius is the sector’s only diversified base metal royalty and project generation company.
Currently, Altius has 15 producing royalties in copper, zinc, nickel, potash, iron, thermal and metallurgical coal. In addition, the project generation side of their business has drastically grown in overall equity value since 2016, moving from roughly $22 million to $68 million at September 30.
There are 54 new projects since Q1 2016 within Altius’ project generator portfolio and these will not only be the source of cash through equity sales in the future, but more importantly, will be the source of new cash flow by way of the royalties that are associated with most of the projects in their portfolio.
In my opinion, Altius is the best example of intellectual capital and how people are, by far, the most important commodity in any business.
As Wells mentions in our conversation,
“We’re a group that sticks to our guns, and believes in our own reasoning and rationale. At the end of the day, it’s about relying upon your own technical expertise and surrounding yourself with the right people that are willing to give you the right opinion that is unbiased, genuine and legit.”
I have long been an Altius shareholder and, in my opinion, would say that if I could only own one company in the sector, it would be Altius Minerals, hands down.
Altius Minerals (ALS:TSX)
MCAP – $556 M (at the time of writing)
Shares – 43.0 million
Annual Dividend – $0.16 / share
Outstanding Debt – $120 million
Cash and Public Equity Holdings – $180 million ($33.8 million cash)
2018 Royalty Revenue Guidance – $64M to $69M
Brian: In my conversation with Brian (referring to CEO Brian Dalton) last November, he was super bullish on iron ore and, over the course of the year, Altius has taken big steps to capitalize on the iron ore market. First in March, by increasing your position in Alderon Iron Ore and, most recently in Q3, increasing your position in Labrador Iron Ore Royalty Corporation.
Can you please explain the opportunity you see in the iron ore market?
Chad: We’ve been a mainstay player in the Labrador Trough since 2004 and 2005. Originally, it was from an exploration perspective where we generated projects and sold them on to third parties. Alderon Iron Ore was created during that time, as a part of that strategy, and lead to us becoming very intimate with the iron markets. The Labrador Trough iron ore fits a niche portion of the global marketplace.
Brian (referring to Altius CEO Brian Dalton) has an innate ability to see around corners so he’s been predicting a bifurcation happening in the broader iron ore market this past few years for high grade iron ore with low impurities, compared to the lower grade, higher impurity stock coming out of the Pilbara. A lot of it’s being driven by Chinese pollution standards and emissions targets through their steel mills. You’ve seen the Chinese cut significant volumes of steel production last year because mills were burning lower purity met coal and iron ore.
That’s led to a premium for the high grade, low impurity products. While the quoted price for iron ore, let’s say is at $70 per ton, the high grade Trough products are getting better than $100 per ton, while low grade is trading at a discount.
Brian recognized the separation that was coming in the market between high and low grade long before the broader market did. For us, it spawned an investment thesis to buy a substantial share position in Labrador Iron Ore Royalty Company (LIORC) mainly accumulated with the Fairfax preferred money starting in early 2017. LIORC has a 7% gross revenue royalty on Iron Ore Company of Canada’s (IOC) Carol Lake operations, as well as a 15% equity stake. LIORC is a passive type issuer, taking the money that they get from the royalty and then dividending most of it straight to shareholders.
For us it was the opportunity to have exposure to a royalty on a premier iron asset in Labrador, at a time when we thought the market was going to start to take recognition of that.
Over the last year, we increased our Labrador Iron Ore Royalty Corporation holdings substantially. If you look at our average price, which was around $17 a share before we bought the most recent addition of another .4%, LIORC stock traded last week as high as $31. At the same time, the yield of the dividends that we’ve realized off the asset are quite pronounced. And of course, we treat it as royalty income, effectively, in our per annum royalty revenue. So it fills out some of that diversified commodity exposure. So it’s been really good.
Alderon was much more strategic. We were a founder, having discovered the underlying Kami deposit way back in 2005-06. Our recent doubling up, if you will, on Alderon, goes back to this bifurcation in the iron ore market thesis, which we believe is a real thing and that’s going to last. It’s also worth mentioning that we bought the additional $5 million stake from Liberty when we agreed to a friendly transaction buying out the balance of the potash royalties that we’d held together in a JV.
With that comes the reality that you’re playing Carol Lake, through LIORC. Also, we have a convertible debenture with Champion Iron. Champion is the company that bought the Bloom Lake assets for $10 million in cash plus assumed liabilities of around $43 million from Cliffs, who had sunk nearly US$3 billion of capital into the project during the last iron bull.
The way we see things playing out in the Trough, we believe IOC brings a lot of transparency and reality to the broader marketplace, of the niche, that Labrador iron fits. We think that spills over into Champion, which is a very high margin operation right now, but is flying under the radar. We think the market will take credence and recognition there.
And as this market continues to want more high grade, low impurity iron ore, the next shovel ready project in that district is Kami. For us to buy that stake, on favourable terms, in Alderon from Liberty, brings us back to being that major shareholder with a big stick , it makes a lot of sense for us strategically.
If you reflect back to the last cycle, it was the asset that would have tore the lid off the can for Altius as a royalty generative business. The thing that most of the marketplace doesn’t realize today is that Altius is a different type of royalty company. It’s not a Franco or a Wheaton, who grows through acquisition. We actually grow our royalty portfolio organically and Alderon is one example of that.
In the past bull market in iron, around 2011, when we thought that Kami was going to get built, Alderon raised a bunch of money with the Chinese partner, Hebei Group. It almost got through the window in the sense of raising the capital to build a new mine. If that had to have happened, not only would we made a couple hundred million on the equity, but we would have had an underlying royalty on that asset at 3% gross royalty that based on the feasibility numbers of the assessment at the time, it would have generated about $25 million per year of royalty revenue for Altius for 20+ years. The reason it didn’t happen is because the iron ore bull market ended so quickly when prices dropped from around $130 per tonne to levels less than half that. If you add the premiums to the current spot, we’re edging closer to $100+ again.
Alderon is an extraordinary opportunity of optionality and because of what’s happened in the bigger iron ore market and because of the strategic significance of Labrador iron product in general, I think it happens this cycle.
Kami still needs a billion dollars in capital to get it done, but consider what’s going on with Rio Tinto and IOC and the rumors of them IPO-ing their IOC stake, and, again, the success of Champion in restarting Bloom, and it seems a reasonable bet that Alderon will raise the capital this time around. It might get built. If it does, it will differentiate Altius from all of the others because the net asset value just from the royalty aspect that gets created from nothing, is profound.
Brian: That leads into my next question, generally speaking, in your opinion, how difficult is it to raise $1 billion to develop a mine, today?
Chad: Very difficult and, in saying that, today’s market is probably not the one to do it in. Will that market come? Of course it will. One thing that’s going to be very apparent in what I’ll call the pending bull cycle in commodities, is that the story is going to be about supply this time around, not demand.
What we’ve seen happen is the world has not developed enough copper, nickel and high grade iron ore mines to sustain just the static needs of society. So ultimately, it’s going to be a supply crunch and there’s just not going to be enough supply out there.
So that will incentivize commodity pricing, and incentivize capital, and more mines will get built. So will it happen? It will. The iron ore business is a bit different, because there is a lot of iron ore that came on through the last cycle through investment. But most of it is in this low grade or medium grade stuff. So it doesn’t have the strategic niche of this high grade, low impurity ore, which quite frankly, the Chinese need.
So is the capital there today? Probably not. Will it come? It will. Also, I’d say you don’t necessarily have to think that these things are going to be built by the market. There’s a lot of diversified miners out there that have good balance sheets, have made a lot of money here in the last few years, again, and are going to be looking for shovel-ready assets to acquire to develop themselves. Maybe some of these things get built in different ways, not necessarily going to be through the capital market conventions of a bull market, if you will.
Brian: Earlier this year, Altius entered the lithium market with the investment in a closed end limited partnership with Lithium Royalties Corporation. The deal gives Altius the rights to buy up to 10% of selected royalty direct investments.
Generally speaking, what criteria is Altius looking for in terms of the ideal investment in the lithium space? For example, does the lithium deposit type or jurisdiction matter?
Chad: We’ve always been a group that has focused on exploration and investment in bread and butter commodities, which lithium would not fit. We’ve seen a lot of these specialty themes over the years and we haven’t invested in them because their supply and demand fundamentals have been so wonky that we just weren’t comfortable with the volatility.
In the case of lithium and the battery metal craze in general, I’d say we missed it with lithium. We didn’t necessarily believe that it was going to be one of these bread and butter commodities. I think we’ve come to realize that it is something that we should have spent more time investing in earlier through our exploration business, but we didn’t. Because regardless of how much we try to minimize the forecasts of different battery chemistries in the EV build-out scenario, you just can’t ignore lithium. And the big correction in the pricing this year gives us a more comfortable entry point to be buying when prices are not so near the top. So it is a bit of a catch up game.
What we did do this year is we partnered with expertise. The guys at Lithium Royalty Corp., especially Ernie Ortiz, the CEO of that ship, he’s a specialist in the lithium world. He’s been an authority in lithium for many years starting as one of the first sell side analysts to take apart the EV forecasts as the story was unfolding for the future demand of lithium.
So, again, what Altius decided, in this case, is to partner with some really smart people who had the groundwork laid and had the best-in-class assets sized up and deals templated. We are investing basically side by side with them through an equity position into that company and our royalty co-vestment rights are pro rata with our equity ownership. But we can pick and choose which ones we actually fund – we don’t have to participate in every one of them, and in fact, haven’t participated in every one so far.It is a different way for us to do it, as typically we’ve always been the front men running our own ship, whether it’s a particular jurisdiction or a particular commodity or a particular idea. In this case, we weren’t the first men running, so we partnered with the first man running.
Brian: Warren Buffett is famous for saying, “You must learn from mistakes, but they don’t have to be your own.” I was wondering if you could parlay that into the 20-year history of Altius.
Are there any lessons in particular that stand out to you?
Chad: Absolutely. It’s all lessons. I’ll focus on my side of the business, exploration and project generation. In the last bull cycle, we made $200 million plus through our project generation efforts. How did we do that?
We took geological real estate that we had generated with boot and hammer prospecting and came up with big context and big ideas. Then, we effectively sold it on to a third party. In the case of where we made the money selling on to a third party, it was a market participant. What we did is we exchanged geological real estate which is generally illiquid for shares in a fairly liquid company on a stock exchange, versus up until that point in time, let’s say the first 10 years of Altius, we spent a lot of our time doing exploration deals with major miners.
Though that gave us a lot of technical credibility in the product that we generated and we were able to attract those third party endorsements, it was an illiquid business. What I mean is that even though you did a deal, you weren’t able to monetize your minority residual stake in the assets.
So the big learning experiment that we had when we look back at the last bull cycle is related to the way that we made money, it was actually trading geological real estate for shares. So when we enter this bull cycle, I don’t know that I’d call it a bull cycle yet, the phone started to ring. All of a sudden, here we were as an exploration group, we had assembled projects in nine jurisdictions globally from 2012 to 2016, when nobody gave a crap about the mining resources business, and certainly weren’t doing exploration. We were able to waltz into world-class jurisdictions, build meaningful land positions, generated a lot of geological real estate, and basically we sat on it and waited for the market to turn.
Since that time, we’ve sold 54 (working on 57!) projects and 17 different agreements in less than 24 months. It’s been extraordinary. I didn’t think it could get so good for us. Every deal we’ve done, except for one that we haven’t announced yet, is that we took our geological real estate, we’d trade it for shares in a third party junior company, or in special circumstances, we even facilitated the IPO of new entities.
Where at the same time, though, where did we end up? We ended up with a big share position in a company that now held the assets that we generated, while at the same time we retained blanket royalties to the underlying projects. Long term sewed up in terms of the mining operations, we get kicked back on our royalties, while at the same time, we’re so early into the cycle we’re effectively getting seed stock in juniors that go to explore our projects.
So these positions expose us to discovery opportunity off of our balance sheet, on somebody else’s balance sheet, at the seed level. It’s beautiful! So if you look at our juniors portfolio today, we’re sitting on 27 juniors with a value of about $65 million at the end of September.
I can’t make a promise, but I’ll say to you I have extraordinary belief that that $65 million will be worth the market capitalization value of the entirety of Altius, roughly $600 million, through the cycle.
We’re seeded up on the right deals, at the right time, in the right commodities and right projects that those things are going to deliver value.
It’s a cyclical business, you need to be able to, to some degree, trade those cycles. We’ve been able to create fundamentally long-term royalties that punch through the cycles, that we can realize on over 10, 20, 30 year increments. At the same time, we’re getting seeded up on equity that we can monetize and put a big surplus of cash into the bank, so when the market rolls over again, we can put it to work.
So, really, it was about realizing it’s all about liquidity and timing.
Brian: That’s a great answer.
The ramifications of confirmation bias should be a major concern for all investors, as human nature dictates that we love to reaffirm our beliefs with confirming evidence. As a manager, the same concern can be said for “yes” men; people who continually support the boss regardless of whether they think they are right.
Personally, in my career as a manager in steel manufacturing, I quickly learned how important it was to surround myself with people who weren’t afraid to tell me what they thought about the projects that were being proposed or the direction that I wanted to take.
In your experience, how important is it to find or listen to disconfirming information?
Chad: The resources sector more than in any other, you shouldn’t run with the herd. You have to go against it. The reality is that this business in general – exploring, mine development, mine construction, mine production – is extremely tough and tedious.
Additionally, you’ve got to realize that there’s a lot of different tiers and categories of humans that benefit from a story advancing versus not advancing. So, a lot of times, you’re always encouraged to keep spending and spending and spending, because to some degree it’s the mentality to keep things going.
We don’t get into that type of philosophy. We’re a group that sticks to our guns, and believes in our own reasoning and rational. At the end of the day, it’s about relying upon your own technical expertise and surrounding yourself with the right people that are willing to give you the right opinion that is unbiased, genuine and legit.
The resource sector is like no other, it is feast or famine, it’s a herd mentality. To succeed you have to genuinely and truly be a contrarian. You have to be a no man versus a yes man.
Concluding Remarks
Altius Minerals is the cornerstone of my personal portfolio and will remain that way for the foreseeable future. In Altius, I see minimal downside risk outside of a broader market crash, which, in reality, would negatively affect just about every company’s share price.
Further, the upside potential from their project generation business looks very promising. First, looking at their development stage royalties projects: Excelsior Mining’s Gunnison copper project, Alderon Iron Ore’s Kami project or Evrim’s Cuale project, there is a lot of potential cash flow that could be soon flowing in Altius’ direction.
On the exploration side of their equity portfolio, you have Adventus Zinc Corporation (ADZN:TSXV), Aethon Minerals (AET:TSXV), Antler Gold (ANTL:TSXV), and Sokomon Iron (SIC:TSXV) to name just a few. Additionally, you have their latest spin out, Adia Resources, which is partnered with De Beers in the exploration for diamonds in Manitoba.
There are no guarantees in life, however, I believe that if you look at the short and long-term prospects of Altius, I think you will agree that they look tremendously bright.
Don’t want to miss a new investment idea, interview or financial product review? Become a Junior Stock Review VIP now – it’s FREE!
Until next time,
Brian Leni P.Eng
Founder – Junior Stock Review
Disclaimer: The following is not an investment recommendation, it is an investment idea. I am not a certified investment professional, nor do I know you and your individual investment needs. Please perform your own due diligence to decide whether this is a company and sector that is best suited for your personal investment criteria. I do own shares in Altius Minerals, Adventus Zinc Corporation, Aethon Minerals, and LIORC. All Altius Minerals analytics were taken from their website and press releases. I have NO business relationship with Altius Minerals or any of the other companies mentioned in this article.
The major silver miners’ stocks have been largely abandoned this year, spiraling to brutal multi-year lows. Such miserable technicals have exacerbated the extreme bearishness plaguing this tiny contrarian sector. While profitable silver mining is challenging at today’s exceedingly-low silver prices, these miners are chugging along. Their recently-reported Q3’18 results show their earnings are ready to soar as silver recovers.
Four times a year publicly-traded companies release treasure troves of valuable information in the form of quarterly reports. Companies trading in the States are required to file 10-Qs with the US Securities and Exchange Commission by 40 calendar days after quarter-ends. Canadian companies have similar requirements at 45 days. In other countries with half-year reporting, many companies still partially report quarterly.
Unfortunately the universe of major silver miners to analyze and invest in is pretty small. Silver mining is a tough business both geologically and economically. Primary silver deposits, those with enough silver to generate over half their revenues when mined, are quite rare. Most of the world’s silver ore formed alongside base metals or gold. Their value usually well outweighs silver’s, relegating it to byproduct status.
The Silver Institute has long been the authority on world silver supply-and-demand trends. It published its latest annual World Silver Survey covering 2017 in mid-April. Last year only 28% of the silver mined around the globe came from primary silver mines! 36% came from primary lead/zinc mines, 23% copper, and 12% gold. That’s nothing new, the silver miners have long produced less than a third of world mined supply.
It’s very challenging to find and develop the scarce silver-heavy deposits supporting primary silver mines. And it’s even harder forging them into primary-silver-mining businesses. Since silver isn’t very valuable, most silver miners need multiple mines in order to generate sufficient cash flows. Traditional major silver miners are increasingly diversifying into gold production at silver’s expense, chasing its superior economics.
So there aren’t many major silver miners left out there, and their purity is shrinking. The definitive list of these companies to analyze comes from the most-popular silver-stock investment vehicle, the SIL Global X Silver Miners ETF. In mid-November at the end of Q3’s earnings season, SIL’s net assets were running 6.6x greater than its next-largest competitor’s. So SIL continues to dominate this tiny niche contrarian sector.
While SIL has its flaws, it’s the closest thing we have to a silver-stock index. As ETF investing continues to eclipse individual-stock picking, SIL inclusion is very important for silver miners. It grants them better access to the vast pools of stock-market capital. Differential SIL-share buying by investors requires this ETF’s managers to buy more shares in its underlying component companies, bidding their stock prices higher.
In mid-November as the silver miners were finishing reporting their Q3’18 results, SIL included 23 “Silver Miners”. Unfortunately the great majority aren’t primary silver miners, most generate well under half their revenues from silver. That’s not necessarily an indictment against SIL’s stock picking, but a reflection of the state of this industry. There aren’t enough significant primary silver miners left to fully flesh out an ETF.
This disappointing reality makes SIL somewhat problematic. The only reason investors would buy SIL is they want silver-stock exposure. But if SIL’s underlying component companies generate just over a third of their sales from silver mining, they aren’t going to be very responsive to silver price moves. And most of that ETF capital intended to go into primary silver miners is instead diverted into byproduct silver miners.
So silver-mining ETFs sucking in capital investors thought they were allocating to real primary silver miners effectively starves them. Their stock prices aren’t bid high enough to attract in more investors, so they can’t issue sufficient new shares to finance big silver-mining expansions. This is exacerbating the silver-as-a-byproduct trend. Only sustained much-higher silver prices for years to come could reverse this.
Silver miners’ woes are really exacerbated by silver’s worst performance in decades. In mid-November silver sunk to a 2.8-year low of $13.99. That naturally dragged down SIL to a similar 2.7-year low. But relative to gold which usually drives it, silver was faring far worse. The Silver/Gold Ratio sunk to 85.9x in mid-November, meaning it took almost 86 ounces of silver to equal the value of a single ounce of gold.
The SGR hadn’t been lower, or silver hadn’t been more undervalued relative to gold, since all the way back in March 1995! That’s pretty much forever from a markets perspective. With silver languishing at an exceedingly-extreme 23.7-year low relative to gold, it’s hard to imagine it doing much worse. So the silver miners are weathering one of the toughest environments they’ve ever seen, which we have to keep in mind.
Every quarter I dig into the latest results from the major silver miners of SIL to get a better understanding of how they and this industry are faring fundamentally. I feed a bunch of data into a big spreadsheet, some of which made it into the table below. It includes key data for the top 17 SIL component companies, an arbitrary number that fits in this table. That’s a commanding sample at 96.9% of SIL’s total weighting!
While most of these top 17 SIL components had reported on Q3’18 by mid-November, not all had. Some of these major silver miners trade in the UK or Mexico, where financial results are only required in half-year increments. If a field is left blank in this table, it means that data wasn’t available by the end of Q3’s earnings season. Some of SIL’s components also report in gold-centric terms, excluding silver-specific data.
The first couple columns of this table show each SIL component’s symbol and weighting within this ETF as of mid-November. While most of these stocks trade on US exchanges, some symbols are listings from companies’ primary foreign stock exchanges. That’s followed by each miner’s Q3’18 silver production in ounces, along with its absolute year-over-year change. Next comes this same quarter’s gold production.
Nearly all the major silver miners in SIL also produce significant-to-large amounts of gold! That’s truly a double-edged sword. While gold really stabilizes and boosts silver miners’ cash flows, it also retards their stocks’ sensitivity to silver itself. So the next column reveals how pure these elite silver miners are, approximating their percentages of Q3’18 revenues actually derived from silver. This is calculated two ways.
The large majority of these top SIL silver miners reported total Q3 revenues. Quarterly silver production multiplied by silver’s average price in Q3 can be divided by these sales to yield an accurate relative-purity gauge. When Q3 sales weren’t reported, I estimated them by adding silver sales to gold sales based on their production and average quarterly prices. But that’s less optimal, as it ignores any base-metals byproducts.
Next comes the major silver miners’ most-important fundamental data for investors, cash costs and all-in sustaining costs per ounce mined. The latter directly drives profitability which ultimately determines stock prices. These key costs are also followed by YoY changes. Last but not least the annual changes are shown in operating cash flows generated and hard GAAP earnings, with a couple exceptions necessary.
Percentage changes aren’t relevant or meaningful if data shifted from positive to negative or vice versa, or if derived from two negative numbers. So in those cases I included raw underlying data rather than weird or misleading percentage changes. This whole dataset together offers a fantastic high-level read on how the major silver miners are faring fundamentally as an industry. They are hanging in there quite well.
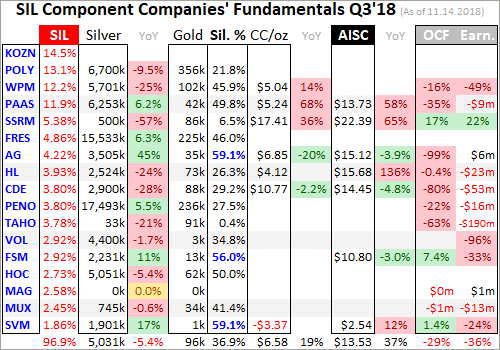
Production is naturally the lifeblood of the silver-mining sector. The more silver and increasingly gold that these elite miners can wrest from the bowels of the earth, the stronger their fundamental positions and outlooks. These top 17 SIL miners’ overall silver production slipped 2.2% YoY to 75.5m ounces in Q3’18. But their shift into more-profitable gold mining continued, with aggregate production up 1.6% YoY to 1.4m ounces.
According to the Silver Institute’s latest WSS, total world silver mine production averaged 213.0m ounces per quarter in 2017. So at 75.5m in Q3, these top 17 SIL components were responsible for 35.4% of that rate. There is one unusual situation that slightly skewed this result. SSR Mining, which used to be known as Silver Standard Resources, saw its silver production plummet 57% YoY as its lone silver mine is depleting.
The winding down of SSRM’s old Pirquitas silver mine is proceeding as forecast and has been going on for some time. This once major silver miner is morphing into a primary gold miner, which accounted for a record 94% of its revenue in Q3. Excluding SSRM, the rest of these top SIL silver miners saw their silver production retreat an immaterial 1.3% YoY. That’s pretty impressive given this year’s collapse in silver prices.
Q3’s average silver price was just $14.96, down a major 11.2% YoY. That was far-worse performance than gold, with its quarterly average merely sliding 5.3% lower between Q3’17 to Q3’18. Considering how miserable this silver-price environment is with the worst relative performance to gold in decades, the major silver miners are doing well on production. They continue to hold out for silver mean reverting higher.
Silver is likely so down in the dumps because it effectively acts like a gold sentiment gauge. Generally big silver uplegs only happen after gold has rallied long enough and high enough to convince traders its gains are sustainable. Then the way-smaller silver market tends to start leveraging and amplifying gold’s moves by 2x to 3x. But gold sentiment was so insipid over this past year that no excitement was sparked for silver.
Unfortunately at these bombed-out silver prices the economics of silver mining are way inferior to gold mining. The traditional major silver miners are painfully aware of this, and have spent years actively diversifying into gold. In Q3’18, the average percentage of revenues that these top 17 SIL miners derived from silver was just 36.9%. That’s right in line with the prior 4 quarters’ 39.3%, 35.3%, 36.8%, and 36.3%.
Silver mining is every bit as capital-intensive as gold mining, requiring similar large expenses for planning, permitting, and constructing mines and mills. It needs similar heavy excavators and haul trucks to dig and move the silver-bearing ore. Similar levels of employees are necessary to run these mines. But silver generates much lower cash flows due to its lower price. Consider hypothetical mid-sized silver and gold mines.
They might produce 10m and 300k ounces annually. At last quarter’s average prices, these silver and gold mines would yield $150m and $363m of yearly sales. Thus regrettably it is far easier to pay the bills mining gold these days. So primary silver miners are increasingly becoming a dying breed, which is sad. The traditional major silver miners are adapting by ramping their gold production often at silver’s expense.
With major silver miners so rare, SIL’s managers are really struggling to find components for their leading ETF. So in Q3’17 they added Korea Zinc, which is now SIL’s largest component at over 1/7th of its total weighting. In my decades of studying and trading this tiny sector, I’d never heard of it. So I looked into Korea Zinc and found it was merely a smelter, not even a miner. It really needs to be kicked out of SIL.
Every quarter since I’ve tried to dig up information on Korea Zinc, but its English-language disclosures are literally the worst I’ve ever seen for any company. Its homepage gives an idea of what to expect, declaring “We are Korea Zinc, the world’s one of the best smelting company”. I’ve looked and looked and the latest production data I can find in English remains 2015’s. I can’t find it from third-party sources either.
That year Korea Zinc “produced” 63.3m ozs of silver, which averages to 15.8m quarterly. That is largely a byproduct from its main businesses of smelting zinc, lead, copper, and gold. Korea Zinc certainly isn’t a major silver miner, and has no place in a “Silver Miners ETF”. No silver-stock investor wants to own a base-metals smelter! Korea Zinc should be removed, its overweighting reallocated to the rest of SIL’s holdings.
SIL investors ought to contact Global X to ask them to stop tainting their ETF’s utility and desirability with Korea Zinc. If they want it to be successful and grow, they need to stick with their mission of owning the major silver miners exclusively. Silver-stock exposure is the only reason investors would buy SIL. There is another situation investors need to be aware of with Tahoe Resources and its held-hostage Escobal mine.
Tahoe was originally spun off by Goldcorp to develop the incredible high-grade Escobal silver mine in Guatemala, which went live in Q4’13. Everything went well for its first few years. By Q1’17, Escobal was a well-oiled machine producing 5700k ounces of silver. That provided 1000+ great high-paying jobs to locals and contributed big taxes to Guatemala’s economy. Escobal was a great economic boon for this country.
But a radical group of anti-mining activists managed to spoil everything, cruelly casting their fellow countrymen out of work. They filed a frivolous and baseless lawsuit against Guatemala’s Ministry of Energy and Mines, Tahoe wasn’t even the target! It alleged this regulator hadn’t sufficiently consulted with the indigenous Xinca people before granting Escobal’s permits. They don’t even live around this mine site.
Only in a third-world country plagued with rampant government corruption would a regulator apparently not holding enough meetings be a company’s problem. Instead of resolving this, a high Guatemalan court inexplicably actually suspended Escobal’s mining license in early Q3’17! Tahoe was forced to temporarily mothball its crown-jewel silver mine, and thus eventually lay off its Guatemalan employees.
That license was technically reinstated a couple months later, but the activists appealed to a higher court. It required the regulator to study the indigenous people in surrounding areas and report back, and then needs to make a decision. The government also needs to clear out an illegal roadblock to the mine site by violent anti-mine militants, who have blockaded Escobal supplies and physically attacked trucks and drivers!
So Escobal has been dead in the water with zero production for 5 quarters now, an unthinkable outcome. This whole thing is a farce, a gross miscarriage of justice. I hope this isn’t a stealth expropriation, that Guatemalan bureaucrats will get their useless paperwork done sooner or later and let Escobal come back online. Within a year, Escobal’s silver production should return to pre-fiasco levels of 5700k ounces a quarter.
At that rate, Escobal would retake the throne of being the world’s largest primary silver mine! It would boost overall SIL-top-17 production by a massive 7.6%. Last year no one expected this unprecedented Escobal debacle to last very long, as the economic damage to Guatemala was too great. But as it drags on and on, TAHO stock has been decimated. It slumped to a brutal all-time record low in mid-November.
Sadly for long-suffering TAHO shareholders, management capitulated. In mid-November they agreed to sell the company to Pan American Silver at rock-bottom prices despite a 55% premium over that all-time low. That’s devastating for TAHO investors but a steal for PAAS, which is SIL’s 4th-largest component at 11.9% of its total weighting. That keeps Escobal’s huge production in SIL if PAAS can finesse its reopening.
Unfortunately SIL’s mid-November composition was such that there wasn’t a lot of Q3 cost data reported by its top component miners. A half-dozen of these top SIL companies trade in South Korea, the UK, Mexico, and Peru, where reporting only comes in half-year increments. There are also primary gold miners that don’t report silver costs, and a silver explorer with no production. So silver cost data remains scarce.
Nevertheless it’s always useful to look at what we have. Industrywide silver-mining costs are one of the most-critical fundamental data points for silver-stock investors. As long as the miners can produce silver for well under prevailing silver prices, they remain fundamentally sound. Cost knowledge helps traders weather this sector’s left-for-dead unpopularity without succumbing to selling low like the rest of the herd.
There are two major ways to measure silver-mining costs, classic cash costs per ounce and the superior all-in sustaining costs. Both are useful metrics. Cash costs are the acid test of silver-miner survivability in lower-silver-price environments, revealing the worst-case silver levels necessary to keep the mines running. All-in sustaining costs show where silver needs to trade to maintain current mining tempos indefinitely.
Cash costs naturally encompass all cash expenses necessary to produce each ounce of silver, including all direct production costs, mine-level administration, smelting, refining, transport, regulatory, royalty, and tax expenses. In Q3’18, these top 17 SIL-component silver miners that reported cash costs averaged $6.58 per ounce. While that surged 35.3% YoY, it still remains far below today’s anomalously-low silver prices.
There are a couple of extreme cash-cost outliers that are skewing this average, but offsetting each other. SSRM’s depleting silver mine is producing less with each passing quarter, forcing fewer ounces to bear the fixed costs of mining. Its crazy-high $17.41 per ounce in Q3 isn’t normal. But on the other side of this is Silvercorp Metals, which produces silver in Chinese mines yielding enormous base-metals byproducts.
Selling those and crediting their value across the silver ounces mined dragged down SVM’s cash costs to an unbelievable negative $3.37 in Q3! Excluding these extreme outliers, the rest of the SIL top 17 saw average cash costs of $6.40. That’s not too far above the past 4 quarters’ $4.86, $4.66, $5.05, and $3.95. As long as silver prices remain over those low levels, the silver miners can keep the lights on at their mines.
Way more important than cash costs are the far-superior all-in sustaining costs. They were introduced by the World Gold Council in June 2013 to give investors a much-better understanding of what it really costs to maintain silver mines as ongoing concerns. AISCs include all direct cash costs, but then add on everything else that is necessary to maintain and replenish operations at current silver-production levels.
These additional expenses include exploration for new silver to mine to replace depleting deposits, mine-development and construction expenses, remediation, and mine reclamation. They also include the corporate-level administration expenses necessary to oversee silver mines. All-in sustaining costs are the most-important silver-mining cost metric by far for investors, revealing silver miners’ true operating profitability.
In Q3’18 these top 17 SIL miners reporting AISCs averaged $13.53 per ounce, which also surged 39.0% YoY. Again that was skewed in both directions by SSRM’s extremely-high $22.39 on Pirquitas’ depletion and SVM’s exceedingly-low $2.54 on those huge base-metals byproducts. Without them, the rest of the top 17 averaged $13.96 AISCs. That was much higher than the past 4 quarters’ $9.73, $10.16, $10.92, and $10.93.
The lower production was definitely a factor, which is inversely proportional to per-ounce costs. Silver-mining costs are largely fixed quarter after quarter, with actual mining requiring roughly the same levels of infrastructure, equipment, and employees. So the lower production, the fewer ounces to spread mining’s big fixed costs across. The major silver miners also reported lower ore grades, exacerbating the decline.
Nevertheless, the top 17 SIL miners’ AISCs both with and without the outliers still remained under silver’s weak average $14.96 price in Q3. So even with silver faring its worst relative to gold in decades thanks to devastated sentiment, the silver mines were profitable. And interestingly the closer AISCs crowd the prevailing silver prices, the more profits leverage the miners have to silver mean reverting much higher.
In mid-November silver and SIL slumped to their lowest levels since back in January and March 2016. That was early in a new silver bull which emerged from conditions like today’s where silver was despised. Over 7.6 months between December 2015 and August 2016, silver soared 50.2% higher as gold surged in its own new bull. And with silver moving again, investors eagerly started returning to the battered silver stocks.
Thanks to that silver-bull upleg, SIL skyrocketed 247.8% higher in just 6.9 months in essentially that first half of 2016! That ought to give embattled silver-stock investors some hope. All it will take to turn silver stocks around is a typical gold-driven silver upleg, and then they will soar again. The reason that silver miners’ stocks blast dramatically higher with silver is their high inherent profits leverage to silver prices.
Assume another 50% silver upleg, which is pathetically small by historical standards, from silver’s recent secular low in mid-November. That would catapult silver back up to $21 per ounce for the first time since July 2014. At Q3’18’s top-17-SIL-stock average AISCs of $13.53, profits were just $0.47 per ounce at $14 silver. But at $21 assuming stable AISCs, they would soar an astounding 1489% higher to $7.47 per ounce!
You better believe silver-stock prices would skyrocket with that kind of earnings growth. The higher their AISCs, the greater their upside profits leverage. Now consider this same 50% silver upleg using the rolling-past-4-quarter top-17-SIL-stock average AISCs of $10.43 per ounce. That implies the $3.57 profit seen at $14 silver would only balloon 196% to $10.57 per ounce at $21 silver. So higher costs aren’t necessarily bad.
As long as AISCs are below prevailing silver prices, the major silver miners can weather anything. The closer their AISCs creep to silver, the greater their earnings growth when silver mean reverts higher. So the major silver miners’ upside from here is truly explosive as silver recovers, just like back in early 2016. And silver will power much higher soon as the record silver-futures shorts of early September continue to be covered.
While all-in sustaining costs are the single-most-important fundamental measure that investors need to keep an eye on, other metrics offer peripheral reads on the major silver miners’ fundamental health. The more important ones include cash flows generated from operations, GAAP accounting profits, revenues, and cash on hand. As you’d expect given the miserably-low silver prices, they were on the weak side in Q3.
Operating cash flows among these SIL top 17 reporting them fell 23.0% YoY to $830m, which is totally reasonable given the 2.2%-lower silver production and 11.2%-lower average silver prices. Sales fell 9.5% YoY to $2717m, with some of the silver-side weakness offset by the 1.6%-higher gold production. And cash on hand fell 9.8% YoY to a still-hefty $2419m, giving these silver miners plenty of capital to weather this storm.
The hard GAAP accounting profits looked pretty ugly though, plunging to a $243m loss from being $88m in the black in Q3’17. But most of those losses didn’t reflect operations. TAHO alone wrote off a massive $170m for the impairment of Escobal, which reflected an estimated restart date of the end of 2019. Coeur Mining reported a smaller $19m writedown for one of its mines. These two non-cash charges alone were $189m.
Without them GAAP profits would’ve sunk from $88m in Q3’17 to a milder $54m loss in Q3’18. That’s still poor, but not unexpected given the lowest silver prices seen in almost several years. Again silver-mining earnings will soar if not skyrocket as silver inevitably mean reverts higher from here. All it takes for silver to surge in major bull-market uplegs is for gold itself to power higher, and huge gold upleg fuel abounds now.
The silver-mining stocks are doing way better fundamentally than they’ve been given credit for. Their higher Q3’18 mining costs still remained below the recent deep silver lows. And the compressed gap between their AISCs and low prevailing silver prices guarantees epic profits upside as silver recovers and mean reverts higher. That will attract back investors fast, catapulting silver stocks up sharply like in early 2016.
While traders can play that in SIL, this ETF has problems. Its largest component is now a base-metals smelter of all things! And the great majority of its stocks are primary gold miners with byproduct silver production. The best gains by far will be won in smaller purer mid-tier and junior silver miners with superior fundamentals. A carefully-handpicked portfolio of these miners will generate much-greater wealth creation.
The key to riding any silver-stock bull to multiplying your fortune is staying informed, both about broader markets and individual stocks. That’s long been our specialty at Zeal. My decades of experience both intensely studying the markets and actively trading them as a contrarian is priceless and impossible to replicate. I share my vast experience, knowledge, wisdom, and ongoing research through our popular newsletters.
Published weekly and monthly, they explain what’s going on in the markets, why, and how to trade them with specific stocks. They are a great way to stay abreast, easy to read and affordable. Walking the contrarian walk is very profitable. As of Q3, we’ve recommended and realized 1045 newsletter stock trades since 2001. Their average annualized realized gains including all losers is +17.7%! That’s double the long-term stock-market average. Subscribe today and take advantage of our 20%-off holidays sale!
The bottom line is the major silver miners’ fundamentals remain solid based on their recently-reported Q3’18 results. They continue to mine silver at all-in sustaining costs below even mid-November’s deep silver lows. Their profits will multiply dramatically as silver rebounds higher driven by gold’s own upleg and record silver-futures short covering. Investment capital will flood back in, catapulting silver stocks up violently.
So traders need to look through the recent forsaken herd sentiment to understand the silver miners’ hard fundamentals. These left-for-dead stocks are seriously undervalued even at today’s low silver prices, let alone where silver heads during the next major gold upleg. Silver can’t languish at extreme anomalous multi-decade lows relative to gold for long. And once it catches a bid, silver stocks will really amplify its upside.
Adam Hamilton, CPA
November 23, 2018
Copyright 2000 – 2018 Zeal LLC (www.ZealLLC.com)
The major silver miners’ stocks have been thrashed, pummeled to brutal multi-year lows. They suffered serious collateral damage as silver plunged on gold’s breakdown, driven by crazy-extreme all-time-record silver-futures short selling. All this technical carnage left investors reeling, devastating sentiment. The silver miners’ recently-reported Q2’18 results reveal whether their anomalous plunge was justified fundamentally.
Four times a year publicly-traded companies release treasure troves of valuable information in the form of quarterly reports. Companies trading in the States are required to file 10-Qs with the US Securities and Exchange Commission by 45 calendar days after quarter-ends. Canadian companies have similar requirements. In other countries with half-year reporting, many companies still partially report quarterly.
Unfortunately the universe of major silver miners to analyze and invest in is pretty small. Silver mining is a tough business both geologically and economically. Primary silver deposits, those with enough silver to generate over half their revenues when mined, are quite rare. Most of the world’s silver ore formed alongside base metals or gold. Their value usually well outweighs silver’s, relegating it to byproduct status.
The Silver Institute has long been the authority on world silver supply-and-demand trends. It published its latest annual World Silver Survey covering 2017 in mid-April. Last year only 28% of the silver mined around the globe came from primary silver mines! 36% came from primary lead/zinc mines, 23% copper, and 12% gold. That’s nothing new, the silver miners have long supplied less than a third of world mined supply.
It’s very challenging to find and develop the scarce silver-heavy deposits supporting primary silver mines. And it’s even harder forging them into primary-silver-mining businesses. Since silver isn’t very valuable, most silver miners need multiple mines in order to generate sufficient cash flows. Traditional major silver miners are increasingly diversifying into gold production at silver’s expense, chasing its superior economics.
So there aren’t many major silver miners left out there, and their purity is shrinking. The definitive list of these companies to analyze comes from the most-popular silver-stock investment vehicle, the SIL Global X Silver Miners ETF. In mid-August at the end of Q2’s earnings season, SIL’s net assets were running 6.7x greater than its next-largest competitor’s. So SIL continues to dominate this small niche contrarian sector.
While SIL has its flaws, it’s the closest thing we have to a silver-stock index. As ETF investing continues to eclipse individual-stock picking, SIL inclusion is very important for silver miners. It grants them better access to the vast pools of stock-market capital. Differential SIL-share buying by investors requires this ETF’s managers to buy more shares in its underlying component companies, bidding their stock prices higher.
In mid-August as the silver miners were finishing reporting their Q2’18 results, SIL included 23 “Silver Miners”. Unfortunately the great majority aren’t primary silver miners, most generate well under half their revenues from silver. That’s not necessarily an indictment against SIL’s stock picking, but a reflection of the state of this industry. There aren’t enough significant primary silver miners left to fully flesh out an ETF.
This disappointing reality makes SIL somewhat problematic. The only reason investors would buy SIL is they want silver-stock exposure. But if SIL’s underlying component companies generate just over a third of their sales from silver mining, they aren’t going to be very responsive to silver price moves. And most of that ETF capital intended to go into primary silver miners is instead diverted into byproduct silver miners.
So silver-mining ETFs sucking in capital investors thought they were allocating to real primary silver miners effectively starves them. Their stock prices aren’t bid high enough to attract in more investors, so they can’t issue sufficient new shares to finance big silver-mining expansions. This is exacerbating the silver-as-a-byproduct trend. Only sustained much-higher silver prices for years to come could reverse this.
Every quarter I dig into the latest results from the major silver miners of SIL to get a better understanding of how they and this industry are faring fundamentally. I feed a bunch of data into a big spreadsheet, some of which made it into the table below. It includes key data for the top 17 SIL component companies, an arbitrary number that fits in this table. That’s a commanding sample at 95.8% of SIL’s total weighting!
While most of these top 17 SIL components had reported on Q2’18 by mid-August, not all had. Some of these major silver miners trade in the UK or Mexico, where financial results are only required in half-year increments. If a field is left blank in this table, it means that data wasn’t available by the end of Q2’s earnings season. Some of SIL’s components also report in gold-centric terms, excluding silver-specific data.
The first couple columns of this table show each SIL component’s symbol and weighting within this ETF as of mid-August. While most of these stocks trade on US exchanges, some symbols are listings from companies’ primary foreign stock exchanges. That’s followed by each miner’s Q2’18 silver production in ounces, along with its absolute year-over-year change. Next comes this same quarter’s gold production.
Nearly all the major silver miners in SIL also produce significant-to-large amounts of gold! That’s truly a double-edged sword. While gold really stabilizes and boosts silver miners’ cash flows, it also retards their stocks’ sensitivity to silver itself. So the next column reveals how pure these elite silver miners are, approximating their percentages of Q2’18 revenues actually derived from silver. This is calculated two ways.
The large majority of these top SIL silver miners reported total Q2 revenues. Quarterly silver production multiplied by silver’s average price in Q2 can be divided by these sales to yield an accurate relative-purity gauge. When Q2 sales weren’t reported, I estimated them by adding silver sales to gold sales based on their production and average quarterly prices. But that’s less optimal, as it ignores any base-metals byproducts.
Next comes the major silver miners’ most-important fundamental data for investors, cash costs and all-in sustaining costs per ounce mined. The latter directly drives profitability which ultimately determines stock prices. These key costs are also followed by YoY changes. Last but not least the annual changes are shown in operating cash flows generated and hard GAAP earnings, with a couple exceptions necessary.
Percentage changes aren’t relevant or meaningful if data shifted from positive to negative or vice versa, or if derived from two negative numbers. So in those cases I included raw underlying data rather than weird or misleading percentage changes. This whole dataset together offers a fantastic high-level read on how the major silver miners are faring fundamentally as an industry. Was their recent plunge righteous?
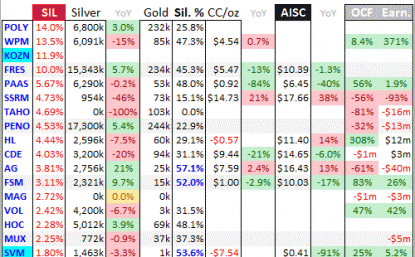
Production is naturally the lifeblood of the silver-mining sector. The more silver and increasingly gold that these elite miners can wrest from the bowels of the earth, the stronger their fundamental positions and outlooks. These top 17 SIL silver miners failed to increase their mining tempos over this past year. Their collective silver and gold production deteriorated 4.4% and 2.1% YoY to 75.1m and 1327k ounces mined.
According to the Silver Institute’s latest WSS, total world silver mine production averaged 213.0m ounces per quarter in 2017. So at 75.1m in Q2, these top 17 SIL components were responsible for 35.3% of that rate. And their overall production decline last quarter is misleading, heavily skewed by two outliers with unusual situations. Tahoe Resources and SSR Mining reported huge 100.0% and 46.3% YoY production plunges!
Without TAHO and SSRM, the rest of these elite silver miners were able to grow their collective silver production by a decent 2.0% YoY. That’s impressive considering the miserable silver-price environment. Between Q2’17 and Q2’18, the average quarterly silver price slumped 3.9% to $16.51. That was really weak compared to gold, which actually rose 3.9% in quarterly-average terms to $1306 across these quarters.
Silver has always been driven by gold, effectively acting like a gold sentiment gauge. Generally big silver uplegs only happen after gold has rallied long enough and high enough to convince traders its gains are sustainable. Then the way-smaller silver market tends to start leveraging and amplifying gold’s moves by 2x to 3x. But gold sentiment was so insipid over this past year that no excitement was sparked for silver.
Yet the top 17 SIL silver miners excluding TAHO and SSRM were able to buck those silver headwinds to still grow production. That is setting up these companies for stronger profits growth once silver’s price inevitably mean reverts higher. It’s important to understand what’s going on with TAHO and SSRM though, as these are long-time favorites among American investors. TAHO’s silver production should return.
Tahoe was originally spun off by Goldcorp to develop the incredible high-grade Escobal silver mine in Guatemala, which went live in Q4’13. Everything went well for its first few years. By Q1’17, Escobal was a well-oiled machine producing 5700k ounces of silver. That provided 1000+ great high-paying jobs to locals and contributed big taxes to Guatemala’s economy. Escobal was a great economic boon for this country.
But a radical group of anti-mining activists managed to spoil everything, cruelly casting their fellow countrymen out of work. They filed a frivolous and baseless lawsuit against Guatemala’s Ministry of Energy and Mines, Tahoe wasn’t even the target! It alleged this regulator had not sufficiently consulted with the indigenous Xinca people before granting Escobal’s permits. And they don’t even live around this mine site.
Only in a third-world country plagued with rampant government corruption would a regulator apparently not holding enough meetings be a company’s problem. Instead of resolving this, a high Guatemalan court inexplicably actually suspended Escobal’s mining license in early Q3’17! Tahoe was forced to temporarily mothball its crown-jewel silver mine, and thus eventually lay off its Guatemalan employees.
That license was technically reinstated a couple months later, but the activists appealed to a higher court. It required the regulator to study the indigenous people in surrounding areas and report back, and now needs to make a decision. The government also needs to clear out an illegal roadblock to the mine site by violent anti-mine militants, who have blockaded Escobal supplies and physically attacked trucks and drivers!
So Escobal has been dead in the water with zero production for an entire year, an unthinkable outcome. This whole thing is a farce, a gross miscarriage of justice. Sooner or later the Guatemalan bureaucrats will get all their useless paperwork done and Escobal will come back online. After a few quarters or so of spinning back up, Escobal’s silver production should return to pre-fiasco levels around 5700k ounces a quarter.
That would boost SIL’s top 17 components’ current overall silver production by 7.6%. In my decades of intensely researching and actively trading mining stocks, I’ve never seen anything like this Escobal debacle. While TAHO’s cashflows are really impaired without this silver mine which was actually the world’s largest primary, it can weather this nightmare because of its other gold mines that yielded 102.6k ounces in Q2’18.
Thankfully SSR Mining’s silver-production plunge is far less dramatic. This company used to be known as Silver Standard Resources, and its old Pirquitas silver mine is simply depleting as forecast. SSRM is exploring in the area trying to extend the life of this old mine, which was joint-ventured and renamed the Puna Operations. But most of SSRM’s resources are being poured into its far-more-profitable gold mines.
That gold focus among these top silver miners is common across SIL’s components. As the silver-percentage column above shows, most of these elite silver miners are actually primary gold miners by revenue! Only 3 of these 17 earned more than half of their Q2’18 sales from mining silver, and they are highlighted in blue. WPM, PAAS, and TAHO are also top-34 components in the leading GDX gold miners’ ETF!
While they only comprised 7.8% of GDX’s total weighting in mid-August, this highlights how difficult it is to find primary silver miners. SIL’s managers have an impossible job these days with the major silver miners increasingly shifting to gold. They are really scraping the bottom of the barrel to find more silver miners. In Q3’17 they added Korea Zinc, and it’s now SIL’s 3rd-biggest holding with a hefty 11.9% total weighting.
That was intriguing, as I’d never heard of this company after decades deeply immersed in this small silver-mining sector. So I looked into Korea Zinc and found it was merely a smelter, not even a miner! Its English-language disclosures are atrocious, starting with its homepage reading “We are Korea Zinc, the world’s one of the best smelting company”. The latest production data I can find in English is still 2015’s.
That year Korea Zinc “produced” 63.3m ozs of silver, which averages to 15.8m quarterly. That is largely a byproduct from its main businesses of smelting zinc, lead, copper, and gold. The fact SIL’s managers included a company like this that doesn’t even mine silver as a top SIL component shows how rare major silver miners have become. The economics of silver mining at today’s prices are way inferior to gold mining.
The traditional major silver miners are painfully aware of this, and have spent years actively diversifying into gold. In Q2’18, the average percentage of revenues these top 17 SIL miners derived from silver was only 36.3%. That’s right in line with the recent trend, with the prior four quarters seeing 36.1%, 39.3%, 35.3%, and 36.4%. This relatively-low silver exposure is why SIL isn’t as responsive to silver as investors expect.
Silver mining is every bit as capital-intensive as gold mining, requiring similar large expenses for planning, permitting, and constructing mines and mills. It needs similar heavy excavators and haul trucks to dig and move the silver-bearing ore. Similar levels of employees are necessary to run these mines. But silver generates much lower cash flows due to its lower price. Consider hypothetical mid-sized silver and gold mines.
They might produce 10m and 300k ounces annually. At last quarter’s average prices, these silver and gold mines would yield $165m and $392m of yearly sales. Unfortunately it is far easier to pay the bills mining gold these days. So primary silver miners are increasingly becoming a dying breed, which is sad. The traditional major silver miners are adapting by ramping their gold production often at silver’s expense.
This industry’s flagging silver purity and thus deteriorating responsiveness to silver price trends will be hard to reverse. Silver would need to far outperform gold, rocketing higher in one of its gigantic uplegs while gold lags. And it would have to stay relatively strong compared to gold for years after that to entice big capital spending back into primary silver mines. While possible, that seems like a stretch in today’s markets.
Unfortunately SIL’s mid-August composition was such that there wasn’t a lot of Q2 cost data reported by its top component miners. A half-dozen of these top SIL companies trade in the UK, South Korea, Mexico, and Peru, where reporting only comes in half-year increments. There are also primary gold miners that don’t report silver costs, and a silver explorer with no production. So silver cost data remains scarce.
Nevertheless it’s always useful to look at what we have. Industrywide silver-mining costs are one of the most-critical fundamental data points for silver-stock investors. As long as the miners can produce silver for well under prevailing silver prices, they remain fundamentally sound. Cost knowledge helps traders weather this sector’s occasional fear-driven plunges without succumbing to selling low like the rest of the herd.
There are two major ways to measure silver-mining costs, classic cash costs per ounce and the superior all-in sustaining costs. Both are useful metrics. Cash costs are the acid test of silver-miner survivability in lower-silver-price environments, revealing the worst-case silver levels necessary to keep the mines running. All-in sustaining costs show where silver needs to trade to maintain current mining tempos indefinitely.
Cash costs naturally encompass all cash expenses necessary to produce each ounce of silver, including all direct production costs, mine-level administration, smelting, refining, transport, regulatory, royalty, and tax expenses. In Q2’18, these top 17 SIL-component silver miners that reported cash costs averaged just $3.95 per ounce! That plunged a whopping 37.6% YoY, making it look like these miners are getting more efficient.
But that’s misleading. Because of hefty byproduct credits from gold and base metals, Hecla Mining and Fortuna Silver Mines both reported negative cash costs in Q2. They are an accounting fiction, as mining silver still costs a lot of money. But crediting byproduct sales to silver can slash reported cash costs. In the comparable quarter a year earlier, there were no negative cash costs at any of SIL’s top 17 miners.
Those super-low cash costs offset SSR Mining’s crazy-high $14.73 per ounce. That’s not normal either, the result of that winding down of its lone silver mine. Excluding these extreme outliers, the remaining handful of silver miners had average cash costs of $4.83 per ounce. As long as silver prices stay above those levels, the silver miners can keep the lights on at their mines. Sub-$5 silver is wildly inconceivable!
Way more important than cash costs are the far-superior all-in sustaining costs. They were introduced by the World Gold Council in June 2013 to give investors a much-better understanding of what it really costs to maintain silver mines as ongoing concerns. AISCs include all direct cash costs, but then add on everything else that is necessary to maintain and replenish operations at current silver-production levels.
These additional expenses include exploration for new silver to mine to replace depleting deposits, mine-development and construction expenses, remediation, and mine reclamation. They also include the corporate-level administration expenses necessary to oversee silver mines. All-in sustaining costs are the most-important silver-mining cost metric by far for investors, revealing silver miners’ true operating profitability.
In Q2’18 these top 17 SIL miners reporting AISCs averaged just $10.93 per ounce! That was down 6.3% YoY, and was way below silver’s average price of $16.51 last quarter. Even if the two extreme outliers are thrown out, SSRM’s abnormally-high mine-depletion $17.66 AISC and SVM’s incredibly-low huge-byproduct-credit $0.41 AISC, the remaining average is similar at $11.56. Silver mining remains very profitable!
Even at worst in August’s plunge driven by speculators’ crazy-extreme all-time-record silver-futures short selling, silver merely hit $14.44 on close. That’s still way above this industry’s total production costs any way you slice it. That implies even at peak fear the elite top silver miners of SIL were still earning hefty 24% profit margins! So there’s no doubt the recent frantic silver-stock selling wasn’t fundamentally righteous.
SIL getting hammered to deep 2.5-year lows in mid-August was the product of irrational fear run amok, it had nothing to do with how the silver miners are faring. At Q2’s average silver price and AISCs, these miners were earning $5.58 per ounce. Most other industries would die for such 34% margins. And those are going to explode higher as silver inevitably mean reverts back up again, probably violently given this setup.
Silver stocks plunged in August because silver did. That was driven by truly-extreme silver-futures short selling by speculators. They ramped their shorts to a wild new all-time record high of 114.5k contracts in mid-August! All that short selling is guaranteed proportional near-future buying, as excessive shorts must be closed by buying offsetting long contracts. Short-covering rallies are self-feeding, catapulting silver higher.
The more speculators buy to cover, the faster silver surges. The faster it surges, the more they have to buy to cover or face catastrophic losses due to the extreme leverage inherent in silver futures. It would take 73.0k contracts of buying to return spec shorts to their 52-week low seen in mid-September 2017. That’s the equivalent of 364.9m ounces, or nearly 43% of last year’s entire global mined supply! Talk about big.
And today’s silver prices are super-low relative to prevailing gold levels, portending huge mean-reversion upside. The long-term average Silver/Gold Ratio runs around 56x, which means it takes 56 ounces of silver to equal the value of one ounce of gold. Silver is greatly underperforming gold so far in 2018, with the SGR averaging a stock-panic-like 80.2x thus far in August! So silver is overdue to catch up with gold.
At a 56x SGR and $1200 gold, silver is easily heading near $21.50. That’s 30% above its Q2 average. Assuming the major silver miners’ all-in sustaining costs hold, that implies profits per ounce soaring 89% higher! And the record silver-futures short covering necessary after record silver-futures short selling is very likely to fuel a massive mean-reversion overshoot, making the silver-mining-profits upside much greater.
And silver miners’ AISCs generally don’t change much regardless of prevailing silver prices, since silver-mining costs are largely fixed during mine planning and construction. The top 17 SIL miners’ AISCs in the past four quarters averaged $11.66, $9.73, $10.16, and $10.92. So Q2’18’s $10.93 was right in line. Costs aren’t going to rise much as silver recovers, and higher production may even push them lower still.
While all-in sustaining costs are the single-most-important fundamental measure that investors need to keep an eye on, other metrics offer peripheral reads on the major silver miners’ fundamental health. The more important ones include cash flows generated from operations, GAAP accounting profits, revenues, and cash on hand. They were all decent to healthy in Q2’18 despite the low silver prices and weak sentiment.
These SIL-top-17 silver miners’ collective revenues only fell 1.5% YoY to $3114m. That reflects higher gold prices which offset the lower silver ones. That drove operating-cash-flow generation of $758m, which was 27.0% lower YoY. That’s not unreasonable given the 3.9% lower average silver prices from Q2’17 to Q2’18 and the 4.4% lower silver production among these elite silver majors. Cash flows remain fine.
These silver miners’ balance-sheet cash and short-term investments still powered 18.0% higher YoY to $3637m. The bigger their cash hoards, the easier the elite silver miners can weather these weak silver prices. Big treasuries also give them more capital to expand existing mines and buy or build new ones. A fundamental surprise seemed to come in hard GAAP accounting profits though, which soared 110.6% YoY!
But the $343m total earnings in Q2’18 were wildly skewed by a huge $246m non-recurring gain Wheaton Precious Metals reported. 77% of its massive $318m in profits came from gains on the sale of one of its silver streams. Back that out of overall top-17-SIL-component earnings, and they actually plunged 40.3% YoY. But they were still positive at $97m, and have incredible upside potential as silver’s price inevitably recovers.
The silver-mining stocks are doing way better fundamentally than they’ve been given credit for. Their mining costs remain far below prevailing silver levels, driving strong profitability even at August’s deep silver-price lows. That capitulation silver-stock plummeting fueled by cascading selling as stop losses were sequentially run wasn’t justified fundamentally. It was an extreme sentiment anomaly that can’t persist.
So a big mean-reversion rebound higher is inevitable and imminent. While traders can play that in SIL, that’s mostly a bet on primary gold miners with byproduct silver production. The best gains by far will be won in smaller purer mid-tier and junior silver miners with superior fundamentals. A carefully-handpicked portfolio of these miners will generate much-greater wealth creation than ETFs dominated by non-primary miners.
At Zeal we’ve literally spent tens of thousands of hours researching individual silver stocks and markets, so we can better decide what to trade and when. As of the end of Q2, this has resulted in 1012 stock trades recommended in real-time to our newsletter subscribers since 2001. Fighting the crowd to buy low and sell high is very profitable, as all these trades averaged stellar annualized realized gains of +19.3%!
The key to this success is staying informed and being contrarian. That means buying low when others are scared, before undervalued silver stocks soar much higher. An easy way to keep abreast is through our acclaimed weekly and monthly newsletters. They draw on my vast experience, knowledge, wisdom, and ongoing research to explain what’s going on in the markets, why, and how to trade them with specific stocks. Subscribe today while great silver stocks remain dirt-cheap!
The bottom line is the major silver miners’ fundamentals remain solid based on their recently-reported Q2’18 results. They continue to mine silver at all-in sustaining costs far below even mid-August’s deep silver lows. Their still-impressive profits will multiply as silver rebounds higher violently on record futures short covering. Investment capital will flood back into this tiny sector, catapulting silver stocks up sharply.
So traders need to look through the recent frightened herd sentiment to understand the silver miners’ hard fundamentals. These forsaken stocks are radically undervalued even at today’s low silver prices, let alone where silver heads during the next major gold upleg. Silver is poised to rocket higher soon as that mandatory extreme short covering gets underway. So the opportunities to buy dirt-cheap miners are fleeting.
Last week GDX and GDXJ were down almost 12% at their lows on Thursday. Since then, they’ve recovered but only a tiny fraction of recent losses.
The crash did result in the miners reaching an extreme oversold condition while trading around long-term support at their December 2016 lows. It was the perfect setup for shorts to cover. That combination often results in at least a relief rally.
While a rally is underway, where it goes from here remains to be seen.
One thing to keep in mind, the recent decline was the result of a technical breakdown that followed months and months of consolidation. It’s extremely unlikely to immediately reverse course.
With that said, let’s keep in mind the measured downside targets.
For GDX, the downside target is $16.50-$17.00. For GDXJ, it’s $23-$24 and for Silver it is $12.70-$13.10.
On the sentiment front we should note that Gold’s net speculative position reached 1.5% of open interest. That is the second lowest reading in the past 17 years. Does that mean this is December 2015 or 2001 for Gold?
Do note that sentiment was at a similar level twice in 2013 and Gold trended lower after a rebound. Moreover, look at what happened in the 1980s and 1990s.
With the net speculative position already down to 1.5%, it figures to go negative if Gold is going to test its low at $1040/oz or even $1000/oz. If you think sentiment cannot get worse, think again.
Ultimately, its not sentiment or technicals that will decide a major bottom but fundamentals. After studying decades of history as well as the current market environment, we became convinced that precious metals will not begin a bull market until the Federal Reserve is done hiking rates.
Consider the following.
Over the past 60 years, in 10 of the last 12 rate hike cycles gold stocks boast an average gain of 185% with a minimum gain of 54%. The advance began on average one month and a median of two months after the Fed Funds rate peaked.
The precious metals sector is currently extremely oversold and a relief rally is underway. It should last at least a few more weeks and maybe a few months. However, the primary trend is down and there are downside targets that are even lower. Our plan is to let the rally run its course and when the time is right, go short again.
The mega-cap stocks that dominate the US markets are just finishing another monster earnings season. It wasn’t just profits that soared under Republicans’ big corporate tax cuts, but sales surged too. That’s no mean feat for massive mature companies, but sustained growth at this torrid pace is impossible. So peak-earnings fears continue to mount while valuations shoot even higher into dangerous bubble territory.
Four times a year publicly-traded companies release treasure troves of valuable information in the form of quarterly reports. Required by the US Securities and Exchange Commission, these 10-Qs contain the best fundamental data available to investors and speculators. They dispel all the sentimental distortions inevitably surrounding prevailing stock-price levels, revealing the underlying hard fundamental realities.
The deadline for filing 10-Qs for “large accelerated filers” is 40 days after fiscal quarter-ends. The SEC defines this as companies with market capitalizations over $700m. That currently includes every single stock in the flagship S&P 500 stock index, which includes the biggest and best American companies. As Q2’18 ended, the smallest SPX stock had a market cap of $4.1b which was 1/225th the size of leader Apple.
The middle of this week marked 39 days since the end of calendar Q2, so almost all of the big US stocks of the S&P 500 have reported. The exceptions are companies running fiscal quarters out of sync with calendar quarters. Walmart, Home Depot, Cisco, and NVIDIA have fiscal quarters ending a month after calendar ones, so their “Q2” results weren’t out yet as of this Wednesday. They’ll arrive in coming weeks.
The S&P 500 (SPX) is the world’s most-important stock index by far, weighting the best US companies by market capitalization. So not surprisingly the world’s largest and most-important ETF is the SPY SPDR S&P 500 ETF which tracks the SPX. This week it had huge net assets of $271.3b! The IVV iShares Core S&P 500 ETF and VOO Vanguard S&P 500 ETF also track the SPX with $155.9b and $96.6b of net assets.
The vast majority of investors own the big US stocks of the SPX, as they are the top holdings of nearly all investment funds. So if you are in the US markets at all, including with retirement capital, the fortunes of the big US stocks are very important for your overall wealth. Thus once a quarter after earnings season it’s essential to check in to see how they are faring fundamentally. Their results also portend stock-price trends.
Unfortunately my small financial-research company lacks the manpower to analyze all 500 SPX stocks in SPY each quarter. Support our business with enough newsletter subscriptions, and I would gladly hire the people necessary to do it. For now we’re digging into the top 34 SPX/SPY components ranked by market capitalization. That’s an arbitrary number that fits neatly into the tables below, and a dominant sample.
As of the end of Q2’18 on June 29th, these 34 companies accounted for a staggering 42.6% of the total weighting in SPY and the SPX itself! These are the mightiest of American companies, the widely-held mega-cap stocks everyone knows and loves. For comparison, it took the bottom 431 SPX companies to match its top 34 stocks’ weighting! The entire stock markets greatly depend on how the big US stocks are doing.
Every quarter I wade through the 10-Q SEC filings of these top SPX companies for a ton of fundamental data I dump into a spreadsheet for analysis. The highlights make it into these tables below. They start with each company’s symbol, weighting in the SPX and SPY, and market cap as of the final trading day of Q2’18. That’s followed by the year-over-year change in each company’s market capitalization, a critical metric.
Major US corporations have been engaged in a wildly-unprecedented stock-buyback binge ever since the Fed forced interest rates to deep artificial lows during 2008’s stock panic. Thus the appreciation in their share prices also reflects shrinking shares outstanding. Looking at market-cap changes instead of just underlying share-price changes effectively normalizes out stock buybacks, offering purer views of value.
That’s followed by quarterly sales along with their YoY changes. Top-line revenues are one of the best indicators of businesses’ health. While profits can be easily manipulated quarter-to-quarter by playing with all kinds of accounting estimates, sales are tougher to artificially inflate. Ultimately sales growth is necessary for companies to expand, as bottom-line earnings growth driven by cost-cutting is inherently limited.
Operating cash flows are also important, showing how much capital companies’ businesses are actually generating. Using cash to make more cash is a core tenet of capitalism. Unfortunately most companies are now obscuring quarterly OCFs by reporting them in year-to-date terms, which lumps in multiple quarters together. So these tables only include Q2 operating cash flows if specifically broken out by companies.
Next are the actual hard quarterly earnings that must be reported to the SEC under Generally Accepted Accounting Principles. Late in bull markets, companies tend to use fake pro-forma earnings to downplay real GAAP results. These are derided as EBS earnings, Everything but the Bad Stuff! Companies often arbitrarily ignore certain expenses on a pro-forma basis to artificially boost their profits, which is very misleading.
While we’re also collecting the earnings-per-share data Wall Street loves, it’s more important to consider total profits. Stock buybacks are executed to manipulate EPS higher, because the shares-outstanding denominator of its calculation shrinks as shares are repurchased. Raw profits are a cleaner measure, again effectively neutralizing the impacts of stock buybacks. They better reflect underlying business performance.
Finally the trailing-twelve-month price-to-earnings ratio as of the end of Q2’18 is noted. TTM P/Es look at the last four reported quarters of actual GAAP profits compared to prevailing stock prices. They are the gold-standard metric for valuations. Wall Street often intentionally obscures these hard P/Es by using the fictional forward P/Es instead, which are literally mere guesses about future profits that often prove far too optimistic.
Not surprisingly in the second quarter under this new slashed-corporate-taxes regime, many of the mega-cap US stocks reported spectacular Q2’18 results. For the most part sales, OCFs, and earnings surged dramatically. The big problem is such blistering tax-cut-driven growth rates are impossible to sustain for long at the vast scales these huge companies operate at. Downside risks are serious with bubble valuations.
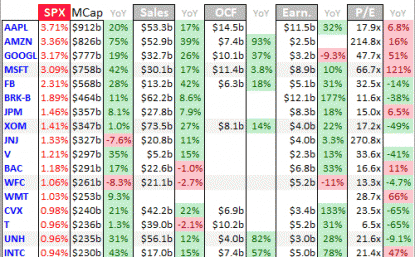
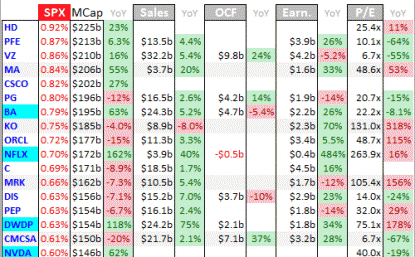
The elite market-darling mega tech stocks continue to dominate the US stock markets. Most famous are the FANG names, Facebook, Amazon, Netflix, and Alphabet which used to be called Google. Apple and Microsoft should be added to those rarified beloved ranks. Together these half-dozen companies alone accounted for nearly 1/6th of the SPX’s entire market cap! That’s an incredible concentration of capital.
This highlights the extreme narrowing breadth behind this very-late-stage bull market. At the month-end just before Trump’s election victory in early November 2016, these same tech giants weighed in at 12.3% of the SPX weighting compared to 16.4% today. And if you go all the way back to this bull’s birth month of March 2009, MSFT, GOOGL, AAPL, and AMZN weighed in at 5.4%. FB and NFLX weren’t yet in the SPX.
Ever more capital is crowding into fewer and fewer stocks as fund managers chase the biggest winners and increasingly pile into them. And these 6 elite mega techs’ Q2’18 results show why they are widely adored. Their revenues rocketed 30.3% YoY on average, more than doubling the 14.0% growth in this entire top-34 list! Excluding these techs, the rest of the top 34 only grew their sales by 10.0% or a third as much.
That vast outperformance is reflected in their market-cap gains too, which again normalize out all the big stock buybacks. Overall these top SPY companies’ values surged 23.5% higher YoY, nearly doubling the 12.2% SPX gain from the ends of Q2’17 to Q2’18. But these top 6 tech stocks’ stellar average gains of 57.5% YoY dwarfed the rest of the top 34’s 16.2% annual appreciation! These stocks are loved for good reason.
The same is true on the profits front, with AAPL, AMZN, GOOGL, MSFT, FB, and NFLX trouncing the rest of these biggest US stocks. These 6 tech giants saw staggering average earnings growth of 289.1% YoY, compared to 30.9% for the rest of the top 34. That former number is heavily skewed by Amazon’s results though, as its profits skyrocketed an astounding 1186% from $197m in Q2’17 to $2534m in Q2’18.
Netflix had a similar enormous 484% YoY gain in earnings from a super-low level. Interestingly the rest of these big 6 tech stocks saw average growth of just 16.0% YoY, only about half that of the rest of the top 34. That proves the enormous surge in mega-cap-tech stock prices over this past year wasn’t driven by earnings as bulls often claim. Stock-price appreciation has far outstretched profits growth, an ominous sign.
In conservative hard trailing-twelve-month price-to-earnings-ratio terms, the big-6 tech giants sported an incredible average P/E of 107.3x earnings exiting Q2! That is deep into formal stock-bubble territory over 28x, which is itself double the century-and-a-quarter average fair value of 14x in the US stock markets. Again AMZN and NFLX are skewing this way higher though, with their insane 214.8x and 263.9x P/E ratios.
P/Es are the annual ratio of prevailing stock-price levels to underlying profits. So they can be viewed as the number of years it would take a company to earn back the price new investors today are paying for it. A stock bought at 200x earnings would take 200 years to merely recoup its purchase price through profits, assuming no growth of course. Buying at these heights is crazy given humans’ relatively-short investing lifespan.
Assuming people start investing young at 25 years old and retire at 65, that gives them about 40 years of prime investing time. So buying any stock above 40x implies a time horizon well beyond what anyone actually has. And provocatively even excluding the crazy P/Es of Amazon and Netflix, the rest of these big 6 tech stocks still average extremely-high 41.2x P/Es. And ominously that is right in line with market averages.
Without those elite tech leaders, the rest of these top 34 SPY stocks had average TTM P/Es of 41.0x when they exited Q2. History has proven countless times that buying stocks near such extreme bubble valuations has soon led to massive losses in the subsequent bear markets that always follow bulls. So these stock markets are extraordinarily risky at these valuations, truly an accident waiting to happen.
When stocks are exceedingly overvalued, the downside risks are radically greater than upside potential. After everyone is effectively all-in one of these universally-held mega tech stocks, there aren’t enough new buyers left to drive them higher no matter how good news happens to be. And these investors who bought in high and late can quickly become herd sellers when some bad news inevitably comes to pass.
Q2’18’s earnings season has already proven this in spades despite the extreme euphoria surrounding the stock markets and elite tech stocks in particular. Fully 3 of the 4 beloved FANG stocks showed just how overbought stocks react to news. The recent price action in Amazon, Netflix, and Facebook following their Q2 results is a serious cautionary tale for investors convinced mega tech stocks can rally indefinitely.
Everyone loves Amazon, but it is priced far beyond perfection. Its stock skyrocketed 75% YoY to leave Q2 with that ludicrous P/E of 214.8x. When any stock gets so radically overbought and overvalued, it has a tough time moving materially higher no matter what happens. Normally stocks shoot higher on blowout quarterly results as new investors flood into the strong company. But Amazon couldn’t find many buyers.
After the close on July 26th Amazon reported a monster blowout Q2. Its earnings per share of $5.07 was more than double analysts’ estimate of $2.50! Revenues, operating cash flows, and profits rocketed up an astounding 39.3%, 93.5%, and 1186.3% YoY. AMZN’s revenue guidance for Q3 at a midpoint running $55.8b also hit the low end of Wall Street expectations. Any normal stock would soar the next day on all that.
But while Amazon stock mustered a decent 4.0% gain at best the next day, that faded to a mere +0.5% close. AMZN was priced for perfection, so not even one of its best quarters ever was enough to bring in more buyers. Everyone already owns it, so who is left to deploy new capital? AMZN slumped 1.7% over the next several trading days, though it has since recovered to new record highs with the strong stock markets.
Netflix was the best-performing large US stock over the past year, skyrocketing 162% higher between the ends of Q2’17 to Q2’18! It had an absurd TTM P/E of 263.9x leaving Q2, more extreme than Amazon’s. But man, investors love Netflix with a quasi-religious fervor and believe it can do no wrong at any price. So Wall Street was eagerly anticipating NFLX’s Q2 results that came out after the close back on July 16th.
And they were really darned good. EPS of $0.85 beat the expectations of $0.79. On an absolute basis, sales and profits soared 40.3% and 484.3% YoY! Netflix did report negative operating cash flows, but it has been burning cash forever so that was no surprise. Yet despite these strong results this priced-for-perfection market-darling stock plunged 13%ish in after-hours trading! Good news wasn’t good enough.
Investors weren’t happy because subscriber growth was slowing. NFLX reported 5.2m net new streaming subscriptions in Q2, below the 6.3m expected and 7.4m in Q1. Netflix itself had provided earlier guidance of 1.2m US adds, but the actual was way short at 0.7m. So NFLX stock plummeted as much as 14.1% the next trading day before rebounding to a still-ugly -5.2% close. It couldn’t rally on great Q2 financial results.
And universally-held big stocks not responding favorably to quarterly results can quickly damage traders’ euphoric enthusiasm for them. The selling in Netflix’s stock gradually cascaded following that big hit on Q2 results. Over the next couple weeks, NFLX dropped 16.4% from its close just before that Q2 earnings release! The mega tech stocks aren’t invincible, and are very risky trading so high with everyone all-in.
With the possible exception of mighty Apple, Facebook was widely considered the least risky of the elite tech stocks as Q2 ended. Its 32.5x P/E was almost low by mega-tech standards, only bested by the 17.9x of Apple which is in a league of its own. FB reported after the close on July 25th, and shared great results led by a modest EPS beat of $1.74 compared to $1.72 expected. But the absolute gains were really big.
Facebook’s sales, operating cash flows, and profits soared 41.9%, 17.5%, and 31.1% YoY! That top-line revenue growth in particular was huge, nearly the best out of all these top 34 SPY stocks. And FB’s profits were growing so fast that it was the only elite mega-tech stock to see its TTM P/E actually decline YoY, retreating 14.2%. So FB looked much safer fundamentally than the other FANG stocks dominating the SPX.
But Facebook’s stock effectively crashed in after-hours trading immediately after those Q2 results, falling as much as 24%! The reason? It guided to slowing sales growth in Q3 and Q4 in the high single digits. FB was obviously priced for perfection and universally owned too, leaving nothing but herd sellers when anything finally disappointed. The next day FB stock plummeted a catastrophic 19.0%, stunning investors.
That wiped out an inconceivable $119.4b in market capitalization! That was the worst ever seen in one day by any single company in US stock-market history. More than ever investors and speculators need to realize that their beloved FANG stocks along with MSFT and AAPL aren’t magically exempt from serious selloffs. When any stocks are way overbought and wildly overvalued, it’s only a matter of time until selling hits.
Without these mega tech stocks, the US stock markets never would’ve gotten anywhere close to their current near-record heights. The flood of investment capital into Netflix over this past year was so huge it catapulted that company well into the ranks of the top 34. Its symbol is highlighted in light blue, along with a few other stocks, because it is new in the SPX’s top 34 in Q2. Outsized tech gains can’t happen forever.
Interestingly I found something else in their quarterly reports I haven’t yet seen discussed elsewhere. The total debt of these top 6 mega tech stocks soared an average of 36.5% higher YoY! That is way beyond the rest of the top 34 excluding the giant banks which have very-different balance sheets. Those other 18 top-34 SPY companies saw total debt only climb 6.0% YoY. Mega-tech debt is rocketing at 6.1x that rate!
While the elite tech stocks do have huge cash hoards, their spiraling debt is ominous. With the Fed deep into its latest rate-hike cycle, the carrying costs of debt are rising fast. With each passing month and each bond companies roll over, their interest expenses increase. At best those will cut into their profits, which will push their nosebleed P/Es even higher. They will have to slow debt growth and eventually pay back much.
We are talking huge amounts, $588.2b of total debt across Apple, Amazon, Google, Microsoft, Facebook, and Netflix alone! The main reason most of these companies are ramping their debt so fast is to finance massive stock buybacks propelling their share prices higher. They will have to really slow or even stop their huge buyback campaigns if their total debt or the carrying costs on it grow too large, a serious threat now.
These top 34 SPX stocks collectively had an extreme average trailing-twelve-month price-to-earnings ratio of 53.4x leaving Q2! That is nearly double historical bubble levels, exceedingly dangerous. There are far-higher odds the next major move in these hyper-expensive stock markets will be down rather than up. The next couple quarters face very different psychology and monetary winds than this rallying past year.
In both Q3 and Q4 last year, traders were ecstatic over the Republicans’ record corporate tax cuts that were excitingly nearing. In Q1 and Q2 this year, traders were dazzled by the incredible profits growth largely driven by sharply-lower taxes. While that will continue to some extent in Q3 and Q4 this year, the initial exuberance has mostly run its course. Big US stocks are facing tougher comparables going forward.
But the real threat to these bubblicious extreme stock markets is the Fed’s young quantitative-tightening campaign. It started imperceptibly in Q4’17 to begin unwinding the staggering $3625b of quantitative-easing money printing the Fed unleashed over 6.7 years starting in late 2008. Total QT in Q4’17 was just $30b. But it grew to another $60b in Q1’18 and then another $90b in Q2’18. And it is still getting bigger.
In this current Q3’18, another $120b of QE is going to be wiped out by QT. And finally in Q4’18, this new Fed QT will hit its terminal speed of $150b per quarter. That’s expected to last for some time. If the Fed merely wants to reverse just half of its extreme QE, it will have to run QT at that full-speed $50b-per-month pace for fully 2.5 years. That extreme monetary-destruction headwind is unprecedented in world history.
Today’s enormous stock bull grew so extreme because the Fed’s epic QE levitated stock markets, driving their valuations to nosebleed heights. What Fed QE giveth, Fed QT taketh away. At the same time the European Central Bank is tapering its own colossal QE campaign to nothing too. Between the Fed and ECB alone, 2018 will see $900b less central-bank liquidity than 2017! That’s certainly going to leave a mark.
The odds are very high that a major new bear market is awakening. Stock markets inexorably levitated by long years of extreme central-bank easing now face record tightening as that easing finally starts to be unwound. Thanks to that extreme QE as well as the Fed’s radically-unprecedented 7-year-long zero-interest-rate policy, this SPX bull extended to a monster 324.6% gain over 8.9 years as of its late-January peak!
That is nearly the second-largest and easily the second-longest stock bull in all of US history. Stock bulls always eventually peak in extreme euphoria, and then give way to subsequent proportional bears. With today’s valuations so deep into dangerous bubble territory, not even blowout earnings will be enough to keep stocks from sliding. Normal bear markets after normal bulls often maul stock markets down 50% off highs!
And after this epic QE-fueled largely-artificial monster stock bull, the inevitable bear to come is very likely to prove much bigger and meaner than normal. If the Fed’s QT doesn’t spawn it, peak earnings will. The past year’s extreme growth rates in sales and profits at the largest US companies from already-high base levels aren’t sustainable mathematically. Traders will freak out when they see growth slow or even reverse.
Investors really need to lighten up on their stock-heavy portfolios, or put stop losses in place, to protect themselves from the coming central-bank-tightening-triggered valuation mean reversion in the form of a major new stock bear. Cash is king in bear markets, as its buying power grows. Investors who hold cash during a 50% bear market can double their stock holdings at the bottom by buying back their stocks at half-price!
SPY put options can also be used to hedge downside risks. They are still relatively cheap now with complacency rampant, but their prices will surge quickly when stocks start selling off materially again. Even better than cash and SPY puts is gold, the anti-stock trade. Gold is a rare asset that tends to move counter to stock markets, leading to soaring investment demand for portfolio diversification when stocks fall.
Gold surged nearly 30% higher in the first half of 2016 in a new bull run that was initially sparked by the last major correction in stock markets early that year. If the stock markets indeed roll over into a new bear soon, gold’s coming gains should be much greater. And they will be dwarfed by those of the best gold miners’ stocks, whose profits leverage gold’s gains. Gold stocks skyrocketed 182% higher in 2016’s first half!
Absolutely essential in bear markets is cultivating excellent contrarian intelligence sources. That’s our specialty at Zeal. After decades studying the markets and trading, we really walk the contrarian walk. We buy low when few others will, so we can later sell high when few others can. While Wall Street will deny the coming stock-market bear all the way down, we will help you both understand it and prosper during it.
We’ve long published acclaimed weekly and monthly newsletters for speculators and investors. They draw on my vast experience, knowledge, wisdom, and ongoing research to explain what’s going on in the markets, why, and how to trade them with specific stocks. As of the end of Q2, all 1012 stock trades recommended in real-time to our newsletter subscribers since 2001 averaged stellar annualized realized gains of +19.3%! Subscribe today and take advantage of our 20%-off summer-doldrums sale before it ends.
The bottom line is the big US stocks’ latest quarterly results again proved amazingly good. Sales and profits soared year-over-year on those record corporate tax cuts and the widespread optimism they fueled. But earnings are still way too low to justify today’s super-high stock prices, spawning dangerous bubble valuations. That portends far-weaker markets ahead, led by serious selling in market-darling mega techs.
These near-record-high stock markets are reaching buying exhaustion, when stocks can’t rally much on good news and plummet on bad news. Earnings are likely peaking with the corporate-tax-cut euphoria as well, with deteriorating profits growth ahead. As if that’s not worrisome enough for hyper-overvalued stocks, these priced-for-perfection markets face accelerating Fed QT in coming quarters. Talk about bearish!

Although precious metals have not rebounded too strongly yet, the long awaited summer rally could be underway (at least in Gold). Gold is oversold and its sentiment is overly bearish. But it is holding important support in the low $1200s. Silver has begun to rally after breaking down from a triangle consolidation. The gold stocks held up well during recent carnage in the metals but are struggling around very important support levels. The nature of their potential rebound is important as they try and maintain current support.
In recent days Gold has bounced from strong monthly support at $1200-$1210/oz. As the chart shows, that level was monthly support in early 2016 as well as the middle of 2017. It is the key support level between Gold and roughly $1140/oz. Look for this support to hold at least into September.
On the sentiment front, last week Gold’s net speculative position hit 13.9% (as a percentage of open interest) which is a +2-year low. Friday’s report may show a reading close to 10%. Within the context of a downtrend, this is the kind of sentiment (sub 15%) that can be deemed as extreme. Pair that with the strong monthly support at $1200-$1210 and its likely Gold holds this level for at least a few months.
Turning to the gold stocks, while they have held up well in recent months, the technicals suggest some potential trouble if they do not rebound soon.
The HUI Gold Bugs Index which contains only gold miners (no royalty companies) is losing key support within a descending triangle pattern. The pattern projects to a downside target of 149. Upon a close below 163 (which is less than 3% away from current levels), the HUI would hit a 2.5-year low and not have good support until 140.
GDX, meanwhile is showing less weakness but is vulnerable to a decline if it loses support at $21. If that break comes to fruition then GDX has a measured downside target of roughly $16.50-$17.00.
Even though the miners have struggled and Gold has not rallied much in recent days, the path of least resistance for the remainder of the summer should be higher. Gold should continue to hold support in the low $1200s and eventually rally back to $1260 perhaps. While the gold stocks are struggling to hold above support, I’m not sure there is enough selling pressure at the moment to drive them lower.

- In the West, gold has rallied decently during five of the past seven recessions. I’ve suggested that the current situation in America is something like 1965 – 1970, when inflation began a long and strong up cycle.
- That’s partly why I’m adamant that it’s the best time in American history to own a portfolio (a global portfolio) of companies involved in precious metals mining and jewellery.
- The other reason that I’m excited about these stocks is that in the East, when people get richer, they buy gold. They are now getting a lot richer, and a lot faster.
- Simply put, deflation is out, and inflation is in. It’s really that simple, and investors around the world need to get positioned right now to ensure they get maximum financial benefit.
- Please click here now. With their statements and analysis, Morgan Stanley moves “thunder cash” in the institutional investor community.
- Their top US equity man, Mike “Mr. Big” Wilson, predicts that while US markets are a clear short-term buy, valuations peaked in 2017, and prices will peak in 2018.
- I’m in 100% agreement with Mike. Tactically, I’ve urged investors who are not afraid of price chasing to buy some bank stocks, energy stocks, and growth stocks. Gamblers can buy call options.
- That’s how to play the final months of upside fun in the US stock market, but investors must be seriously prepared for years of inflationary bear market horror to follow this blow-off top.
- I’ve predicted that only the most astute stock pickers will survive being invested in the US stock market from 2019 forwards. In the coming inflationary inferno, index and ETF investors will essentially be turned into tumbleweed, burning in a financial desert.
- When will the inferno begin? Well, I think it happens in the upcoming September – October US stock market “crash season”, and by year-end at the latest. I expect gold to go ballistic as that happens, because it will be an inflation-oriented meltdown, and that means institutional thunder-buying takes place in the metals.
- Please click here now. Double-click to enlarge this GDX chart. In terms of time, I think gold stocks will initially surge higher for two to three years as the stock market falls.
- Most of the gains should be sustained due to an imminent drop in US and Chinese gold mining production. Canadian, Australian, and Russian miners should be the clear leaders in what I call the gold bull era.
- Note the diamond pattern in play on that GDX chart. A drift down from it now would put GDX at my key buy area of $21 just in time for the Fed’s next rate hike. That hike will put another major nail in the US stock market valuations coffin. It will be followed at the end of June with another ramp-up in QT.
- Many investors who failed to buy the stock market in 2008-2010 and are buying now are trying to convince themselves that the Fed will back off from more hikes and QT. This is very childish thinking. Those engaged in it will soon learn the hard way that the Fed doesn’t care about their silly stock market price chase.
- On a demographics note: In my professional opinion, about 60% of the Western gold community is now composed of younger “smart money” investors. They have been invested in the US stock and bond markets and are becoming very concerned (and rightly so) about the growing risk that inflation will cause a severe bear market in these traditional asset classes.
- This new breed of gold bug has more patience than the “old guard” gold fear trade investors. The old guard focused more on financial system risk and government debt that threatened to create a kind of “parabolic moment” of vertical price rise for precious metals. The transition from deflation to insidious inflation is an enormous process that requires investor patience, but it is now well underway.
- Please click here now. Double-click to enlarge this beautiful silver chart. The silver price has been consolidating the rally from the summer of 2017 in a nice symmetrical triangle pattern. Silver is highly correlated to gold, but during periods of inflation there is also a significant correlation with sugar.
- That’s because the average “man/woman on the street” tends to see gold as too high-priced to buy. Silver’s lower price is more enticing, and they can relate to an ounce of silver rising like the price of a pound of sugar rises.
- Please click here now. Double-click to enlarge. Sugar is arguably even better than money velocity as an inflation indicator.
- Investors should watch for a two-month close over the blue downtrend line. That must be followed by a two-week close over sixteen cents a pound. That price action is likely to indicate that inflation is becoming a firestorm for the stock market and will function as a green light for most gold stocks to blast higher.
- Note the peak in the summer of 2016 for sugar. That functioned as a red light for gold stock investors. The next signal will be a green one and investors need to get prepared now.
- In contrast to the hyperinflation envisioned by older gold bugs who focused on bank and financial system risk, the type of inflation that is coming now is more like the inflation of 1966 -1975, on an even bigger scale because of rampant Chindian income growth. It’s insidious.
- This inflation will last for a hundred years and likely for much longer, not just for a decade or two like in the 1970s. It’s a process akin to millions of solid gold termites invading the US stock and bond market house. No bug spray works, so the institutional investors inside the house will all leave.
- The bottom line: If you can’t fight a gold bug invasion, you have to join it. Gold stocks will rise thousands of percentage points higher as investors begin to understand what is happening. The inflation is imminent, and investors must get prepared!
Thanks!
Stewart Thomson
Graceland Updates
Note: We are privacy oriented. We accept cheques, credit card, and if needed, PayPal.
Written between 4am-7am. 5-6 issues per week. Emailed at aprox 9am daily.
https://www.gracelandupdates.com
Risks, Disclaimers, Legal
Stewart Thomson is no longer an investment advisor. The information provided by Stewart and Graceland Updates is for general information purposes only. Before taking any action on any investment, it is imperative that you consult with multiple properly licensed, experienced and qualified investment advisors and get numerous opinions before taking any action. Your minimum risk on any investment in the world is: 100% loss of all your money. You may be taking or preparing to take leveraged positions in investments and not know it, exposing yourself to unlimited risks. This is highly concerning if you are an investor in any derivatives products. There is an approx $700 trillion OTC Derivatives Iceberg with a tiny portion written off officially. The bottom line:
Are You Prepared?
Lupaka Gold Inc. (TSX-V: LPK) has been completing the necessary steps to achieve commercial production at its wholly-owned Invicta Gold project in Peru, located 120 km north of Lima by road. Recently, I had the opportunity to re-visit the mine site to see how work is progressing towards production.
It is at this point in the life span of a mining company where institutional investors typically invest, and the stock price starts to move back up towards full value, which makes it a good time to invest. Lupaka Gold (TSX-V: LPK) is at this point.

With financing secured, the company has commenced construction and development work in order to commence production in the second half of 2018, resulting in potential full appreciation for its shares. The Company’s diligence and hard work is starting to bare fruit through the following recent developments:
- Fully funded to complete its 6 to 12-month goals, including the start of production at Invicta
- Produced a positive PEA on the project with an initial 6 year mine plan
- Community agreement in place
- Commencement of roadwork to mine site
- Building out the in-country team with the appointment of Dan Kivari, P.Eng., as Director of Operations
- Mine rehabilitation and construction
- Ongoing sampling and surveying
The financing secured in 2016 was through Pandion Finance for a total of $7 million (U.S.), available to the Company in three tranches, all of which have now been drawn. This forward gold sale agreement is repayable to Pandion by delivering a total of 22,680 ounces of gold over 45 months.
Pandion plays a partnership role in development by receiving payment in gold from the actual mine rather than by way of equity or traditional debt structures. It also does not dilute shareholders as would with a financing in the market.
With money in place, now begins the real work.
On March 1, 2018, Lupaka issued a preliminary economic assessment (PEA) which outlined low capital expenditures, an initial mining scenario of 350 tonnes per day (tpd), and a very quick payback and path to cash flow. The strategy is to commence mining in an area close to existing infrastructure and focus on a small portion of the resources within the Aetnea vein. While the current Environmental Impact Assessment allows for up to 1,000 tpd, Lupaka’s approach is to start small and gradually increase production over the next few years.
The PEA boasts all-in sustaining costs of $575 per gold ounce equivalent (“AuEq oz”) over an initial six-year mine life and an average annual pre-tax operating profit of $12.3-million ($1300 gold assumption), very attractive economics at current metal prices. There is no need to state the Internal Rate of Return (“IRR”) as it produces meaningful cash flows within the first year.
The updated mineral resource (part of the PEA) outlines 3.0 million tonnes (“Mt”) of Indicated Mineral resources at 5.78 grams per tonne (“gpt”) AuEq oz using a 3.5-gram-per-tonne cut-off, and 0.6 Mt of inferred mineral resources at 5.49 gpt AuEq oz. The initial six-year mine plan is designed on only a portion of the mineral resource (~0.6Mt at an average head grade of 8.58 gpt AuEq, incorporates existing infrastructure which minimizes capital start-up costs.
The company now has over 24 years of tonnage, in terms of Indicated Mineral resources, mining at the 350 tpd, however management’s goal would be to increase production towards the EIA level of 1,000 tpd, which would increase production from 33,700 AuEq oz/yr up to closer to 100,000 AuEq oz/yr.
At the main portal, the company recently announced sample assay values over the footwall vein averaged 9.86 gpt AuEq over a strike length of 130 metres, with an average width of 6.1 metres. The average sampled grades are in-line, or higher, than grades within the mine plan, based on the PEA. With a combined average width of over 12 metres, the sub-vertical Invicta deposit extends for over 130 metres in strike length on the 3400 level and will be immediately accessible for extraction when the Invicta mine becomes operational in the second half of 2018.
The start small approach also allows the Company to reinvest into exploration in surrounding areas, in order to gain confidence to increase the mine plan, and to prove up new resources to potentially extend production for years to come.
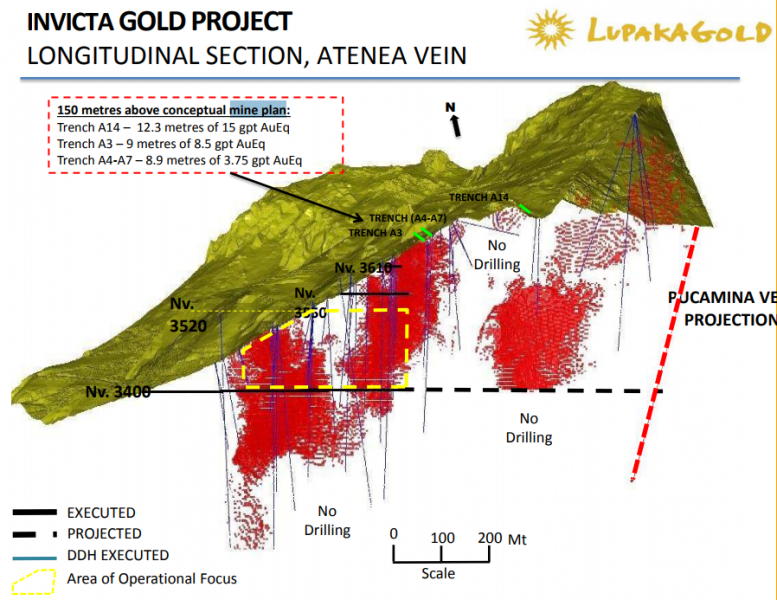
Lupaka has been granted a water use permit from the Peruvian Ministry of Agriculture. Surface rights have been attained, a well has been constructed, and testing studies have concluded it can supply water up to 60 liters per second during the dry season, which should be sufficient supply for an onsite mill in the future.
As part of the agreement that was completed with the community of Lacsanga in July/2017, Lupaka was to undertake and complete certain improvements to the roads, including widening and creation of bypasses around the communities. The company signed a contract with local operators to expand, enhance and modify 27 kilometres of road commencing from the paved Huacho-Churin-Oyon Highway, located at approximately 1,500 metres above sea level, up to the Invicta project located at approximately 3,500 metres above sea level.


Work is ongoing to ensure that 30-tonne trucks can operate safely and efficiently using North American standards. This involves proper safety berms, passing stations, water drainage, widening hard rock areas using explosives and community by-passes routes.


There is a camp to house workers on site that was built by previous operators. It currently can house about 60 to 70 people, but it is already looking like they will have to expand the camp to accommodate a growing team.


Lupaka announced that development would begin with rehabilitation, preparation at Invicta with three crews, a new adit and 3430 level to be constructed. The Invicta project has approximately of 1.2 kilometres of existing adits, cross-cuts and underground workings.
As you can see below, the cross cut at the 3430 level is in the process of rehabilitation and construction. Over the past few months, work has been advancing to the point the cross cut has approached the main vein wall. Two 4.2-yard PLH Scoops have arrived on site along with a single boom jumbo drill in preparation of accelerated development and stope preparation.
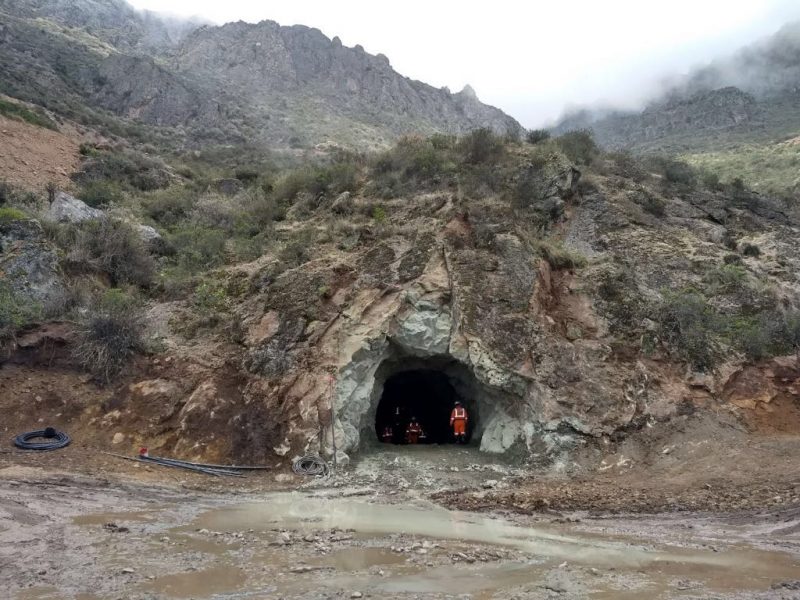
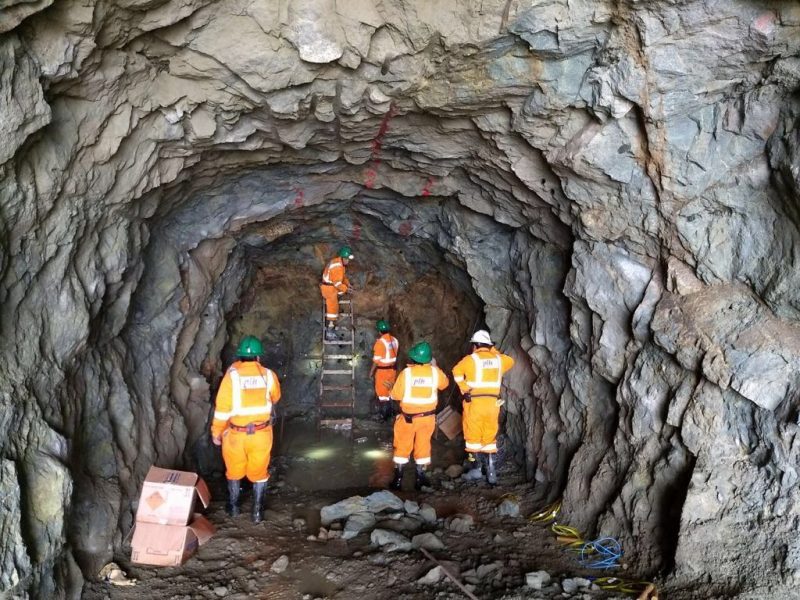
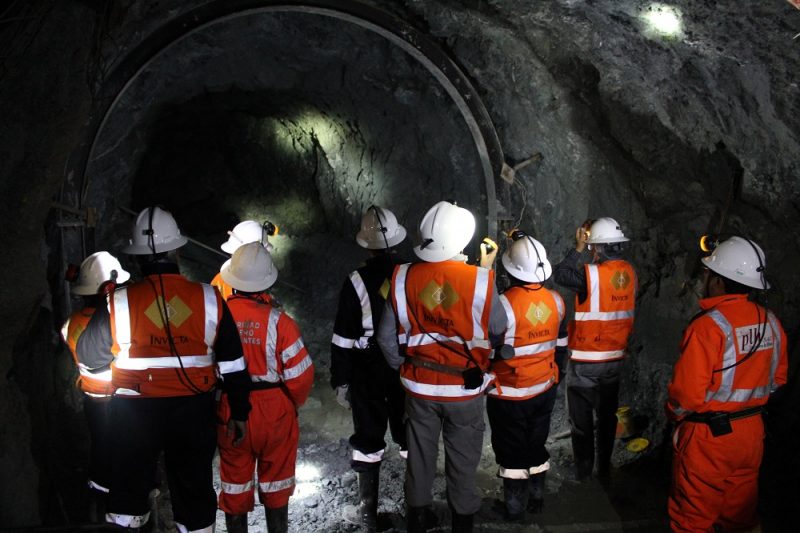
At the lead of operations on site is recently appointed Dan Kivari, P.Eng. (picture in the centre above). He has more than 30 years of international experience in metallurgy, engineering and management of mineral projects throughout various stages of development. Most recently, Mr. Kivari held the position of chief operating officer at Stellar Mining Corp., a privately held mining company in Peru.
Mr. Kivari’s previous work experience includes several senior operating roles such as regional manager for Agnico Eagle Ltd.’s Western and Nunavut operations, where he was responsible for the development of the Meadowbank gold project, and vice-president of operations with Yamana Gold (TSX: YRI) overseeing the development of the Chapada copper-gold project. Throughout this experience, he has picked up the skills necessary to build a team for the Invicta Project.
There is still plenty of work to be done to meet the company’s goal to de-risk and evaluate the suitability of a plant by the second half of 2018. New bulk samples need to be extracted and sent to toll milling facilities to test and optimize metallurgical recoveries and concentrate quality.
A previous run-of-mine bulk test in February 2016 achieved good recoveries in concentrate streams — returning 87.5% gold, 91.2% silver, 91.5% copper, 90.03% lead and 90.1% zinc. The sample was a blend of approximately 80% run-of-mine material and 20% from a low-grade stockpile derived from development.
Looking forward, the company and the geology suggests that there is plenty more to be mined and there is the potential for the construction of a mill which would further reduce the company’s costs and improve any future valuation of the Invicta mine.
From six months ago, the Invicta Gold project is now a completely different scene. Today the roads have and continue to be widened (making them safe), staff and operating equipment is on site and the newly created 3430 Level cross cut has hit the main zone of mineralization.
From an investors perspective, mines moving to production present the greatest investment opportunity because each advancement the company makes de-risks the project and it becomes a question of the operating team to achieve goals on budget and proving the business model works. Lupaka is at this stage and its shares present an opportunity right now.
The hard work is underway at Invicta and the team is already in place to bring it into production, just in time for improving metal prices and the renewed interest in gold. The company appears to be well positioned to bring the project online during the second half of 2018 and meet its objective of becoming cash flow positive in its inaugural year.
Investors can look forward to the following positive catalysts:
- Bulk sample results from prospective toll mill facilities
- Toll milling agreement
- Offtake agreement
- Exploration plans and results
- Obtaining commercial production at 350 tpd
- Engineering and trade-off studies for building a plant onsite
With an all-in-sustaining cost of $575 per AuEq oz over initial six-year mine life, and plenty of resources not yet announced with permits in place to increase production, Lupaka Gold (TSX-V: LPK) is a company to watch.
It is at this stage where investors could see the greatest share price appreciation as the company is on task and working towards becoming a producing gold mine.
Lupaka Gold Inc. (TSX-V: LPK)


The gold miners’ stocks weathered the recent stock-market plunge really well. As evident in their leading GDX ETF, they were already beaten down before stock markets started falling. The resulting explosion of fear bled into GDX, forcing it even lower. Nevertheless, no major technical damage was done. GDX remained well within its consolidation trend channel and is still within striking distance of a major $25 breakout.
Gold stocks’ behavior during stock-market selloffs can seem capricious. This small contrarian sector generally amplifies the price action in gold, which drives its collective profitability. Gold tends to surge in the wake of major stock-market selloffs, which erode investors’ confidence in stocks’ near-term outlook. That greatly boosts gold investment demand as investors soon rush to wisely diversify their stock-heavy portfolios.
This drives gold prices higher after material stock-market weakness. So naturally the gold stocks mirror and amplify gold’s gains which really improve their fundamentals. But this broader strengthening trend is interrupted by a lot of chaotic noise. The collective greed and fear generated by the stock markets’ daily action heavily influences gold-stock traders, especially when the stock markets are exceptionally volatile.
The gold miners’ stocks are just that, stocks. So it’s not uncommon for them to get sucked into serious down days in the general stock markets, which fuel widespread fear. When the flagship S&P 500 stock index (SPX) falls sharply, nearly everything else is dumped in sympathy including the gold stocks. The SPX truly is the dominant center of the global financial-market-sentiment universe, greatly affecting everything.
Unfortunately sharp SPX down days’ ability to heavily influence GDX wreaks havoc on sentiment in the gold-stock sector. Traders read historical studies proving the precious-metals realm is the best place to deploy capital in and after weakening stock markets. So they rightfully expect gold-stock prices to rally on balance. But when GDX plunges on a big SPX down day, their fear soars and they abandon gold stocks.
Human psychology always tends to overweight the importance of recent and traumatic events, with our minds wanting to extrapolate short-term turmoil out into infinity. Thus when gold stocks get sucked into a sharp general-stock selloff, traders assume they can’t thrive in weak stock markets. They lose the trend forest for the daily trees! This fearful herd sentiment scares them into panicking and selling gold stocks low.
Weakening stock markets are like springtime for gold and its miners’ stocks due to higher investment demand. Just as daily temperatures gradually warm over time during spring, gold stocks rally on balance after material stock-market weakness. But spring weather also includes periodic cold snaps that can feel winter-like. They are just temporary counter trend aberrations though, like gold-stock drops on big SPX down days.
This first chart looks at gold stocks’ recent price action through the lens of GDX, the VanEck Vectors Gold Miners ETF. Since its birth in May 2006, GDX has grown into the leading and dominant gold-stock ETF. As of this week GDX’s $7.6b in assets under management ran a whopping 22.0x larger than its next-biggest 1x-long major-gold-stock-ETF competitor! GDX actually weathered the stock plunge really well.
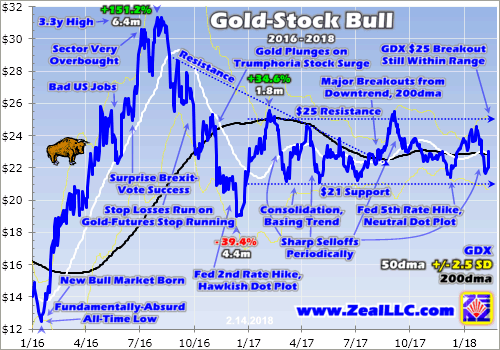
The sharp stock-market selloff in the past couple weeks has been extraordinary, largely unprecedented on multiple key fronts. The S&P 500 was wildly overvalued and overbought in late January, deep in its longest span ever witnessed without a mere 5% pullback. Volatility was trading near record lows, which catapulted complacency off the charts. Last week I explored all this in an essay analyzing stock selling unleashed.
The first real day of serious SPX selling was Friday February 2nd. The gold stocks certainly weren’t high leading into that, as GDX had closed the day before at $23.70. That was merely on the high-middle side of gold stocks’ consolidation trading range. Really since late 2016, GDX has largely meandered between $21 support and $25 resistance. It had neared a major $25 breakout in late January, but couldn’t punch through.
On Friday the 2nd the SPX plunged 2.1% after rising wages on the US monthly jobs report stoked fears of inflation. 10-year Treasury yields continued their sharp surge since the latest Fed rate hike in mid-December. That SPX down day was the worst since September 2016, before Trump won the election and the resulting extreme taxphoria rally. It generated some real fear which spilled over into the gold stocks.
But that stock-fear bleed-in sure wasn’t the only reason GDX fell 3.3% that day to revisit its technically-important 200-day moving average. With inflation fears mounting, futures traders figured the Fed might have to increase the tempo of this rate-hike cycle. So the US Dollar Index surged a sharp 0.7% higher, which led gold-futures speculators to hammer gold 1.4% lower. GDX’s initial stock-selloff loss was reasonable.
The major gold stocks tend to amplify gold’s underlying price action by 2x to 3x. And GDX’s downside leverage to gold that day ran 2.4x, right in line. Most of the time gold stocks still follow gold, even when stock markets are weaker. But on exceptional SPX down days when fear really flares, that overshadows gold as traders are infected by prevailing herd sentiment. That really started to happen on Monday the 5th.
The SPX selloff greatly intensified as it plunged 4.1%, its worst daily drop since way back in mid-August 2011! That was extreme, as stock markets usually don’t plummet so rapidly from record highs. Because it had been so long since the SPX plunged, fear skyrocketed as evidenced by the VIX implied-volatility index. Foolish traders who had aggressively shorted volatility near record lows scrambled to unwind their bets.
Gold caught a modest bid that day, rallying 0.6% despite the US Dollar Index climbing another 0.4% on safe-haven buying. On days when the SPX plunges yet gold climbs, traders are torn about what to follow so the gold stocks generally split the difference. Indeed that day GDX slid another 0.9%, far milder than the sharp SPX plunge but still worse than gold. That left GDX at $22.71, sliding farther under its key 200dma.
After plunging even deeper early on Tuesday the 6th, the SPX reversed sharply to a 1.7% gain on close as the extreme VIX-futures long buying abated. Gold suffered a 1.1% loss on the stronger stock markets as well as a major 1.4% draw in its leading GLD gold ETF’s holdings. Investors likely dumped GLD shares for a source of capital. Since gold is much stronger than general stocks in SPX selloffs, GLD is easy to sell.
With gold falling sharply GDX dropped another 2.6% on that third day of the SPX selloff. Once again that made for 2.4x downside leverage to gold, which is perfectly normal. Although that decisively broke GDX below its 200dma, at $22.11 it remained well within its long-established consolidation trend channel. With trend support at $21, gold stocks still had a ways to go before they threatened a major technical breakdown.
The SPX selling resumed on Wednesday the 7th with a relatively-minor 0.5% loss. Gold fell by the same amount, as once again the US Dollar Index surged 0.7% on flight-capital safe-haven buying. GDX lost another 1.4% to hit $21.80 on close. That amplified gold by 2.8x, still within that normal 2x to 3x range for the major gold stocks. The gold stocks were weathering that sharp SPX selloff really well by that point.
On Thursday the 8th the stock markets started sliding again on no news, and the SPX fell relentlessly all day long. By the time the dust settled, it had collapsed another 3.8%! Two huge 4%ish down days out of just four trading days was very serious, generating the most fear traders have experienced for at least a couple years. Gold eked out a 0.1% gain with the US dollar flat, and the gold stocks split the difference as usual.
GDX only retreated 0.6% that day the SPX formally plunged into correction territory for the first time since early 2016. That was truly an impressive show of strength given the stock markets rapidly spiraling lower. At $21.68, GDX remained well above its $21 support line that has held rock solid since late 2016. It looked like the gold stocks were nearing selling exhaustion since they fell so little on such a huge SPX down day.
In just five trading days the SPX had plummeted 8.5%! That was a big drop by any standard, let alone off record highs out of near-record-low volatility. Interestingly GDX exactly mirrored that drop, falling an identical 8.5% in that same span. Relative to gold that was excessive, 3.5x the 2.4% gold lost during that same timeframe. But with GDX remaining well within its consolidation trend channel, technical damage was minor.
Last Friday the 9th once again saw the SPX slide rapidly after open before reversing sharply to a large 1.5% daily gain. Gold stocks got sucked into that early fear-spawning selling, which was exacerbated by gold itself slumping lower before a -0.2% close. GDX tested that $21 support intraday, but bounced back to a dead-flat close. This small contrarian sector had successfully weathered an exceptional SPX selloff!
This week the SPX and gold both rebounded, each rallying Monday, Tuesday, and Wednesday. Thus it wasn’t surprising GDX followed suit, rallying 1.3%, 0.1%, and a monster 4.6% by the data cutoff for this essay. Thus over the entire 9-trading-day span of the recent volatility storm, GDX merely slipped 2.9%. That was again between the SPX’s 4.4% loss and gold’s slight gain. The gold miners’ stocks are faring fine!
This Wednesday GDX was back up to $23.01, exactly in the middle of its consolidation trading range of the past year between $21 support and $25 resistance. GDX was back over its 200dma again, and still within striking range of that critical $25 breakout I discussed a month ago. If you had totally tuned out for 9 trading days and ignored the SPX-selloff action, it would’ve looked like gold stocks were still merely basing.
One of the greatest benefits to continuing to study the markets and staying immersed in them is you will gradually become immune to herd sentiment. After you’ve seen enough selloffs, they increasingly lose their ability to scare you. And you remember that sharp selloffs are short-lived, whether in the general stock markets or gold stocks. So you come to accept them as inevitable periodically, and they don’t rile you up.
A great analogy is a beekeeper. Most people are scared of bees, freaking out if bees buzz too closely or land on them. I know I’m no fan of bees invading my personal space. But beekeepers have no fear of bees because they work with them all the time. They certainly respect bees and understand the risks of being around them. But all their experience with bees leads to enough knowledge to negate emotional responses.
Gold stocks have always been a volatile sector. That’s actually a core reason they are so alluring, as this volatility translates into big and fast gains when they are rallying. In roughly the first half of 2016, GDX rocketed 151.2% higher on a parallel 29.9% gold upleg! Volatility is a double-edged sword, sectors that can rally fast will also fall fast. So gold-stock investors must accept periodic sharp selloffs as par for this course.
The major gold stocks as represented by GDX are doing fine. Despite some choppiness as the SPX was flailing about in recent weeks, they are continuing to base in their well-established consolidation trend. They are still on track for a major GDX $25 breakout, which will work wonders to shift sector psychology back to bullish again and spur big capital inflows. The gold miners’ stocks are low technically and cheap fundamentally.
This last chart zooms out to the bigger picture, looking at GDX since 2007 which is largely its entire life. Gold stocks move in great bull-bear cycles like everything else, and they remain incredibly low today. The small highlighted square in the lower right encompasses the entire first chart. These prevailing gold-stock levels are almost as low as during 2008’s epic stock panic, which is absurd based on fundamentals.
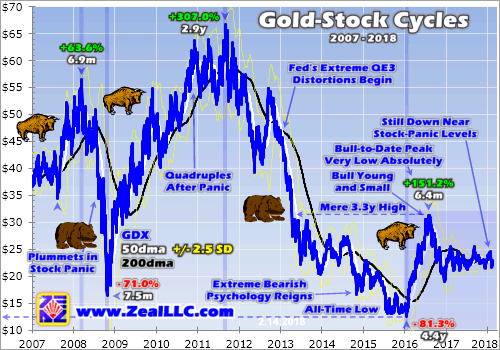
This powerful new gold-stock bull ignited in early 2016 remains young and small. Its bull-to-date peak in early August 2016 was merely a 3.3-year GDX high, still very low in secular context. After this sector was sucked into 2008’s stock panic, the major gold stocks more than quadrupled out of those extreme lows. A quadruple from January 2016’s all-time low birthing this bull would catapult GDX back up near $50.
That means the major gold stocks easily have the potential to more than double again from here, seeing another 117% GDX gain in the next couple years! Is there any other sector in all these wildly-overvalued stock markets that can make such a claim? No way. Like gold, the gold stocks are now deeply out of favor thanks to the extreme stock-market bull that may have just peaked in late January. Sentiment is poor.
But as gold inevitably powers higher in the wake of this newest SPX correction on strengthening demand from investors, the gold stocks will follow and amplify its gains. Fundamentally the major gold stocks are still dirt-cheap. That’s readily evident in their quarterly operational and financial reports, which I closely follow and analyze for the major GDX gold miners. I can’t wait for their Q4’17 results over the coming weeks.
The primary measure of industry-wide gold-mining profitability is all-in sustaining costs, what its costs to mine and replenish an ounce of gold. In Q3’17 that averaged $868 for the GDX gold miners. And these costs are pretty stable, averaging $867, $878, $875, and $855 in the four quarters before that. So odds are the major gold miners’ collective all-in sustaining costs will hold near these levels in Q4’17 and Q1’18 too.
Gold averaged $1279 in Q3, leading to fat per-ounce profits of $411. Gold was essentially flat in Q4 with a $1276 average price. That means the GDX-component gold miners are likely to soon report profits of $408 per ounce. I’ll dig deeply into those new Q4 quarterlies as they are released, and publish an essay on the results in mid-March. Since Q4 reporting includes full-year results, regulatory deadlines are twice as long.
The SEC requires normal quarterly reports to be filed within 40 to 45 days after quarter-ends, depending on companies’ sizes. But since they have to prepare annual reports with the quarter that ends fiscal years, usually Q4, that deadline is extended to 60 to 90 days. So by mid-March most of the major gold miners’ Q4’17 results will be out. I expect average all-in sustaining costs to come in flat like usual in these reports.
And that’s super-bullish given what gold is doing. The yellow metal that drives its miners’ profits is faring much better in Q1 than it did in Q4. It’s averaging $1331 quarter-to-date, up 4.3% sequentially from Q4. So if AISCs are stable like usual, profits will surge which investors will anticipate in advance. The same $868 AISC implies Q1 GDX-major-gold-miner profitability of $463 per ounce, soaring 13.3% quarter-on-quarter!
So my month-old forecast of a GDX $25 breakout on Q4 earnings remains highly likely. When investors see how the gold miners are faring in their latest reported quarter, they are going to extrapolate mining costs into Q1. That will portend exploding profitability. GDX only needs to rally another 8.6% from its mid-week levels to hit $25. And once gold stocks break out decisively to the upside, they are off to the races.
In all the markets buying begets buying. The more a sector or asset is rallying, the more investors want to participate. And the more capital they pour in, the more those prices keep rallying. That creates and fuels a powerful virtuous circle of buying. Gold stocks have drifted sideways for so long now that they need to achieve a major upside breakout from their consolidation to catch investors’ interest. That’s not far away.
Despite the roller-coaster ride in gold stocks as the wild SPX volatility bullied them around in the past couple weeks, GDX is still within striking distance of that key $25 breakout. Once that happens, the gold stocks’ popularity will surge again. There’s still time to buy low before lots more investors start returning which will catapult this small contrarian sector sharply higher. The gold stocks look really bullish today!
While investors and speculators alike can certainly play gold stocks’ powerful coming upleg with major ETFs like GDX, the best gains by far will be won in individual gold stocks with superior fundamentals. Their upside will far exceed the ETFs, which are burdened by over-diversification and underperforming gold stocks. A carefully-handpicked portfolio of elite gold and silver miners will generate much-greater wealth creation.
At Zeal we’ve literally spent tens of thousands of hours researching individual gold stocks and markets, so we can better decide what to trade and when. As of the end of Q4, this has resulted in 983 stock trades recommended in real-time to our newsletter subscribers since 2001. Fighting the crowd to buy low and sell high is very profitable, as all these trades averaged stellar annualized realized gains of +20.2%!
The key to this success is staying informed and being contrarian. That means buying low before others figure it out, before undervalued gold stocks soar much higher. An easy way to keep abreast is through our acclaimed weekly and monthly newsletters. They draw on my vast experience, knowledge, wisdom, and ongoing research to explain what’s going on in the markets, why, and how to trade them with specific stocks. For only $12 per issue, you can learn to think, trade, and thrive like contrarians. Subscribe today, and get deployed in the great gold and silver stocks in our full trading books!
The bottom line is the gold stocks weathered the recent sharp stock-market selloff really well. The SPX plunged for the first time in a couple years, generating a big and sharp fear spike. As usual that spooked the gold-stock traders, who sold and fled. Yet despite the carnage GDX’s major consolidation support at $21 held solid. The gold miners’ stocks soon rebounded sharply back up to the middle of their basing channel.
With GDX trading near $23 this week, that critical $25 breakout to entice investors back remains within easy range. Once the collective gold-mining costs reported in the upcoming Q4 results are compared with higher Q1 prevailing gold prices, strong gold-stock buying should resume. Gold stocks have always been a volatile sector, so there’s no reason for traders to fear periodic selloffs like they suffered in recent weeks.
Adam Hamilton, CPA
February 16, 2018
Copyright 2000 – 2018 Zeal LLC (www.ZealLLC.com)
When gold began to rally in late 2015, investors breathed a sigh of relief. The longest resource bear market was finally over, and capital slowly began finding its way back into the mining sector.

During the beginning of gold’s rally, gold stocks actually declined as investors could not get a true pulse on the market. However, when the recovery was apparent, gold stocks soared, eventually yielding over 150% returns in less than a year.
Unfortunately, with such rapid gains a pull-back was inevitable and healthy. From its peak, gold decreased -17% while gold stocks gave back up to -38% in aggregate.

It appears the pull-back is now over, and gold is once again on the mends.

Since late 2016 gold has recovered 16%, but the Junior Gold Miners ETF (GDXJ) and the Arca Gold BUGS Index (HUI) are only up 21% and 29%, respectively. Just like when gold was first recovering, investors are reluctant to begin deploying capital. However, once this recovery is apparent, we expect gold stocks to once again continue its precipitous ascent.

- Gold has staged a fabulous rally from about $1220 to $1245. Using the December futures price chart, I’ve defined the $1300 – $1350 area as a spectacular profit booking opportunity for investors.
- Please click here now. Double-click to enlarge this gold chart.
- I’m an eager gold bullion seller now, but I’m less eager to sell gold stocks or silver bullion. That’s because they have not taken out their February highs while “Queen Gold” has done so easily.
- Gold has clearly been the leader. It’s been a great upside ride, and now it’s time for investors to book solid profits with a big smile.
- I’ve been adamant that gold is on the cusp of a two hundred year “bull era”. It’s themed around the love trade in China and India. For that reason, core positions should not be sold, but short term positions bought in the $1200 – $1250 area should definitely be sold aggressively now.
- Investors who are nervous that they will miss out on more upside action should buy call options while selling some bullion. Call options are like lottery tickets; if gold surges above $1350 and runs to $1400, the call options will rise in value quite significantly.
- On the other hand, if gold declines to either of my $1308 or $1280 key buy zones, the loss on the options is small, and the investor has plenty of dry powder to buy more gold bullion, ETFs, and futures.
- Please click here now. Clearly, the deep-pocketed commercial traders are aggressive sellers now.
- This COT report covers the action through last Tuesday. In my professional opinion, the commercial traders have probably shorted another 50,000 to 100,000 COMEX contracts since that report came out, and sold a significant number of long positions.
- Amateur gold investors don’t need to sell as aggressively as the commercial traders do, but history suggests that investors who book modest gold market profits when the commercial traders are aggressive sellers tend to be making a wise tactical decision.
- Please click here now. Double-click to enlarge this interesting bitcoin chart.
- I cover the entire blockchain asset class at www.gublockchain.com but gold bullion enthusiasts should take note of the fact that bitcoin price sales can sometimes be a leading indicator for gold price sales.
- Please click here now. Double-click to enlarge. That’s another look at the gold chart. Note the huge volume that occurred at the November highs in the $1338 area. Commercial traders were aggressive sellers into that price zone, as they are now.
- The rally was caused by the election of Donald Trump. It was destroyed by Modi’s demonetization announcement, and there are rumours that he may be planning “Demonetization 2.0”
- In the big picture, demonetization is increasing Indian gold demand. Indians have always been more distrustful of government than most of the world’s citizens (and rightly so), which is partly why they buy so much gold.
- Demonetization has only increased that distrust. Another round of demonetization would create a significant long term increase in demand for gold bullion. In the short term, demonetization is negative for demand, and for the price.
- Do commercial traders believe more demonetization is imminent? Is that why they are such aggressive sellers into this rally? That’s possible, but I think their selling is related more to the simple fact that there has been no serious pullback since the rally began, and a pullback is overdue from a technical standpoint.
- Please click here now. Double-click to enlarge. I’ve noted that I’m a seller of gold but not of silver. Silver is likely to pull back when gold does, but when that pull back is over I expect silver to stage a stunning advance.
- Silver should easily outperform gold during this next stage of what I call the “bull era”. As gold rises above $1392 and begins an aggressive rally towards my $1432, $1470, and $1530 target price zones, I think silver could shock investors and rally towards its $50 area highs.
- My personal plan of action is to buy silver and gold stocks with the proceeds of my recent gold bullion sales. I encourage the entire Western gold community to consider partaking in that plan, to some degree.
- Please click here now. Double-click to enlarge this fabulous GDX chart. A lot of gold stocks have arrived at my first upside target zone ($25 – $26 basis GDX), but I urge investors to keep profit booking very light and focus on building substantial gold stock core positions on all price weakness.
- For GDX, it appears that the long consolidation zone between $26 – $21 that started in February is ending. As noted, I’ll be using any price weakness to allocate my gold bullion profits to silver and gold stocks.
- Many senior and intermediate mining companies have significantly restructured, and a gold price of $1300 or higher is turning them into “cash cows”. I’ve declared the 20 year bear market of gold stocks versus gold to be over. Gold doesn’t need to rally to thousands of dollars an ounce to send gold stocks to new highs, given this restructuring and low oil prices.
- A gold price of just $1500, if it is sustained (and I think it will be) could send GDX to a new high, as institutional investors race to get in on the “restructured mining companies” action!
Stewart Thomson
Graceland Updates
https://www.gracelandupdates.com
Email:
Stewart Thomson is a retired Merrill Lynch broker. Stewart writes the Graceland Updates daily between 4am-7am. They are sent out around 8am-9am. The newsletter is attractively priced and the format is a unique numbered point form. Giving clarity of each point and saving valuable reading time.
Risks, Disclaimers, Legal
Stewart Thomson is no longer an investment advisor. The information provided by Stewart and Graceland Updates is for general information purposes only. Before taking any action on any investment, it is imperative that you consult with multiple properly licensed, experienced and qualified investment advisors and get numerous opinions before taking any action. Your minimum risk on any investment in the world is: 100% loss of all your money. You may be taking or preparing to take leveraged positions in investments and not know it, exposing yourself to unlimited risks. This is highly concerning if you are an investor in any derivatives products. There is an approx $700 trillion OTC Derivatives Iceberg with a tiny portion written off officially. The bottom line:
Are You Prepared?
If you would like to receive our free newsletter via email, simply enter your email address below & click subscribe.
 Follow us on Twitter
 Become our facebook fan
CONNECT WITH US
Tweets
Tweet with hash tag #miningfeeds or @miningfeeds and your tweets will be displayed across this site.
MOST ACTIVE MINING STOCKS
Daily Gainers
 CMC Metals Ltd. CMC Metals Ltd. |
CMB.V | +900.00% |
 Eden Energy Ltd Eden Energy Ltd |
EDE.AX | +200.00% |
| GoviEx Uranium Inc. |
GXU.V | +42.86% |
| Eagle Nickel Ltd. |
ENL.AX | +41.67% |
| Citigold Corp. Limited |
CTO.AX | +33.33% |
| Mount Burgess Mining NL |
MTB.AX | +33.33% |
| Exalt Resources Limited |
ERD.AX | +31.94% |
| Casa Minerals Inc. |
CASA.V | +30.00% |
| Cariboo Rose Resources Ltd |
CRB.V | +28.57% |
| Belmont Resources Inc. |
BEA.V | +28.57% |


