The U.S. stock markets are becoming more unstable, fueling mounting anxiety about what’s likely coming. After surging to new all-time-record highs in late July, stocks plunged in a sharp pullback as the US-China trade war escalated. Stock markets’ resiliency in the face of bearish news is partially determined by how companies are faring fundamentally. The big U.S. stocks’ just-reported Q2’19 results illuminate these key indicators.
Four times a year publicly-traded companies release treasure troves of valuable information in the form of quarterly reports. Required by the US Securities and Exchange Commission, these 10-Qs and 10-Ks contain the best fundamental data available to traders. They dispel all the sentiment distortions inevitably surrounding prevailing stock-price levels, revealing corporations’ underlying hard fundamental realities.
The deadline for filing 10-Qs for “large accelerated filers” is 40 days after fiscal quarter-ends. The SEC defines this as companies with market capitalizations over $700m. That easily includes every stock in the flagship S&P 500 stock index (SPX), which contains the biggest and best American companies. The middle of this week marked 38 days since the end of Q2, so almost all the big US stocks have reported.
The SPX is the world’s most-important stock index by far, with its components commanding a staggering collective market cap of $25.8t at the end of Q2! The vast majority of investors own the big US stocks of the SPX, as some combination of them are usually the top holdings of nearly every investment fund. That includes retirement capital, so the fortunes of the big U.S. stocks are crucial for Americans’ overall wealth.
The huge ETFs that track the S&P 500 dominate the increasingly-popular passive-investment strategies as well. The SPY SPDR S&P 500 ETF, IVV iShares Core S&P 500 ETF, and VOO Vanguard S&P 500 ETF are the 3 largest ETFs in the world. This week they reported colossal net assets running $258.5b, $179.3b, and $115.8b respectively! The big SPX companies overwhelmingly drive the entire stock markets.
Q2’19 proved quite volatile in the U.S. stock markets, leading to increasing unease. The SPX surged 3.9% higher in April, hitting 4 new record closing highs. That capped an unbelievable 25.3% rocketing over just 4.2 months, a crazy move higher. That was driven by extreme Fed dovishness, as it panicked following the SPX’s severe 19.8% near-bear correction that bottomed in late December. Euphoria reigned supreme.
But the big US stocks couldn’t stay at such lofty heights, so the SPX fell on balance through May on the way to a 6.8% pullback by early June. China reneged on major trade commitments it made to the US over a year through 10 rounds of high-level trade talks. So Trump ramped tariffs on a $200b tranche of annual Chinese imports into the US from 10% to 25%. US-China trade-war news was a key market driver in Q2.
That considerable selloff was reversed by a hyper-dovish Fed riding to the rescue. First its chairman said the Fed was ready to start cutting rates again, and later top Fed officials’ collective outlook for future rates shifted from one hike to one cut. The SPX blasted 7.6% higher in a few weeks on that, achieving another new record high in late June. The US-China trade war and Fed jawboning and actions will keep fueling volatility.
Every quarter I analyze the top 34 SPX/SPY component stocks ranked by market cap. This is just an arbitrary number that fits neatly into the tables below, but a dominant sample of the SPX. As Q2 waned, these American giants alone commanded fully 44.2% of the SPX’s total weighting! Their $11.4t collective market cap exceeded that of the bottom 439 SPX companies. Big US stocks’ importance cannot be overstated.
I wade through the 10-Q or 10-K SEC filings of these top SPX companies for a ton of fundamental data I feed into a spreadsheet for analysis. The highlights make it into these tables below. They start with each company’s symbol, weighting in the SPX and SPY, and market cap as of the final trading day of Q2’19. That’s followed by the year-over-year change in each company’s market capitalization, an important metric.
Major U.S. corporations have been engaged in a wildly-unprecedented stock-buyback binge ever since the Fed forced interest rates to the zero lower bound during 2008’s stock panic. Thus the appreciation in their share prices also reflects shrinking shares outstanding. Looking at market-cap changes instead of just underlying share-price changes effectively normalizes out stock buybacks, offering purer views of value.
That’s followed by quarterly sales along with their YoY change. Top-line revenues are one of the best indicators of businesses’ health. While profits can be easily manipulated quarter to quarter by playing with all kinds of accounting estimates, sales are tougher to artificially inflate. Ultimately sales growth is necessary for companies to expand, as bottom-line profits growth driven by cost-cutting is inherently limited.
Operating cash flows are also important, showing how much capital companies’ businesses are actually generating. Companies must be cash-flow-positive to survive and thrive, using their existing capital to make more cash. Unfortunately many companies now obscure quarterly OCFs by reporting them in year-to-date terms, lumping multiple quarters together. So if necessary to get Q2’s OCFs, I subtracted prior quarters’.
Next are the actual hard quarterly earnings that must be reported to the SEC under Generally Accepted Accounting Principles. Lamentably companies now tend to use fake pro-forma earnings to downplay real GAAP results. These are derided as EBS profits, Everything but the Bad Stuff! Certain expenses are simply ignored on a pro-forma basis to artificially inflate reported corporate profits, often misleading traders.
While I’m also collecting the earnings-per-share data Wall Street loves, it is more important to consider total profits. Stock buybacks are executed to manipulate EPS higher, because the shares-outstanding denominator of its calculation shrinks as shares are repurchased. Raw profits are a cleaner measure, again effectively neutralizing the impacts of stock buybacks. They better reflect underlying business performance.
Finally the trailing-twelve-month price-to-earnings ratios as of the end of Q2’19 are noted. TTM P/Es look at the last four reported quarters of actual GAAP profits compared to prevailing stock prices. They are the gold-standard valuation metric. Wall Street often intentionally conceals these real P/Es by using fictional forward P/Es instead, which are literally mere guesses about future profits that almost always prove too optimistic.
These are mostly calendar-Q2 results, but some big U.S. stocks use fiscal quarters offset from normal ones. Walmart, Cisco, and Home Depot have lagging quarters ending one month after calendar ones, so their results here are current to the end of April instead of June. Oracle uses quarters that end one month before calendar ones, so its results are as of the end of May. Such offset reporting ought to be banned.
Reporting on offset quarters renders companies’ results way less comparable with the vast majority that report on calendar quarters. We traders all naturally think in calendar-quarter terms too. Decades ago there were valid business reasons to run on offset fiscal quarters. But today’s sophisticated accounting systems that are largely automated running in real-time eliminate all excuses for not reporting normally.
Stocks with symbols highlighted in blue have newly climbed into the ranks of the SPX’s top 34 companies over the past year, as investors bid up their stock prices and thus market caps relative to their peers. Overall the big US stocks’ Q2’19 results looked decent, with modest sales and profits growth. But these growth rates are really slowing, and stock valuations remain near bubble levels relative to underlying earnings.
Over the past 19.3 years, I’ve written 873 of these weekly web essays. None are more challenging than these ones analyzing quarterly results. There’s so much data to collect and analyze, so much work to do. So it wasn’t until Q4’17 results that I took on this Herculean task. Understanding the fundamentals of big U.S. stocks is critical to gaming likely coming stock-market performance, so the hard work is well worth it.
Out of the 7 quarters so far in this essay series, the concentration of capital in the top 34 SPX companies has never been higher. A staggering 44.2% of the market capitalization of all 500 stocks is centralized in just 34 stocks! This compares to 41.7% in Q1’18. It is not healthy for a shrinking pool of market-darling stocks to dominate the entire US markets. That leaves market performance overly dependent on them.
Much of this ominous concentration risk comes from the beloved mega-cap technology companies. The SPX’s top 5 component stocks are Microsoft, Amazon, Apple, Alphabet, and Facebook. They commanded fully 16.2% of the SPX’s entire market cap at the end of Q2, nearly 1/6th! Thus if any one of them gets hit by bad company-specific news, it will help drag the entire stock markets lower intensifying any selling.
One of the cool perks of being a professional speculator and newsletter guy is I get to listen to financial television including CNBC and Bloomberg all day every day. That offers excellent reads on the prevailing sentiment that drives markets. Almost every professional money manager interviewed loves these elite mega-cap techs, including them in their top holdings. They are universally-held and incredibly-crowded trades.
When capital deployed in stocks becomes overly concentrated, that feeds on itself for awhile. Investors deploy capital with money managers based on their performance. If they don’t own these mega-cap techs that investment inflows have driven higher for years, they risk falling behind their peers and losing business. So money managers feel forced to buy the high-flying mega-cap techs even at lofty valuations.
Interestingly these guys try to justify their heavy mega-cap-tech holdings by claiming these stocks are less risky than the broader markets because their businesses are so strong. I can’t count the number of times I’ve heard that mega-cap techs are what to own in case of a recession. That’s total nonsense, as high-flying really-popular stocks have greater downside. The more capital invested, the more potential selling.
During that severe near-bear correction where the SPX plummeted 19.8% largely in Q4’18, these top 5 SPX stocks amplified that by 1.3x with a 24.8% average drop. When the SPX pulled back 6.8% mostly in May, MSFT, AMZN, AAPL, GOOGL, and FB averaged big 12.5% declines nearly doubling the SPX’s retreat! And during the sharp 6.0% SPX pullback since late July, their average fall of 7.8% again leveraged it 1.3x.
The serious risks of too much capital in too few stocks aside, the big U.S. stocks as a group enjoyed a solid Q2 fundamentally. Their collective revenues grew 2.7% year-over-year to $978.8b. Much of this was concentrated in those 5 mega-cap tech stocks, which averaged amazing 16.0% top-line growth compared to just 4.4% for the rest of the top 34 SPX stocks. Money managers use this to rationalize being overweight.
These elite tech market-darlings are certainly not recession-proof, despite the euphoria surrounding them. Recessions are often triggered by stock bear markets, which generate enough fear to scare both consumers and businesses into pulling in their horns and spending less. That is likely to lead to falling sales for all 5 of these mega-cap techs, which will hammer their prices sharply lower sucking in the SPX.
Businesses will cut back on their information-technology spending if they are worried about their own sales, hurting the fast-growing cloud-computing sides of Amazon, Microsoft, and Google. Companies will also cut back on their marketing spends if their own perceived prospects dim sufficiently, leading to lower revenues for Google, Facebook, and even Amazon. These high-flying stocks will really suffer in a bear market.
On the consumer side, the sales of Apple’s expensive products will plunge dramatically when consumers get worried about their own futures. They will keep their existing iPhones and iPads longer, extending the critical upgrade cycle. And most of the endless stuff Amazon sells is discretionary not essential, so those purchases will be cut back when people feel financially stressed. The top SPX stocks aren’t immune to a slowdown.
In Q2’19 these top 34 SPX and SPY stocks saw operating-cash-flow generation soar 17.0% YoY to $144.8b. Again those 5 mega-cap techs led the way, with 21.0% average growth compared to 12.9% for the rest. But these market-darling tech companies benefit heavily from the great optimism spawned by record-high stock markets. That convinces both companies and consumers to heavily buy their offerings.
The GAAP-earnings front was more interesting, with these big US stocks’ total profits up just 4.2% YoY to $140.5b in Q2’19. These were dragged down by a couple notable losses, including Procter & Gamble writing down $8.3b in a massive goodwill-impairment charge. That was an admission this company paid far too much for its Gillette shaving business, as men are shaving less and increasingly using cheaper razors.
Then Boeing suffered an ugly $3.4b loss from operations due to its ill-fated 737 MAX airplane. This is a 1960s-era airframe that was upgraded with engines far larger than ever intended in order to maximize fuel efficiency. But these wouldn’t fit under the wings, so they were mounted forward and higher. That screwed up this airplane’s center of gravity and aerodynamics, requiring computer assistance to keep flying.
Either this inherently-unstable flawed design or software bugs caused two horrific crashes killing 346 people. So the entire 737 MAX fleet was grounded, and that airplane was supposed to generate about a third of Boeing’s revenue over the next 5 years! So this company is in a world of hurt until well after this airplane is cleared to fly again. Overall SPX-top-34 profits would’ve been even higher without these losses.
While 4.2% profits growth sounds good, it is still slowing sharply. Overall SPX corporate-earnings growth rocketed 20.5% higher in 2018 largely thanks to the Tax Cuts and Jobs Act. Its centerpiece slashed the US corporate tax rate from 35% to 21%, which went effective as last year dawned. 2018’s four quarters were the only ones comparing pre- and post-TCJA earnings. This year the comparisons are all post-tax-cut.
Thanks to the stock markets’ massive corporate-tax-cut rally in 2017 and 2018, and sharp rebound on the Fed’s radical shift to dovishness earlier this year, valuations remain dangerously high. They are still up near historical bubble levels heralding new bear markets. So low-single-digit earnings growth, with the threat of actual shrinkage in future quarters, isn’t likely to be enough to support these lofty stock prices for long.
Before we get to valuations though, there’s more to consider on the big US stocks’ earnings. One of the main reasons corporations engage in stock buybacks is to artificially boost their reported earnings per share. That masks what their underlying overall GAAP profits are doing, lulling traders into complacency. Some of the companies among these top 34 had yawning gulfs between earnings per share and total profits!
The main culprits were the top 4 mega-cap US banks, JPMorgan Chase, Bank of America, Wells Fargo, and Citigroup. Their financial reporting is mind-bogglingly complex, and full of estimates that allow them to actively manipulate their reported earnings per share. Wall Street loves the big financial stocks, which are often the most-important sector after mega-cap tech for coloring sentiment for the entire stock markets.
JPM’s EPS soared 22.5% YoY in Q2 despite total GAAP earnings only up 10.5%. BAC looked similar at 17.2% EPS growth versus 8.3% overall profits growth. WFC saw earnings per share soar 33.7% YoY despite overall earnings only rising 19.7%. And C’s 19.0% EPS surge literally tripled its 6.3% growth in hard GAAP profits! Something is really wrong here and highly misleading, eventually the truth will catch up.
Some big non-financial stocks also had magical earnings-per-share growth far outstripping underlying corporate-profits growth. Cisco’s EPS rocketed 25.0% higher despite mere 13.1% growth in the bottom-line profits on its income statement. Sooner or later there has to be a reckoning between earnings per share and actual profits, even if huge stock buybacks persist. These key profits measures have to converge.
Wall Street analysts have grown adept at using misdirection to blind investors to the adverse trends in earnings growth. Mighty Apple was a key case in point recently, reporting its Q2’19 results after the close on July 30th. This was heralded as a big beat, with EPS of $2.18 on revenues of $53.8b both exceeding expectations of $2.10 and $53.4b. By those metrics it looked like Apple was thriving, so its stock shot higher.
In after-hours trading it was up 4%+, and by the middle of the next day this monster-market-cap stock had rocketed 6.0% higher! The problem was comparing those Q2 results to estimates is totally deceptive. The analysts always lowball their guesses to ensure companies beat, stoking euphoria and complacency. But all that really matters is companies’ absolute profits and sales growth compared to their year-earlier quarters.
In hard year-over-year terms, Apple’s Q2’19 sales only eked out a 1.0% gain. That was pathetic relative to its other 4 mega-cap-tech peers, which averaged 19.7%. And Apple’s Q2’19 GAAP earnings actually plunged 12.8% YoY from Q2’18! So what Wall Street dishonestly spun into a great quarter was in reality a weaker one. Eventually stock prices have to reflect underlying fundamentals, not perma-bull propaganda.
Ominously stock prices remain dangerously high relative to their underlying corporate earnings. The big U.S. stocks averaged trailing-twelve-month price-to-earnings ratios way up at 27.5x as Q2’19 wrapped up. That is just shy of the historical bubble threshold above 28x! So the current earnings picture over the past 4 quarters certainly doesn’t justify such lofty stock prices. That greatly amplifies market downside risk.
These chronic overvaluations aren’t just concentrated in those top 5 mega-cap tech stocks, which sported 36.2x average P/Es. The rest of the top 34 were still near bubble territory averaging 25.9x. Trading at such high valuations, these stock markets are an accident waiting to happen. It’s only a matter of time until the next bear market arrives. It could be spawned by the mounting US-China trade war, or weaker profits.
Over the past several calendar years, earnings growth among all 500 SPX companies ran 9.3%, 16.2%, and 20.5%. This year even Wall Street analysts expect it to be flat at best. And if corporate revenues actually start shrinking due to mounting trade wars or rolling-over stock markets damaging confidence and spending, profits will amplify that downside. Declining SPX profits will proportionally boost valuations.
Excessive valuations after long bulls always eventually spawn proportional bear markets. And we are way overdue for the next one. At its latest all-time-record high in late July, this current monster SPX bull up 347.3% in 10.4 years ranked as the 2nd-largest and 1st-longest in all of US stock-market history! This powerful secular uptrend can’t persist near bubble valuations as corporate-earnings growth stalls or even reverses.
Bear markets are necessary to maul stock prices sideways to lower long enough for profits to catch up with lofty stock prices. These fearsome beasts are nothing to be trifled with, yet complacent traders mock them. The SPX’s last couple bears that awoke and ravaged due to high valuations pummeled the SPX 49.1% lower in 2.6 years leading into October 2002, and 56.8% lower over 1.4 years leading into March 2009!
Seeing big US stocks’ prices cut in half or worse is common and expected in major bear markets. And there’s a decent chance the current near-bubble valuations in US stock markets will soon look even more extreme. If the big US stocks’ fundamentals deteriorate, the overdue bear reckoning after this monster bull is even more certain. So big US stocks’ coming Q3’19 and Q4’19 results could prove pivotal if they’re weak.
Cash is king in bear markets, since its buying power grows. Investors who hold cash during a 50% bear market can double their holdings at the bottom by buying back their stocks at half-price. But cash doesn’t appreciate in value like gold, which actually grows wealth during major stock-market bears. When stock markets weaken its investment demand surges, which happened in December as the SPX sold off hard.
While the SPX plunged 9.2% that month, gold rallied 4.9% as investors flocked back. The gold miners’ stocks which leverage gold’s gains fared even better, with their leading index surging 10.7% higher. The last time a major SPX selloff awakened gold in the first half of 2016, it soared up 30% fueling a massive 182% gold-stock upleg! Gold’s awesome decisive bull breakout in late June is already attracting traders back.
Absolutely essential to weathering bears is cultivating excellent contrarian intelligence sources. That’s our specialty at Zeal. After decades studying the markets and trading, we really walk the contrarian walk. We buy low when few others will, so we can later sell high when few others can. Lately we’ve been doing this in gold stocks, buying them while out of favor earlier this year to enjoy massive gains in recent months.
This past week we realized absolute gains on gold-stock trades including 109.7%, 105.8%, and 92.0%! All our trades, analyses, and outlooks are detailed in our popular weekly and monthly newsletters for speculators and investors. They draw on my vast experience, knowledge, wisdom, and ongoing research to explain what’s going on in the markets, why, and how to trade them with specific stocks. Subscribe today and take advantage of our 20%-off summer-doldrums sale! Staying informed is essential for success.
The bottom line is big U.S. stocks’ latest fundamentals from Q2’19’s earnings season were decent. These elite companies enjoyed modest sales and earnings growth. But that masked serious and mounting risks. Investment capital is increasingly concentrating in the beloved mega-cap technology stocks, leaving stock markets overly dependent on their fortunes. Any slowing from them will drag the entire stock markets lower.
More ominously big U.S. stocks’ valuations remain way up near dangerous bubble territory. Their earnings aren’t justifying their lofty stock prices. The resulting downside risks are exacerbated with profits growth really slowing, and threatening to stall out entirely or even shrink in coming quarters. This is a potently-bearish situation, even before any bad news like further escalation in the US-China trade war hits stocks.
The U.S. stock markets sure feel inflectiony, at a major juncture. After achieving new all-time record highs, sentiment was euphoric heading into this week. But those latest heights could be a massive triple top that formed over 15 months. Then heavy selling erupted in recent days as the U.S.-China trade war suddenly went hostile. The big U.S. stocks just-reported Q1’19 fundamentals will help determine where markets go next.
Four times a year publicly-traded companies release treasure troves of valuable information in the form of quarterly reports. Required by the U.S. Securities and Exchange Commission, these 10-Qs and 10-Ks contain the best fundamental data available to traders. They dispel all the sentiment distortions inevitably surrounding prevailing stock-price levels, revealing corporations’ underlying hard fundamental realities.
The deadline for filing 10-Qs for “large accelerated filers” is 40 days after fiscal quarter-ends. The SEC defines this as companies with market capitalizations over $700m. That currently includes every stock in the flagship S&P 500 stock index (SPX), which contains the biggest and best American companies. The middle of this week marked 38 days since the end of Q1, so almost all the big U.S. stocks have reported.
The SPX is the world’s most-important stock index by far, with its components commanding a staggering collective market cap of $24.9t at the end of Q1! The vast majority of investors own the big U.S. stocks of the SPX, as some combination of them are usually the top holdings of nearly every investment fund. That includes retirement capital, so the fortunes of the big U.S. stocks are crucial for Americans’ overall wealth.
The major ETFs that track the S&P 500 dominate the increasingly-popular passive-investment strategies as well. The SPY SPDR S&P 500 ETF, IVV iShares Core S&P 500 ETF, and VOO Vanguard S&P 500 ETF are among the largest in the world. This week they reported colossal net assets running $271.9b, $175.1b, and $111.5b respectively! The big SPX companies overwhelmingly drive the entire stock markets.
Q1’19 proved extraordinary, the SPX soaring 13.1% higher in a massive rebound rally after suffering a severe correction largely in Q4. That pummeled this key benchmark stock index 19.8% lower in jU.S.t 3.1 months, right on the verge of entering a new bear market at -20%. By the end of Q1, fully 5/6ths of those deep losses had been reversed. Did the big U.S. stocks’ fundamental performances support such huge gains?
Corporate-earnings growth was expected to slow dramatically in Q1, stalling out after soaring 20.5% last year. 2018’s four quarters straddled the Tax Cuts and Jobs Act, which became law right when that year dawned. Its centerpiece was slashing the U.S. corporate tax rate from 35% to 21%, which naturally greatly boosted profits from pre-TCJA levels. Q1’19 would be the first quarter with post-TCJA year-over-year comparisons.
Big U.S. stocks’ valuations, where their stock prices are trading relative to their underlying earnings, offer critical clues on what is likely coming next. By late April the epic stock-market bull as measured by the SPX extended to huge 335.4% gains over 10.1 years! That clocked in as the second-largest and first-longest bull in U.S. stock-market history. With the inevitable subsequent bear overdue, valuations really matter.
Every quarter I analyze the top 34 SPX/SPY component stocks ranked by market cap. This is just an arbitrary number that fits neatly into the tables below, but a dominant sample of the SPX. As Q1 waned, these American giants alone commanded fully 43.7% of the SPX’s total weighting! Their $10.9t collective market cap exceeded that of the bottom 437 SPX companies. Big U.S. stocks’ importance cannot be overstated.
I wade through the 10-Q or 10-K SEC filings of these top SPX companies for a ton of fundamental data I feed into a spreadsheet for analysis. The highlights make it into these tables below. They start with each company’s symbol, weighting in the SPX and SPY, and market cap as of the final trading day of Q1’19. That’s followed by the year-over-year change in each company’s market capitalization, an important metric.
Major U.S. corporations have been engaged in a wildly-unprecedented stock-buyback binge ever since the Fed forced interest rates to deep artificial lows during 2008’s stock panic. Thus, the appreciation in their share prices also reflects shrinking shares outstanding. Looking at market-cap changes instead of just underlying share-price changes effectively normalizes out stock buybacks, offering purer views of value.
That’s followed by quarterly sales along with their YoY change. Top-line revenues are one of the best indicators of businesses’ health. While profits can be easily manipulated quarter to quarter by playing with all kinds of accounting estimates, sales are tougher to artificially inflate. Ultimately sales growth is necessary for companies to expand, as bottom-line profits growth driven by cost-cutting is inherently limited.
Operating cash flows are also important, showing how much capital companies’ businesses are actually generating. Companies must be cash-flow-positive to survive and thrive, using their existing capital to make more cash. Unfortunately many companies now obscure quarterly OCFs by reporting them in year-to-date terms, lumping multiple quarters together. So if necessary to get Q1’s OCFs, I subtracted prior quarters’.
Next are the actual hard quarterly earnings that must be reported to the SEC under Generally Accepted Accounting Principles. Lamentably companies now tend to use fake pro-forma earnings to downplay real GAAP results. These are derided as EBS profits, Everything but the Bad Stuff! Certain expenses are simply ignored on a pro-forma basis to artificially inflate reported corporate profits, often misleading traders.
While we’re also collecting the earnings-per-share data Wall Street loves, it’s more important to consider total profits. Stock buybacks are executed to manipulate EPS higher, because the shares-outstanding denominator of its calculation shrinks as shares are repurchased. Raw profits are a cleaner measure, again effectively neutralizing the impacts of stock buybacks. They better reflect underlying business performance.
Finally the trailing-twelve-month price-to-earnings ratios as of the end of Q1’19 are noted. TTM P/Es look at the last four reported quarters of actual GAAP profits compared to prevailing stock prices. They are the gold-standard metric for valuations. Wall Street often intentionally conceals these real P/Es by using the fictional forward P/Es instead, which are literally mere guesses about future profits that often prove far too optimistic.
These are mostly calendar-Q1 results, but some big U.S. stocks use fiscal quarters offset from normal ones. Walmart, Home Depot, and Cisco have lagging quarters ending one month after calendar ones, so their results here are current to the end of January instead of March. Oracle uses quarters that end one month before calendar ones, so its results are as of the end of February. Offset reporting ought to be banned.
Reporting on offset quarters renders companies’ results way less comparable with the vast majority that report on calendar quarters. We traders all naturally think in calendar-quarter terms too. Decades ago there were valid business reasons to run on offset fiscal quarters. But today’s sophisticated accounting systems that are largely automated running in real-time eliminate all excuses for not reporting normally.
Stocks with symbols highlighted in blue have newly climbed into the ranks of the SPX’s top 34 companies over the past year, as investors bid up their stock prices and thU.S. market caps relative to their peers. Overall the big U.S. stocks’ Q1’19 results looked pretty mixed, with slight sales growth and strong earnings growth. But these growth rates are really slowing, and valuations remain extreme relative to underlying profits.
From the ends of Q1’18 to Q1’19, the S&P 500 rallied 7.3% higher. While solid, that’s not much relative to the extreme euphoria and complacency during this latest earnings season. These stock markets could really be in a massive-triple-top scenario after this record bull run, a menacing bearish omen. The SPX initially peaked at 2872.9 in late January 2018, mere weeks after those record corporate tax cuts went into effect.
Then it quickly plunged 10.2% in 0.4 months, a sharp-yet-shallow-and-short correction. But with overall SPX earnings growth exceeding 20% YoY comparing post-tax-cut quarters to pre-tax-cut ones, this key benchmark clawed back higher and hit 2930.8 in late September 2018. That was merely a 2.0% marginal gain over 7.8 months which saw some of the strongest corporate-profits surges ever from already-high levels.
From there the SPX plummeted 19.8% in 3.1 months in that severe near-bear correction largely in Q4. This trend of slightly-better record highs followed by far-worse selloffs is troubling. By late April 2019 the SPX had stretched to 2945.8, jU.S.t 2.5% above its initial peak 15.1 months earlier. Such paltry gains in a span with record corporate tax cuts and resulting torrid earnings growth should really give traders pause.
Technically these three major record highs look like a massive triple top. The big U.S. stocks’ Q1 results are critical to supporting or refuting this bearish technical picture. The SPX/SPY top 34 did enjoy superior market-cap appreciation from the ends of Q1’18 to Q1’19, averaging 12.8% gains which ran 1.7x those of the entire SPX. That exacerbated the concentration of capital in the largest SPX stocks, the mega-cap techs.
As Q1 ended, 5 of the 6 largest SPX stocks were Microsoft, Apple, Amazon, Alphabet, and Facebook. Together they accounted for a staggering 15.8% of this flagship index’s entire market cap, closing in on 1/6th! These companies are universally adored by investors, owned by the vast majority of all funds and constantly extolled in glowing terms in the financial media. Investors think mega-cap techs can do no wrong.
Last summer these incredible businesses were viewed as recession-proof, effectively impregnable. But even if there’s some truth to that, it doesn’t guarantee mega-cap-tech stock prices will weather a stock-market selloff. During that 19.8% SPX correction mostly in Q4, these 5 dominant SPX stocks and another SPX-top-34 tech darling Netflix averaged ugly 33.3% selloffs! They amplified the SPX’s decline by 1.7x.
No matter how amazing the sales growth among the mega-cap techs, they aren’t only not immune to SPX selloffs but their lofty stock prices make them more vulnerable. Overall the SPX/SPY top 34 companies reported Q1’19 revenues of $969.3b, which was 0.9% YoY higher than the top 34’s in Q1’18. That’s not great performance considering how universally-loved and -owned these companies are among nearly all funds.
Those 6 mega-cap tech stocks did far better, enjoying order-of-magnitude-better revenues growth of 9.9% YoY! Excluding them the rest of the SPX top 34 actually saw total sales slump 1.8% lower YoY, which sure doesn’t sound like a strong economy. If this trend of stalling or slowing revenue growth continues, profits growth will have to start falling sharply in future quarters. Earnings ultimately amplify sales trends.
Even more bearish, Wall Street analysts headed into Q1’19’s earnings season expecting all 500 SPX companies to enjoy 4.7% total revenues growth. But the top 34 that dominate the U.S. stock markets did much worse at 0.9% even with mega-cap techs included. That was definitely a sharp slowdown too, as the SPX top 34 saw 4.2% YoY sales growth in Q4’18. Slowing revenue growth is a real threat to the stock markets.
Remember the SPX surged dramatically in Q1, fueling quite-euphoric sentiment leading into quarter-end. At the same time traders mostly believed that a U.S.-China trade deal would soon be signed, removing the trade-war risks. High tariffs are a serious problem for the gigantic multinational companies leading the SPX, potentially heavily impacting sales. Yet revenue growth was already slowing even before this week!
Trump had twice delayed hiking U.S. tariffs on Chinese imports from 10% to 25%, a good-faith sign giving time for real trade-deal negotiations. But his patience ran out this past Sunday after China backtracked on key previoU.S. commitments. So Trump tweeted the current 10% U.S. tariffs on $200b of annual Chinese imports would surge to 25% today, and warned that 25% tariffs were coming “shortly” on another $325b!
China will retaliate as long as high U.S. tariffs remain in effect. That will really retard U.S. sales from top-34 SPX companies in that country. Beloved market-darling Apple is a great example. This second-biggest stock in the S&P 500 did $10.2b or 17.6% of its Q1’19 sales in China! The U.S.-China trade war heating up in a serious way portends even-weaker revenues going forward for the big U.S. stocks dominating the SPX.
The total operating cash flows generated by the top 34 SPX/SPY companies looked like a disaster in Q1, plummeting 64.4% YoY to $67.8b. Thankfully that is heavily skewed by a couple of the major U.S. banks. JPMorgan Chase and Citigroup reported staggering negative OCFs of $80.9b and $37.6b in Q1, due to colossal $123.1b and $30.4b negative changes in trading assets! This seems really confusing to me.
Mega-bank financials are fantastically-complex, and no one can hope to understand them unless deeply immersed in that world. I’ve been a certified public accountant for decades now, spending vast amounts of time buried in 10-Qs and 10-Ks to fuel my stock trading. Yet even with my background and experience I can’t interpret mega-bank results. It seems weird trading assets plummeted in Q1 as the SPX surged sharply.
But rather than getting bogged down in mega-bank arcania that may be impossible to comprehend by outsiders, we can just exclude the four SPX-top-34 mega-banks from our OCF analysis. They include JPMorgan Chase, Bank of America, Wells Fargo, and Citigroup. Without them, the rest of the SPX top 34 reported total OCFs of $163.2b in Q1’19. That was dead-flat ex-banks, up just 0.3% YoY from Q1’18’s OCFs.
So the big U.S. stocks’ operating-cash-flow generation really slowed too in Q1, stalling out compared to hefty 11.5% YoY growth in Q4’18. That’s another sign that the U.S. economy must be slowing despite the red-hot stock markets. That’s ominous and bearish considering the coming headwinds if the trade wars continue and if the stock markets roll over decisively. Future quarters’ business environments won’t be as good.
Earnings were a different story entirely last quarter, soaring dramatically among the SPX/SPY top 34. They totaled $149.8b, surging an enormous 36.1% YoY! But that was skewed way higher by Warren Buffett’s famous Berkshire Hathaway, the biggest SPX stock after the mega-cap techs. BRK reported a monster Q1 profit of $21.7b, compared to a $1.1b loss a year earlier. That accounted for 1/7th of the top 34’s total.
But Berkshire’s epic profits are due to the sharp stock-market rebound rally, not underlying operations. A new accounting rule that Warren Buffett hates and rails against at every opportunity requires unrealized capital gains and losses to be flushed through quarterly profits. Thus when the SPX plunged in Q4’18, BRK reported a colossal $25.4b GAAP loss. That was largely reversed in Q1’19 with its gigantic $21.7b gain.
Excluding the $16.1b of BRK’s Q1 profits that were mark-to-market stock-price gains, the SPX top 34’s total profits grew 21.5% YoY to $133.6b in Q1. That’s still impressive, but it masks some big problems on the corporate-earnings front. Those 6 elite mega-cap tech companies dominating the SPX actually saw their collective Q1 GAAP profits plunge 11.2% YoY! Apple, Alphabet, and Facebook suffered sharp declines.
Usually mega-cap tech stocks are the profits engine driving the entire SPX higher. If these market-darling companies that are universally-loved and -held struggled with earnings growth in Q1, what does that say about profits going forward? And again profits can be manipulated quarter-to-quarter by playing with all kinds of accounting estimates. So if anything corporate profits are overstated instead of understated.
One of Wall Street’s great farces is the game of comparing quarterly results to expectations instead of what they were in the comparable quarter a year earlier. Mighty Apple is a great example, reporting after the close on April 30th. Its Q1 earnings per share and sales of $2.47 and $58.0b came in ahead of Wall Street expectations of $2.37 and $57.5b. So Apple’s stock surged 4.9% the next day on those “great results”.
But that expectations bar had been lowered dramatically, which is the only reason Apple beat. On an absolute year-over-year basis compared to Q1’18, Q1’19 saw sales drop 5.1%, OCFs plummet 26.3%, and earnings plunge 16.4% YoY! That was quite weak, and couldn’t be considered good by any honest measure. In this recent Q1 earnings season, the fake expectations game obscured plenty of real weakness.
Yet overall SPX-top-34 profits growth still remained strong, with companies suffering drops offset by other companies seeing big jumps. But earnings can’t be considered in isolation, they are only relevant relative to underlying stock prices. Imagine you own a rental house and someone offers you $1000 a month to move in. The reasonableness of that earnings stream is totally dependent on the value of your property.
If your house is worth $100k, $1k a month looks great. But if it’s worth $1m, $1k a month is terrible. The profits anything generates are only measurable relative to the capital invested in that asset. The classic trailing-twelve-month price-to-earnings ratios show how expensive stock prices are relative to underlying corporate profits. Big SPX-top-34 earnings growth isn’t bullish if overall profits are low compared to stock prices.
At the end of Q1’19 proper before these Q1 results were reported, the SPX/SPY top 34 component stocks averaged TTM P/Es of 30.4x. That is definitely improving compared to the prior four quarters’ trend of 46.0x, 53.4x, 49.0x, and 39.7x. But 30.4x is still dangerously high absolutely. Over the past century-and-a-quarter or so, fair value for the U.S. stock markets was 14x. Double that at 28x is where bubble territory begins.
So the big U.S. stocks were literally trading at bubble valuations exiting Q1! Their stock prices were far too high relative to their underlying earnings production compared to almost all of U.S. stock-market history. And this wasn’t just a mega-cap-tech-stock thing, with these elite companies often being bid to really-high valuations compared to other sectors. The 6 mega-cap techs we’ve discussed indeed averaged a crazy 52.0x.
But the other 28 top-34-SPX companies remained very expensive near bubble territory even excluding the tech giants, averaging 25.8x! Even the strong Q1’19 earnings growth didn’t help much. At the end of April as those Q1 results started to work into TTM P/E calculations, the SPX top 34 averaged a slightly-higher P/E of 31.0x. Literal bubble valuations with stock markets trading near all-time record highs are ominous.
Just last Friday when the SPX closed right at its highest levels in history, I wrote a contrarian essay on these “Dangerous Stock Markets”. It explained how high valuations kill bull markets, summoning bears that are necessary to maul stock prices sideways to lower long enough for profits to catch up with lofty stock prices. These fearsome beasts are nothing to be trifled with, yet complacent traders mock them.
The SPX’s last couple bears that awoke and ravaged due to high valuations pummeled the SPX 49.1% lower in 2.6 years leading into October 2002, and 56.8% lower over 1.4 years leading into March 2009! Seeing big U.S. stocks’ prices cut in half or worse is common and expected in major bear markets. And there’s a decent chance the current bubble valuations in U.S. stock markets will soon look even more extreme.
Over the past several calendar years, earnings growth among all 500 SPX companies ran 9.3%, 16.2%, and 20.5%. This year even Wall Street analysts expect it to be flat at best. And if corporate revenues actually start shrinking due to mounting trade wars or rolling-over stock markets damaging confidence and spending, profits will amplify that downside. Declining SPX profits will proportionally boost valuations.
If the big U.S. stocks’ fundamentals deteriorate, the overdue bear reckoning after this monster bull is even more certain. Cash is king in bear markets, since its buying power grows. Investors who hold cash during a 50% bear market can double their holdings at the bottom by buying back their stocks at half-price. But cash doesn’t appreciate in value like gold, which actually grows wealth during major stock-market bears.
Gold investment demand surges as stock markets weaken, as we got a taste of in December. While the SPX plunged 9.2%, gold rallied 4.9% as investors flocked back. The gold miners’ stocks which leverage gold’s gains fared even better, with their leading index surging 10.7% higher. The last time a major SPX selloff awakened gold in the first half of 2016, it soared 30% higher fueling a massive 182% gold-stock upleg!
Absolutely essential in bear markets is cultivating excellent contrarian intelligence sources. That’s our specialty at Zeal. After decades studying the markets and trading, we really walk the contrarian walk. We buy low when few others will, so we can later sell high when few others can. While Wall Street will deny this coming stock-market bear all the way down, we will help you both understand it and prosper during it.
We’ve long published acclaimed weekly and monthly newsletters for speculators and investors. They draw on my vast experience, knowledge, wisdom, and ongoing research to explain what’s going on in the markets, why, and how to trade them with specific stocks. As of Q1 we’ve recommended and realized 1089 newsletter stock trades since 2001, averaging annualized realized gains of +15.8%! That’s nearly double the long-term stock-market average. Subscribe today for just $12 per issue!
The bottom line is the big U.S. stocks’ Q1’19 results were pretty mixed despite the surging stock markets. Revenues and operating cash flows only grew slightly, which were sharp slowdowns from big surges in previous quarters. While earnings somehow defied sales to soar dramatically again, that disconnect can’t persist. A slowdown looked to be underway even before the U.S.-China trade war flared much hotter this week.
Even the surging corporate profits weren’t enough to rescue super-expensive stock markets from extreme bubble valuations. They are what spawn major bear markets, which are necessary to maul stock prices long enough for valuations to mean revert lower. Make no mistake, these overvalued stock markets are still an accident waiting to happen. Stock investors should diversify, adding substantial gold allocations.
Adam Hamilton, CPA
May 15, 2019
Copyright 2000 – 2019 Zeal LLC (www.ZealLLC.com)
These record U.S. stock-market levels are very dangerous, riddled with extreme levels of euphoria and complacency. Largely thanks to the Fed, traders are convinced stocks can rally indefinitely. But stock prices are very expensive relative to underlying corporate earnings, with valuations back up near bubble levels. These are classic topping signs, with profits growth stalling and the Fed out of easy dovish ammunition.
Stock markets are forever cyclical, meandering in an endless series of bulls and bears. The latter phase of these cycles is inevitable, like winter following summer. Traders grow too excited in bull markets, and bid up stock prices far higher than their fundamentals support. Subsequent bear markets are necessary to eradicate unsustainable valuation excesses, forcing stock prices sideways to lower until profits catch up.
This latest bull market grew into a raging monster largely fueled by extreme Fed easing. At its latest all-time record peak hit just this week, the flagship US S&P 500 broad-market stock index (SPX) has soared 335.4% higher over 10.1 years! That makes for the second-biggest and first-longest bull in US history, only possible because it gorged on $3625b of quantitative-easing money printing by the Fed over 6.7 years.
That epic 5.3x mushrooming of the Fed’s balance sheet peaked in February 2015, when the SPX was just clawing over 2100. It soon coasted to a 2130.8 topping in May 2015, before trading sideways to lower for 13.7 months without Fed QE. Modest new highs weren’t seen until July 2016, after the U.K.’s Brexit-vote surprise kindled hopes for more central-bank easing. Another surprise event drove the final third of this bull.
The November 2016 elections were a Republican sweep, with Trump winning the presidency while his party controlled both chambers of Congress. So the SPX started surging to new record highs, initially on hopes for big tax cuts soon and later on record corporate tax cuts becoming law. That ultimately propelled the SPX to 2872.9 in late January 2018 and 2930.8 in late September 2018, lofty new all-time record highs.
But paraphrasing an ancient Biblical passage from Job, the Fed gave then the Fed took away. Right after the SPX peaked, the Fed ramped its year-old quantitative-tightening campaign to full speed in Q4’18. QT was supposed to unwind a large fraction of that $3625b of QE-conjured money, shrinking the Fed’s crazy-bloated balance sheet. $50b per month of QT monetary destruction had to be this QE-fueled bull’s death knell!
Indeed the stock markets crumbled under that Fed-tightening onslaught, plunging 19.8% over the next 3.1 months into late December 2018. That severe correction was right on the verge of crossing the -20% threshold into new-bear territory. Over a third of those serious losses happened in just 4 trading days after the Fed chairman declared full-speed QT was “on automatic pilot”. By that time the SPX was very oversold.
Stock-market extremes never last long, with big and sharp mean-reversion bounces following major selloffs. The SPX reversed hard and soared into early 2019, already 12.3% higher by late January. Then the Fed’s first policy decision after that stock-crushing QT-autopilot one saw this central bank completely cave to the stock markets. It removed references to further rate hikes and declared it was ready to adjust QT.
That dovishness unleashed more waves of momentum buying. By the eve of the Fed’s next meeting in mid-March, the SPX had rocketed 20.5% above its severe-correction near-bear low. But that wasn’t good enough for the Fed, which slashed its future-rate-hike outlook while declaring it would essentially stop QT by September 2019. That is very premature, implying less than 23% of the Fed’s total QE will be unwound!
That goosed the stock markets again, helping push the SPX to an enormous 25.3% rebound-rally gain by this week. At 2945.8, it had edged 0.5% above late September’s then-record peak. With stock markets more than regaining their big losses, euphoria and complacency exploded again. These herd emotions have proven dangerous in market history, marking major toppings including terminal bulls rolling over to bears.
Euphoria is simply “a strong feeling of happiness, confidence, or well-being”. It is always accompanied by complacency, which is “a feeling of contentment or self-satisfaction, especially when coupled with an unawareness of danger or trouble”. This perfectly describes the stock markets’ sentiment-scape in recent months. Speculators and investors just love these lofty stock prices, with virtually no fear of material selloffs.
While euphoria and complacency are ethereal and unmeasurable, they can be inferred. The classic VIX fear gauge is the most-popular way. It quantifies the implied volatility options traders expect in the SPX over the next month, as expressed through their collective trades. While a high VIX reveals fear, a low one shows the direct opposite which is complacency. In mid-April the VIX revisited ominous bull-slaying levels.
This chart superimposes the SPX over its VIX sentiment indicator over the past several years or so. This monster Fed-QE-fueled stock bull sure looks to be carving a massive triple top in its terminal phase. At best in late April, the SPX had merely clawed back 2.5% over its initial peak of late January 2018. That’s terrible progress across 15.1 months where the biggest corporate tax cuts in US history greatly boosted profits.
While the first two-thirds of this monster bull were directly driven by the Fed’s extreme QE, the final third was corporate-tax-cut driven. Starting with that November 2016 Republican sweep, there was enormous anticipation of what eventually became the Tax Cuts and Jobs Act. Signed into law in December 2017, it went into effect as 2018 dawned. Its centerpiece was slashing the US corporate tax rate from 35% to 21%.
The SPX surged 19.4% in 2017 in the thrall of taxphoria hopes, driving 62 new record-high closes out of 251 trading days! The first 18 trading days of 2018 saw another 14 more, catapulting both euphoria and complacency off the charts. The VIX slumped into the 9s early that peaking month, proving that fear was nonexistent. Virtually no one expected a selloff when the SPX peaked at 2872.9, when the VIX closed at 11.1.
But just when traders were convinced stock markets could rally indefinitely with no material selloffs, the SPX suddenly nosed over into its first correction in 2.0 years. While sharp yet shallow and short at a 10.2% loss in just 0.4 months, it was a warning shot. Even with elite SPX companies’ corporate profits expected to soar 20%+ that year due to those big tax cuts, stock markets were already too high to rally much.
After that minor flash correction, the SPX started marching higher again throughout 2018. It wasn’t able to eclipse January’s maiden peak until late August, and ultimately crested merely 2.0% above it in late September. Such meager gains again suggested the corporate tax cuts were nearly fully priced in during 2017, leaving little room for additional gains. The day the SPX peaked at 2930.8, the VIX closed at 11.8.
Once again traders’ euphoria and complacency were extreme. The pressure on contrarians to capitulate was immense. But given the extreme stock-market technicals, sentiment, and valuations, I stuck to my guns warning how dangerous the stock markets were. Just a week after that all-time record high in the SPX, I published an essay warning “Fed QT is Bull’s Death Knell” one trading day before QT hit terminal velocity.
Indeed the stock markets fell hard, plunging 19.8% over 3.1 months into late December! That correction was much larger and more menacing than early 2018’s, on the edge of formal bear-market territory. And it happened despite SPX companies’ earnings actually blasting 20.5% higher year-over-year in 2018. Two corrections, including a serious one, in one of the best corporate-profits years on record should give pause.
The stock markets were due for a sharp mean-reversion rebound higher after such a steep drop. But the Fed waxing hyper-dovish and killing both its rate-hike cycle and QT really artificially extended it. Just over half the total rebound rally came after the Fed utterly surrendered to stock traders starting in late January. Many larger SPX-rally days clustered around dovish Fed announcements, they really amplified this rally.
It looked and felt exactly like a bear-market rally, the biggest and fastest ever witnessed in stock markets. The SPX soared in a symmetrical V-bounce out of late December’s deep lows. Those gains were front-loaded, fast initially but fading in recent months despite the Fed’s super-dovish jawboning. That severe near-bear correction that spawned this rally also fit the definition of a waterfall decline, an ominous omen.
They are 15%+ SPX selloffs without any interrupting countertrend rallies exceeding 5%. Since 1946 this had happened only 19 previous times. After every single past selloff, 100% of the time, the SPX retested its waterfall-decline lows! All 19 happened in bear markets. After these retests, fully 15 of the 19 were followed by new lower lows as those bears deepened. Only 4 of the 19 waterfall retests climaxed their bears.
So market history is crystal-clear in warning that the wild stock-market action of the past 7.3 months is exceedingly dangerous technically. Yet euphoria and complacency still exploded again in March and April as the SPX kept stretching skywards. By mid-April as the SPX clawed back up to 2907.4, the VIX fell back under 12.0 on close. Those were the lowest levels of fear seen since October 3rd, a bearish portent.
While that was a couple weeks after the SPX’s late-September then-record peak, this leading stock index was still just 0.2% lower. The selling that would grow into the severe near-bear correction began the very next day, and snowballed from there. Right when traders again delude themselves into believing stock markets can rally indefinitely, the hard reality of market cycles slams them like a sledgehammer to the skull.
Extreme levels of euphoria and complacency are always very dangerous, presaging major stock-market selloffs. Low VIX levels following record or near-record stock-market highs should not be trifled with, but considered a dire warning of serious downside risks. Very-high technicals breed very-lopsided sentiment, blinding traders to markets’ perpetual cyclicality. Today’s risks are compounded by near-bubble valuations.
For a century-and-a-quarter or so before the Fed’s insane QE experiment starting in late 2008, the US stock markets had averaged trailing-twelve-month price-to-earnings ratios around 14x earnings. That is considered fair-value, which makes sense. The reciprocal of 14x is 7.1%, which is a fair rate for both investors to earn to let companies use their saved capital and for companies to pay to use those same funds.
But valuations oscillate well above and below fair value in great waves that correspond with bull and bear markets. In bulls stocks are enthusiastically bid to high valuations not justified by their underlying profits. Valuation extremes start at twice fair value, 28x trailing earnings which is formally bubble territory. That necessitates bears to maul stock prices long enough for earnings to catch up, but stocks usually overshoot.
While major bull markets end above 28x, major bear markets often end between 7x to 10x. That’s the time investors should throw all their capital at the stock markets, when stocks are dirt-cheap and deeply out of favor. But instead they foolishly buy high near bull-market tops, which often leads to selling low later at catastrophic losses. The SPX valuations during this 15-month triple-top span have been scary-high.
This next chart shows the actual SPX in red, superimposed over the average trailing-twelve-month price-to-earnings ratios of its 500 elite companies. Their simple average at the end of every month is shown in light blue, and is what I’m using in this essay. The dark-blue line instead weights SPX-component P/Es by their companies’ market capitalizations. The white line shows where the SPX would be at 14x fair-value.
Remember the final third of this monster bull erupted on taxphoria after Trump won the presidency. But following trillions of dollars of QE before that, the SPX wasn’t cheap heading into November 2016. These elite stocks averaged TTM P/Es of 26.3x, just shy of 28x bubble territory. Interestingly that was about the same valuation as the 25.9x when QE ended in February 2015. Stocks had long been very expensive.
SPX corporate earnings did rise nicely in 2017, up about 16%. Republicans streamlining regulations was a factor, but more important was the widespread optimism from stock markets surging to endless new record highs. But the problem was stocks were already so overvalued that higher profits barely made a dent. At best that year the fair-value SPX at 14x hit 1296.0, a staggering 52% below the SPX’s 2017 high!
The SPX first crossed that 28x bubble threshold in late November 2016 after stocks surged higher on that Republican sweep. Valuations hung around 28x until July 2017 when they started climbing even higher. By late January 2018 just after the SPX’s initial peak, its elite companies were averaging TTM P/Es way up at 31.8x! While bubble valuations can persist while euphoria lasts, they are very dangerous for stocks.
SPX corporate-earnings growth in 2018 was amazing, exceeding 20% year-over-year thanks to those record corporate tax cuts. The four quarters of 2018 were the only ones comparing post-tax-cut and pre-tax-cut profits, an enormous one-off discontinuity. Yet damningly the valuations still didn’t retreat, in late September just after the SPX’s record peak its components were still averaging extreme 31.4x TTM P/Es.
That severe near-bear correction largely in Q4 last year certainly helped, dragging valuations back down out of bubble territory. But even at the end of December just after the lows, the SPX was still sporting a 26.1x valuation. That was near bubble territory, right around the levels just before Trump was elected. No bear market would end its predations and start hibernating while valuations remained so darned high!
In recent months many Wall Street apologists have claimed that severe correction was effectively a very-short-lived bear market since it was so close to 20% on a closing basis. They argue that means a new bull is underway that can run for years more. But bears don’t give up their ghosts after a single selloff with price-to-earnings ratios still near bubble levels. Bears ravage until valuations are mauled back under 14x.
Interestingly valuations haven’t soared back up with the massive rebound rally so far this year. By the end of April, the SPX components’ average P/E had only returned to 27.5x. That’s not greatly above the late-December levels. This was due to blowout Q4’18 earnings from SPX companies, the last quarter with profits compared across the Tax Cuts and Jobs Act. Q4’17 also rolled off, which the TCJA heavily distorted.
But 27.5x is still just under bubble territory, dangerously-expensive levels for stocks achieving record highs again. If the inevitable bear following the past decade’s enormous Fed-inflated monster bull just pushed stocks back down to 14x fair value, the SPX would have to plunge way back near 1400. That’s a heck of a long ways down from here, a 52% drop. Cutting stocks in half is right in line with bear-market precedent.
The SPX’s last bear market ran from October 2007 to March 2009, and pummeled this leading American stock index a gut-wrenching 56.8% lower in 1.4 years. That bear-market bottom birthed this current bull, when the SPX traded down to 12.6x earnings. Before that the SPX suffered another bear from March 2000 to October 2002, a 49.1% drop over 2.6 years. So 50%ish SPX losses are par for the course in bears!
Several factors could make this long-overdue next bear even worse. In 2016, 2017, and 2018, the elite SPX companies’ profits grew 9.3%, 16.2%, and 20.5% YoY. This year even Wall Street is forecasting earnings to be flat at best. There’s a real possibility they will even contract in 2019, the first year comparing post-tax-cut quarters. Stalling or shrinking corporate profits make near-bubble valuations even more extreme.
Lower profits actually push valuations even higher, increasing the valuation pressure for a major bear market. And with average month-end SPX TTM P/Es running 30.5x in 2018 at 20% profits growth, there’s no way similar high valuations will fly this year with zero profits growth. The more quarterly earnings fail to climb, the more worried traders will get over high stock prices and the more likely they will start selling.
And after the second-largest and first-longest bull market in US stock-market history, mostly driven by extreme Fed easing no less, the subsequent bear should be proportionally massive. There’s a fairly-high chance this bear won’t stop brutalizing stocks until the average SPX P/E falls near half fair-value around 7x earnings. That’s where the biggest bears in the past have ended, valuations overshot way under 14x.
Finally the Fed is going to have a hard time riding to the rescue again since it has expended all its easy dovish ammunition. It really only has three options left for another dovish surprise, and the latter two are very serious decisions. Top Fed officials’ outlook for rates in their collective dot-plot forecast can still be lowered to show cuts coming. But since these guys downplay the dot plot, that won’t mollify traders for long.
That leaves actually cutting rates or birthing QE4, which are huge course changes that the Fed can’t take lightly or revoke without panicking stock markets! With the Fed just about out of dovish rabbits to pull out of its hat, it doesn’t have many options to slow the selling when stock markets inevitably turn south again. Cutting rates or restarting QE may even exacerbate any selloff, worrying traders about what so scared the Fed.
The overdue bear market is still coming, make no mistake. Extreme technicals, sentiment, and valuations assure it. Investors really need to lighten up on their stock-heavy portfolios, and protect themselves with cash and gold. Holding cash through a 50% bear market allows investors to buy back their stocks at half-price, doubling their holdings. But unlike cash gold actually appreciates in value during bears, growing weath.
Gold investment demand surges as stock markets weaken, as we got a taste of in December. While the SPX plunged 9.2%, gold rallied 4.9% as investors flocked back. The gold miners’ stocks which leverage gold’s gains fared even better, with their leading index surging 10.7% higher. The last time a major SPX selloff awakened gold in the first half of 2016, it soared 30% higher fueling a massive 182% gold-stock upleg!
Absolutely essential in bear markets is cultivating excellent contrarian intelligence sources. That’s our specialty at Zeal. After decades studying the markets and trading, we really walk the contrarian walk. We buy low when few others will, so we can later sell high when few others can. While Wall Street will deny this coming stock-market bear all the way down, we will help you both understand it and prosper during it.
We’ve long published acclaimed weekly and monthly newsletters for speculators and investors. They draw on my vast experience, knowledge, wisdom, and ongoing research to explain what’s going on in the markets, why, and how to trade them with specific stocks. As of Q1 we’ve recommended and realized 1089 newsletter stock trades since 2001, averaging annualized realized gains of +15.8%! That’s nearly double the long-term stock-market average. Subscribe today for just $12 per issue!
The bottom line is these stock markets are very dangerous. A monster bull has been topping over the past year-and-quarter, leading to extreme technicals, sentiment, and valuations. Traders’ euphoria and complacency have been running at bull-slaying levels, while valuations remain way up near perilous bubble territory. All this is happening as corporate profits flatline after surging dramatically on the corporate tax cuts.
Like after every past waterfall decline, the stock markets are due to roll over and retest their deep late-December lows. Odds are they will fail, confirming a major new bear market. And the Fed doesn’t have much dovish ammunition left to retard the heavy selling. Gold investment demand will surge as stocks finally face their reckoning after this artificially-amplified bull. That will push gold and its miners’ stocks far higher.
Prudent profit booking into strength in this gold bull market is important.
Thanks,
Morris Hubbartt
Unique Introduction For Website Readers: Send me an email to signals@superforcesignals.com and I’ll send you 3 of my next Super Force Surge Signals free of charge, as I send them to paid subscribers. Thank you!
Stay alert for our Super Force alerts, sent by email to subscribers, for both the daily charts on Super Force Signals at www.superforcesignals.com and for the 60 minute charts at www.superforce60.com
Frank Johnson: Executive Editor, Macro Risk Manager.
It’s time for the queen of assets to rest and consolidate. Nothing goes up in a straight line, and that’s certainly true for gold!
Please click here now. Double-click to enlarge this daily gold chart.
A pullback to about $1250 would be a healthy 50% retracement of the $100 rally from $1200 to $1300.
Gold begins 2019 with some very positive news in play. Please click here now. After a two-year hiatus, China’s central bank is back in gold market action!
The bank had been consistently buying about 15-20 tons of gold a month. When those purchases are added to buying from Russia and other central banks, they are quite price-supportive.
It’s great to see China back on the buy, and analysts in India are projecting a ramp-up in gold imports there of about 20% for the first six months of 2019.
The ECB (Europe’s central bank) is projecting higher inflation and easing growth for 2019.
The love trade is healthy, the central bank trade is healthy, and global stock markets are on the rocks.
On that note, please click here now. Double-click to enlarge. I’m a bit worried that the US stock market rally could peter out quickly.
Please click here now. Institutional money managers are cutting back their allocations to US equities, and rightly so.
The business cycle is entering the eighth and ninth innings, wage inflation is poised to spike in full-time jobs, and earnings have clearly plateaued.
Please click here now. China’s central bank and government have vastly more “wiggle room” than America’s do to stimulate the economy.
China’s stimulus is inflationary, and that’s good news for gold.
The U.S. government is shut down. That’s not a position of strength, to put it mildly. These shutdowns have happened so many times that citizens are now numb and don’t seem to care.
It’s not a good thing; the government just can’t seem to break its addiction to borrowing more and more money.
The U.S. government has been very vocal in its opposition to the modest interest rate rates from the Fed. I don’t see any economic stress from these hikes, and senior citizens have been paid nothing in their savings accounts for years.
Rate hikes are an indicator that inflation is in the air. They haven’t hurt gold, they help senior citizens, and they put pressure on banks to make business loans rather than finance stock market buybacks to enrich corporate directors.
Rate hikes do put pressure on the ability of the U.S. government to borrow ever-more money, and that pressure is good.
Please click here now. Double-click to enlarge this daily silver chart.
The uptrend is solid. A pullback is normal, expected, and healthy. Note the Fibonacci lines in play around the demand line of the uptrend channel.
Silver feels almost as solid as gold does right now, and that’s likely due to the growing threat of stagflation throughout much of the world.
Please click here now. Double-click to enlarge this nice GDX daily chart.
Like most sectors of the precious metals asset class, GDX is taking a breather after it successfully penetrated key resistance in the $20.70 area.
From a technical perspective, the range trade in the $20-$21.50 area has a 67% chance of being resolved with a rally to $23. The current consolidation could be the last opportunity for excited investors to buy in this price zone before GDX moves above $23 and stays there for quite a long period of time!
Special Offer For Website Readers: Please send me an Email to freereports4@gracelandupdates.com and I’ll send you my free “Silver Stocks Rock!” report. I highlight the SIL and SILJ ETF component stocks that are poised to enter January like silver bullets shot out of a golden gun! I include key tactics to keep investors on the winning side of the action… in both the short and long term!
Stewart Thomson is a retired Merrill Lynch broker. Stewart writes the Graceland Updates daily between 4am-7am. They are sent out around 8am-9am. The newsletter is attractively priced and the format is a unique numbered point form. Giving clarity of each point and saving valuable reading time.
Risks, Disclaimers, Legal
Stewart Thomson is no longer an investment advisor. The information provided by Stewart and Graceland Updates is for general information purposes only. Before taking any action on any investment, it is imperative that you consult with multiple properly licensed, experienced and qualified investment advisors and get numerous opinions before taking any action. Your minimum risk on any investment in the world is: 100% loss of all your money. You may be taking or preparing to take leveraged positions in investments and not know it, exposing yourself to unlimited risks. This is highly concerning if you are an investor in any derivatives products. There is an approx $700 trillion OTC Derivatives Iceberg with a tiny portion written off officially. The bottom line:
Are You Prepared?
The beleaguered gold stocks are recovering from their late-summer capitulation, enjoying a solid young upleg as investors gradually return. Their buying has pushed the leading gold-stock ETF near a major triple breakout technically. That event should really boost capital inflows into this sector, accelerating the rally. A major gold and gold-stock buying catalyst is likely imminent too, a more-dovish Fed this week.
The gold miners’ stocks have always been a small contrarian sector, a little-watched corner of the stock markets. But they’ve been even more unpopular than usual in recent months. That pessimistic sentiment is driven by price action, which has mostly proven poor in 2018. That’s really evident in the performance of the flagship gold-stock investment vehicle, the GDX VanEck Vectors Gold Miners ETF which is struggling.
As of the middle of this week, GDX was down 12.0% year-to-date. That leveraged gold’s YTD decline of 4.4% by 2.7x, which is perfectly normal. Because gold-stock earnings are heavily dependent on prevailing gold levels, gold-stock prices tend to amplify gold’s moves by 2x to 3x. That’s a double-edged sword, really profitable when gold rallies but cutting deeply when it retreats. The drawdowns are challenging to weather.
But gold stocks’ inherent leverage to gold is starting to work again on the upside, portending big gains ahead. This first chart looks at the major gold stocks’ technicals through the lens of GDX over the past several years. This sector soared in a new bull market, plunged with gold after Trump’s surprise election win goosed the stock markets, consolidated sideways to base, and then suffered an extreme capitulation selloff.
Investors and speculators often forget how explosive gold-stock upside is when gold is powering higher in an upleg. In largely the first half of 2016, GDX skyrocketed 151.2% higher in just 6.4 months! Capital just flooded back into the gold miners driven by a new gold bull’s parallel 29.9% upleg. That catapulted GDX to very-overbought levels and a 3.3-year high in mid-2016. So a normal correction got underway soon after.
GDX found support at its critical 200-day moving average, which is often the strongest support zone seen in ongoing bull markets. But that failed in November 2016 after an anomalous surprise. Trump defied the polling and odds to win the presidency while Republicans controlled both chambers of Congress. So the stock markets soared in that election’s wake on euphoric hopes for big tax cuts soon. Gold wilted on that rally.
So the gold stocks naturally followed it lower, again mirroring and amplifying its price action. After it had enjoyed stellar 5.1x upside leverage to gold in its powerful H1’16 upleg, GDX dropped 39.4% over the next 4.4 months. That leveraged gold’s own correction by 2.3x, relatively low in that usual 2x-to-3x range. GDX soon bounced sharply with gold and established a new consolidation trading range between $21 to $25.
The major gold stocks mostly meandered within that GDX range for 21.5 months. While it was vexing at times to see upside-breakout attempts fail, basing consolidations are very bullish. They provide time for bullish newer investors to acquire shares from bearish exiting ones, establishing new price norms well above previous bear-market lows. And the $23 midpoint of that GDX trading range proved relatively high.
This gold-stock bull was born out of fundamentally-absurd lows of GDX $12.47 in mid-January 2016. It peaked at $31.32 in early August that year. Oscillating around $23 on balance, GDX was basing 4/7ths up into its young bull’s entire range. The major gold stocks GDX holds were biding their time waiting for another major gold upleg to catapult them higher. They nearly broke out above $25 in early-September 2017.
But that attempt’s failure damaged psychology so traders gradually sold, this small contrarian sector left for dead. The subsequent lower highs over the next 10.4 months into mid-July 2018 formed a downward-sloping resistance line. Gold-stock prices were being compressed into a bearish descending triangle, as lower highs slumped ever closer to that major $21 support. This sector really needed a major gold rally.
Unfortunately the opposite happened this past summer, gold got hammered crushing the weakened gold stocks. The US stock markets were powering higher trying to regain record highs in July and August 2018, heavily retarding gold investment demand. On top of that the U.S. Dollar Index was surging too, both on expectations for more Fed rate hikes and an emerging-markets currency crisis led by the Turkish lira.
So gold-futures speculators started short selling gold at extreme record levels, blasting their aggregate downside bets far up into anomalous territory never before witnessed. Gold fell sharply on that record gold-futures shorting spree, dragging the struggling gold stocks down with it. So in early August GDX plunged and knifed through its longstanding $21 support. That major breakdown spawned self-feeding selling.
Gold stocks are an exceptionally-volatile sector not for the faint of heart. So it is essential to run loose trailing stop losses on gold-stock positions. While these protect investors from excessive losses, they greatly exacerbate selloffs. The lower gold stocks fell this past summer, the more stop losses were hit. These mechanical automatic sell orders then add to the downside pressure, pushing gold stocks lower still.
That vicious circle of selling begetting selling snowballed into an extreme capitulation in gold stocks, as GDX plummeted in August and early September. In just 5 weeks GDX collapsed 17.0%, far worse than gold stocks should’ve performed with gold merely slipping 1.4% lower in that span. That devastated already-shaky sentiment, leaving most investors and speculators to throw up their hands in disgust and flee.
But with GDX being pummeled to a deep 2.6-year low, the major gold stocks were wildly oversold. I explained all this in depth in an essay on gold stocks’ forced capitulation in mid-September. They were due to mean revert dramatically higher after that extreme selling anomaly. And that process has indeed been underway ever since. The gold stocks have been recovering, clawing their way out of those deep lows.
As usual gold stocks’ dominant primary driver has been gold, which has been grinding higher in its own young upleg as speculators cover their record gold-futures shorts. Investors started returning too when the lofty US stock markets began rolling over hard in mid-October. As of the middle of this week, GDX just hit a new upleg high of $20.45 on close. That extended gains since the capitulation low to 16.4% in 3.0 months.
Although considerable, the gold stocks’ rally still hasn’t grown large enough to return to the radars of contrarian investors. That could be about to change though as a rare triple breakout looks imminent! GDX, the leading gold-stock investment vehicle, is on the verge of simultaneous upside breakouts from its 3 major upper-resistance zones. That will likely unleash big gold-stock buying from technically-oriented traders.
These major resistance levels have all converged near $21. The first and most important is GDX’s key 200-day moving average, which was $20.78 this week. 200dmas are seen as the dividing line between bull and bear markets. When prices surge back above 200dmas after long periods underneath them, the upside momentum often explodes. Traders love chasing gains and 200dma breakouts portend big ones.
The past few years have several examples of gold stocks surging dramatically after 200dma breakouts. The main one was in early February 2016, when GDX rocketing back over its 200dma after deep lows confirmed a new bull market was underway. The great majority of its initial massive 151.2% upleg came after that 200dma upside breakout. Another upleg surged after a 200dma breakout in mid-August 2017.
The latest one came in late December 2017, although that was truncated early by gold stalling out. Realize that no technical line is more important to traders than 200dmas. When they see major gold stocks power decisively back over their 200dma as measured by GDX, they are likely to rush to buy in to ride the momentum. Like selling, buying begets buying. The more gold stocks rally, the more traders want them.
That imminent 200dma breakout will be all the more potent as a new-upleg signal because 2 other major resistance lines have converged there. That downward-sloping resistance line of the descending triangle has also extended right on $21. So once GDX powers decisively above it, this past year’s vexing trend of lower highs will end. Traders will see that as evidence the major gold-stock trend is reversing to higher.
The final resistance line of that triple breakout is the major $21 support of GDX’s consolidating basing range that held rock solid for over a year-and-a-half. When prices fall, old support zones often become new overhead resistance. Traders tend to want to sell again when those old support levels near. So when GDX decisively breaks back out above $21, technical fears of that former support level will vanish.
Once back over $21, GDX will return to its multi-year consolidation basing trend between $21 to $25. So the triple breakout above that old support line, downward-sloping resistance line, and 200dma would set the stage for a sharp surge back towards the top of that old trading range. While GDX $25 isn’t very high in absolute terms, it’s still another 22.2% above this week’s levels. Such a rally would spark some excitement.
Because historical gold-stock uplegs have been so enormous, generating life-changing wealth, there is always latent gold-stock interest lurking. Contrarian investors and speculators alike sour on gold stocks when they are weak, but quickly return when they show technical signs of life. A GDX triple breakout sure qualifies as that! And much-higher gold-stock prices are certainly justified fundamentally, long overdue.
Gold miners’ earnings and thus ultimately stock prices are largely a function of gold levels. Mining costs are essentially fixed during mine-planning stages. So higher gold prices flow directly through to bottom lines in amplified fashion. This is easy to understand with an example. A month ago I waded through the Q3’18 results of GDX’s major gold miners. Their average all-in sustaining costs weighed in at $877 per ounce.
That is what it costs them to produce and replenish gold, and $877 was right in line with their previous 4 quarters’ average of $867. Those collective costs will remain stable even as gold’s upleg accelerates. At gold’s own extreme-futures-short-selling-driven bottom of $1174 in mid-August, the major gold miners of GDX were still earning about $297 per ounce. Such solid levels prove that capitulation wasn’t righteous.
Last Friday gold hit a new upleg high of $1248, up 6.3% from its anomalous late-summer lows. Imagine this young upleg grows to 30% like the H1’16 one, which is quite small by historical standards. That would leave gold near $1525. At those $877 average GDX AISCs, the major gold miners’ profits would rocket to $648 per ounce. That’s 118% higher on a 30% gold upleg! Big gold-stock upside is fundamentally justified.
The ratio between the closing prices of GDX and the dominant GLD SPDR Gold Shares gold ETF is an easy approximation of the critical fundamental relationship between gold-stock prices and gold levels. This last chart is updated from a mid-October essay where I explained why gold stocks are the last cheap sector in all the stock markets. The GDX/GLD Ratio shows gold stocks have vast room to mean revert higher.
This GGR construct has averaged 0.186x during the 3.0 years of this current gold bull so far. This week the GGR clawed back to 0.174x, hitting its own 200dma. But at the gold stocks’ deep capitulation low in mid-September, the GGR plunged all the way down to 0.155x. That’s 0.031x below normal for this bull. After GGR extremes in either direction, this key ratio tends to mean revert the other way and overshoot proportionally.
That argues GDX is easily likely to surge far enough leveraging gold’s gains to regain a 0.217x GGR. That’s certainly not a high level even in the modest context of this gold bull. At this week’s $1245 gold levels which translated near $118 in GLD terms, GDX would have to surge to $25.56 to accomplish that normal mean-reversion overshoot. That’s another 25.0% higher, which would make for a solid upleg well worth riding.
And that GGR target is still incredibly low in longer secular context. In the 2 years before 2008’s first stock panic in a century, the GGR averaged 0.591x. Though gold stocks plummeted in the extreme fear that panic spawned, the GGR rebounded to average 0.422x in the 2 years after that epic anomaly. Over a longer 4-year post-panic span, it averaged 0.381x. So seeing it regain 0.217x is nothing, it should go far higher.
The bigger gold’s own upleg, the more the gold stocks will outperform by the usual 2x to 3x and force the GGR higher. At $1525 gold after a relatively-small 30% upleg, that 2009-to-2012 post-panic-average GGR of 0.381x would yield a GDX upside target around $55 per share. That’s 169% higher from this week’s levels, even without an overshoot! Gold-stock profits growth from higher gold prices justifies huge gains.
And rather conveniently on the verge of that GDX triple breakout, a major gold-buying catalyst is likely thisweek. On Wednesday December 19th, the Fed’s FOMC meets to decide on whether or not to hike rates for the 9th time in this cycle. That rate hike has been universally expected for months now, it is fully baked in. But the thing gold-futures and dollar-futures traders are really watching is the rate-hike forecast.
While the FOMC meets 8 times per year, at every other meeting it releases something called the dot plot. That summarizes where top Fed officials making the decisions think the federal-funds rate should be in coming years. The last dot plot was published on September 26th when the S&P 500 remained just 0.8% under its all-time record high from a week earlier. Fed officials are boldly hawkish when stocks are high.
But the stock markets soon fell apart in Q4’18, the first in history seeing full-speed quantitative-tightening monetary destruction by the Fed! Various Fed officials including the chairman have waxed more dovish since stocks started sliding. Fearing a negative wealth effect adversely impacting the US economy, their resolve to hike rates withers. So there’s a good chance this week’s dot plot will be more dovish than the last one.
Late September’s had effectively forecast 5 more Fed rate hikes including at next week’s meeting. So if this new dot plot shows less than 4 total rate hikes forecast in 2019 and 2020, dollar-futures speculators will likely sell motivating gold-futures speculators to buy aggressively. Fewer expected rate hikes are very bullish for gold, as proven in past dot plots. A great example was the 5th hike of this cycle in December 2017.
A year ago this week the FOMC hiked, but its dot-plot rate-hike forecast was dovish. Instead of upping it to 4 rate hikes in 2018 as traders expected, Fed officials left it at 3. So over the next 6 weeks, gold shot up 9.2% to $1358 on heavy gold-futures buying by speculators. A similar rally after next week’s meeting if the dot plot forecasts fewer rate hikes than the last one would drive gold right back up near $1360 again.
That’s on the verge of a major bull-market breakout which would likely unleash massive new investment buying. And any material gold rally will light a big fire under the gold stocks, rapidly driving them higher. That would put GDX’s triple breakout in the bag with haste. Nothing drives big capital inflows into the gold stocks faster than seeing them decisively rally. They are perfectly set up for major gains in coming months!
A big mean-reversion rebound higher is inevitable and likely imminent. While traders can play it in GDX, that’s mostly a bet on the largest gold miners with slowing production. The best gains by far will be won in smaller mid-tier and junior gold miners with superior fundamentals. A carefully-handpicked portfolio of elite gold and silver miners will generate much-greater wealth creation than ETFs dominated by underperformers.
The key to riding any gold-stock bull to multiplying your fortune is staying informed, both about broader markets and individual stocks. That’s long been our specialty at Zeal. My decades of experience both intensely studying the markets and actively trading them as a contrarian is priceless and impossible to replicate. I share my vast experience, knowledge, wisdom, and ongoing research through our popular newsletters.
Published weekly and monthly, they explain what’s going on in the markets, why, and how to trade them with specific stocks. They are a great way to stay abreast, easy to read and affordable. Walking the contrarian walk is very profitable. As of Q3, we’ve recommended and realized 1045 newsletter stock trades since 2001. Their average annualized realized gains including all losers is +17.7%! That’s double the long-term stock-market average. Subscribe today and take advantage of our 20%-off holidays sale!
The bottom line is the gold stocks are nearing a rare triple breakout. Three major GDX resistance zones have converged just above current levels. Once the gold stocks surge decisively over, the technically-oriented traders will take notice. They will likely start chasing the momentum accelerating the gains, with buying begetting buying. And gold stocks are so undervalued big gains are totally justified fundamentally.
This bullish outlook should be really bolstered by this week’s FOMC meeting. Worried about the recent stock-market selloff and surging volatility, top Fed officials are likely to dial back their rate-hike forecasts for next year. That will almost certainly hit the US dollar and goose gold. If gold surges again on a dovish dot plot like it has after other rate hikes in this cycle, the gold stocks will blast higher achieving that triple breakout.
In recent days we’ve seen the beginnings of an inversion in the yield curve.
The 2-year yield and the 5-year yield have inverted but not yet the the 2-year yield and the 10-year yield, the curve that is watched most. However, “2s and 10s” as bond traders would say appear headed for an inversion very soon.
We know that an inversion of the yield curve precedes a recession and bear market. That is good for Gold. But timing is important and the key word is precedes.
In order to analyze the consequences for Gold we should consult history.
First let’s take a look at the 1950-1980 period.
In the chart below we plot the Barron’s Gold Mining Index (BGMI), Gold, the Fed funds rate (FFR) and the difference between the 10-year yield and the FFR (as a proxy for the yield curve).
The six vertical lines highlight peaks in the FFR and troughs in the yield curve (YC), which begins to steepen when the market discounts the start of rate cuts. A steepening YC is and has been bullish for Gold except when it’s preceded by inflation or a big run in Gold.
Note that five of the six lines also mark a recession except in 1966-1967.
At present, the yield curve is on the cusp of inverting for only the third time since 1990.
The previous two inversions in 2000 and 2007 were soon followed by a steepening curve as the market sensed a shift in Fed policy.
The initial rate cut in 2000 marked an epic low in the gold stocks and the start of Gold strongly outperforming the stock market. In summer of 2007 the rate cuts began and precious metals embarked on another impulsive advance.
The historical inversions carry a different context but the takeaways are not so different.
Aside from the mid 1970s to the early 1980s, we find that a steepening of the curve (which accelerates from the start of Fed rate cuts) is bullish for precious metals. (This also includes a steepening in late 1984 that preceded the bull market in the mid 1980s).
With that said, the inversion itself is not bullish for precious metals because there can be a lag from then to the first rate cut and steepening of the curve.
I took a careful look at four of the previous inversions and counted the time from that point to the next significant low in gold stocks. The average and median time of those four is 10 months.
That appears to be inline with my thinking that the Federal Reserve’s final rate hike will be sometime in 2019.
Everyone has different reasons for investing or speculating in the resource sector. I believe, for the majority of the participants, it’s the allure of 10 baggers that attract them to the juniors.
While the appeal to windfall profits is attractive to almost anyone, I believe it’s exactly this mindset that keeps many investors from actually realizing the gains they are given in the market.
Too many times, I have spoken to fellow investors who haven’t taken money off the table when it’s there, and are left holding the bag until the market turns or the company successfully answers the next unanswered question.
First, if you are an investor who can stomach the ebb and flow of the market then taking a long-term position in juniors can work. Secondly, and key to the first point, it can only work if you are right about the junior company in which you are invested. Will they continue to get ‘yes’ answers as they pursue the development of their mineral deposit?
The juniors draw much of the attention in the resource market, however, I think that there are larger companies that have big upside potential, pay a dividend, and are actual investment-grade companies.
Let’s take a look at one of them!
Altius Minerals Corporation
I’m very bullish on both precious and base metals moving forward. However, the pragmatist in me is especially drawn to the base metals, as their value proposition in today’s society is so easily understood.
Today, I have for you an interview with Chad Wells, VP of Corporate Development of Altius Minerals Corporation (ALS:TSX). Altius is the sector’s only diversified base metal royalty and project generation company.
Currently, Altius has 15 producing royalties in copper, zinc, nickel, potash, iron, thermal and metallurgical coal. In addition, the project generation side of their business has drastically grown in overall equity value since 2016, moving from roughly $22 million to $68 million at September 30.
There are 54 new projects since Q1 2016 within Altius’ project generator portfolio and these will not only be the source of cash through equity sales in the future, but more importantly, will be the source of new cash flow by way of the royalties that are associated with most of the projects in their portfolio.
In my opinion, Altius is the best example of intellectual capital and how people are, by far, the most important commodity in any business.
As Wells mentions in our conversation,
“We’re a group that sticks to our guns, and believes in our own reasoning and rationale. At the end of the day, it’s about relying upon your own technical expertise and surrounding yourself with the right people that are willing to give you the right opinion that is unbiased, genuine and legit.”
I have long been an Altius shareholder and, in my opinion, would say that if I could only own one company in the sector, it would be Altius Minerals, hands down.
Altius Minerals (ALS:TSX)
MCAP – $556 M (at the time of writing)
Shares – 43.0 million
Annual Dividend – $0.16 / share
Outstanding Debt – $120 million
Cash and Public Equity Holdings – $180 million ($33.8 million cash)
2018 Royalty Revenue Guidance – $64M to $69M
Brian: In my conversation with Brian (referring to CEO Brian Dalton) last November, he was super bullish on iron ore and, over the course of the year, Altius has taken big steps to capitalize on the iron ore market. First in March, by increasing your position in Alderon Iron Ore and, most recently in Q3, increasing your position in Labrador Iron Ore Royalty Corporation.
Can you please explain the opportunity you see in the iron ore market?
Chad: We’ve been a mainstay player in the Labrador Trough since 2004 and 2005. Originally, it was from an exploration perspective where we generated projects and sold them on to third parties. Alderon Iron Ore was created during that time, as a part of that strategy, and lead to us becoming very intimate with the iron markets. The Labrador Trough iron ore fits a niche portion of the global marketplace.
Brian (referring to Altius CEO Brian Dalton) has an innate ability to see around corners so he’s been predicting a bifurcation happening in the broader iron ore market this past few years for high grade iron ore with low impurities, compared to the lower grade, higher impurity stock coming out of the Pilbara. A lot of it’s being driven by Chinese pollution standards and emissions targets through their steel mills. You’ve seen the Chinese cut significant volumes of steel production last year because mills were burning lower purity met coal and iron ore.
That’s led to a premium for the high grade, low impurity products. While the quoted price for iron ore, let’s say is at $70 per ton, the high grade Trough products are getting better than $100 per ton, while low grade is trading at a discount.
Brian recognized the separation that was coming in the market between high and low grade long before the broader market did. For us, it spawned an investment thesis to buy a substantial share position in Labrador Iron Ore Royalty Company (LIORC) mainly accumulated with the Fairfax preferred money starting in early 2017. LIORC has a 7% gross revenue royalty on Iron Ore Company of Canada’s (IOC) Carol Lake operations, as well as a 15% equity stake. LIORC is a passive type issuer, taking the money that they get from the royalty and then dividending most of it straight to shareholders.
For us it was the opportunity to have exposure to a royalty on a premier iron asset in Labrador, at a time when we thought the market was going to start to take recognition of that.
Over the last year, we increased our Labrador Iron Ore Royalty Corporation holdings substantially. If you look at our average price, which was around $17 a share before we bought the most recent addition of another .4%, LIORC stock traded last week as high as $31. At the same time, the yield of the dividends that we’ve realized off the asset are quite pronounced. And of course, we treat it as royalty income, effectively, in our per annum royalty revenue. So it fills out some of that diversified commodity exposure. So it’s been really good.
Alderon was much more strategic. We were a founder, having discovered the underlying Kami deposit way back in 2005-06. Our recent doubling up, if you will, on Alderon, goes back to this bifurcation in the iron ore market thesis, which we believe is a real thing and that’s going to last. It’s also worth mentioning that we bought the additional $5 million stake from Liberty when we agreed to a friendly transaction buying out the balance of the potash royalties that we’d held together in a JV.
With that comes the reality that you’re playing Carol Lake, through LIORC. Also, we have a convertible debenture with Champion Iron. Champion is the company that bought the Bloom Lake assets for $10 million in cash plus assumed liabilities of around $43 million from Cliffs, who had sunk nearly US$3 billion of capital into the project during the last iron bull.
The way we see things playing out in the Trough, we believe IOC brings a lot of transparency and reality to the broader marketplace, of the niche, that Labrador iron fits. We think that spills over into Champion, which is a very high margin operation right now, but is flying under the radar. We think the market will take credence and recognition there.
And as this market continues to want more high grade, low impurity iron ore, the next shovel ready project in that district is Kami. For us to buy that stake, on favourable terms, in Alderon from Liberty, brings us back to being that major shareholder with a big stick , it makes a lot of sense for us strategically.
If you reflect back to the last cycle, it was the asset that would have tore the lid off the can for Altius as a royalty generative business. The thing that most of the marketplace doesn’t realize today is that Altius is a different type of royalty company. It’s not a Franco or a Wheaton, who grows through acquisition. We actually grow our royalty portfolio organically and Alderon is one example of that.
In the past bull market in iron, around 2011, when we thought that Kami was going to get built, Alderon raised a bunch of money with the Chinese partner, Hebei Group. It almost got through the window in the sense of raising the capital to build a new mine. If that had to have happened, not only would we made a couple hundred million on the equity, but we would have had an underlying royalty on that asset at 3% gross royalty that based on the feasibility numbers of the assessment at the time, it would have generated about $25 million per year of royalty revenue for Altius for 20+ years. The reason it didn’t happen is because the iron ore bull market ended so quickly when prices dropped from around $130 per tonne to levels less than half that. If you add the premiums to the current spot, we’re edging closer to $100+ again.
Alderon is an extraordinary opportunity of optionality and because of what’s happened in the bigger iron ore market and because of the strategic significance of Labrador iron product in general, I think it happens this cycle.
Kami still needs a billion dollars in capital to get it done, but consider what’s going on with Rio Tinto and IOC and the rumors of them IPO-ing their IOC stake, and, again, the success of Champion in restarting Bloom, and it seems a reasonable bet that Alderon will raise the capital this time around. It might get built. If it does, it will differentiate Altius from all of the others because the net asset value just from the royalty aspect that gets created from nothing, is profound.
Brian: That leads into my next question, generally speaking, in your opinion, how difficult is it to raise $1 billion to develop a mine, today?
Chad: Very difficult and, in saying that, today’s market is probably not the one to do it in. Will that market come? Of course it will. One thing that’s going to be very apparent in what I’ll call the pending bull cycle in commodities, is that the story is going to be about supply this time around, not demand.
What we’ve seen happen is the world has not developed enough copper, nickel and high grade iron ore mines to sustain just the static needs of society. So ultimately, it’s going to be a supply crunch and there’s just not going to be enough supply out there.
So that will incentivize commodity pricing, and incentivize capital, and more mines will get built. So will it happen? It will. The iron ore business is a bit different, because there is a lot of iron ore that came on through the last cycle through investment. But most of it is in this low grade or medium grade stuff. So it doesn’t have the strategic niche of this high grade, low impurity ore, which quite frankly, the Chinese need.
So is the capital there today? Probably not. Will it come? It will. Also, I’d say you don’t necessarily have to think that these things are going to be built by the market. There’s a lot of diversified miners out there that have good balance sheets, have made a lot of money here in the last few years, again, and are going to be looking for shovel-ready assets to acquire to develop themselves. Maybe some of these things get built in different ways, not necessarily going to be through the capital market conventions of a bull market, if you will.
Brian: Earlier this year, Altius entered the lithium market with the investment in a closed end limited partnership with Lithium Royalties Corporation. The deal gives Altius the rights to buy up to 10% of selected royalty direct investments.
Generally speaking, what criteria is Altius looking for in terms of the ideal investment in the lithium space? For example, does the lithium deposit type or jurisdiction matter?
Chad: We’ve always been a group that has focused on exploration and investment in bread and butter commodities, which lithium would not fit. We’ve seen a lot of these specialty themes over the years and we haven’t invested in them because their supply and demand fundamentals have been so wonky that we just weren’t comfortable with the volatility.
In the case of lithium and the battery metal craze in general, I’d say we missed it with lithium. We didn’t necessarily believe that it was going to be one of these bread and butter commodities. I think we’ve come to realize that it is something that we should have spent more time investing in earlier through our exploration business, but we didn’t. Because regardless of how much we try to minimize the forecasts of different battery chemistries in the EV build-out scenario, you just can’t ignore lithium. And the big correction in the pricing this year gives us a more comfortable entry point to be buying when prices are not so near the top. So it is a bit of a catch up game.
What we did do this year is we partnered with expertise. The guys at Lithium Royalty Corp., especially Ernie Ortiz, the CEO of that ship, he’s a specialist in the lithium world. He’s been an authority in lithium for many years starting as one of the first sell side analysts to take apart the EV forecasts as the story was unfolding for the future demand of lithium.
So, again, what Altius decided, in this case, is to partner with some really smart people who had the groundwork laid and had the best-in-class assets sized up and deals templated. We are investing basically side by side with them through an equity position into that company and our royalty co-vestment rights are pro rata with our equity ownership. But we can pick and choose which ones we actually fund – we don’t have to participate in every one of them, and in fact, haven’t participated in every one so far.It is a different way for us to do it, as typically we’ve always been the front men running our own ship, whether it’s a particular jurisdiction or a particular commodity or a particular idea. In this case, we weren’t the first men running, so we partnered with the first man running.
Brian: Warren Buffett is famous for saying, “You must learn from mistakes, but they don’t have to be your own.” I was wondering if you could parlay that into the 20-year history of Altius.
Are there any lessons in particular that stand out to you?
Chad: Absolutely. It’s all lessons. I’ll focus on my side of the business, exploration and project generation. In the last bull cycle, we made $200 million plus through our project generation efforts. How did we do that?
We took geological real estate that we had generated with boot and hammer prospecting and came up with big context and big ideas. Then, we effectively sold it on to a third party. In the case of where we made the money selling on to a third party, it was a market participant. What we did is we exchanged geological real estate which is generally illiquid for shares in a fairly liquid company on a stock exchange, versus up until that point in time, let’s say the first 10 years of Altius, we spent a lot of our time doing exploration deals with major miners.
Though that gave us a lot of technical credibility in the product that we generated and we were able to attract those third party endorsements, it was an illiquid business. What I mean is that even though you did a deal, you weren’t able to monetize your minority residual stake in the assets.
So the big learning experiment that we had when we look back at the last bull cycle is related to the way that we made money, it was actually trading geological real estate for shares. So when we enter this bull cycle, I don’t know that I’d call it a bull cycle yet, the phone started to ring. All of a sudden, here we were as an exploration group, we had assembled projects in nine jurisdictions globally from 2012 to 2016, when nobody gave a crap about the mining resources business, and certainly weren’t doing exploration. We were able to waltz into world-class jurisdictions, build meaningful land positions, generated a lot of geological real estate, and basically we sat on it and waited for the market to turn.
Since that time, we’ve sold 54 (working on 57!) projects and 17 different agreements in less than 24 months. It’s been extraordinary. I didn’t think it could get so good for us. Every deal we’ve done, except for one that we haven’t announced yet, is that we took our geological real estate, we’d trade it for shares in a third party junior company, or in special circumstances, we even facilitated the IPO of new entities.
Where at the same time, though, where did we end up? We ended up with a big share position in a company that now held the assets that we generated, while at the same time we retained blanket royalties to the underlying projects. Long term sewed up in terms of the mining operations, we get kicked back on our royalties, while at the same time, we’re so early into the cycle we’re effectively getting seed stock in juniors that go to explore our projects.
So these positions expose us to discovery opportunity off of our balance sheet, on somebody else’s balance sheet, at the seed level. It’s beautiful! So if you look at our juniors portfolio today, we’re sitting on 27 juniors with a value of about $65 million at the end of September.
I can’t make a promise, but I’ll say to you I have extraordinary belief that that $65 million will be worth the market capitalization value of the entirety of Altius, roughly $600 million, through the cycle.
We’re seeded up on the right deals, at the right time, in the right commodities and right projects that those things are going to deliver value.
It’s a cyclical business, you need to be able to, to some degree, trade those cycles. We’ve been able to create fundamentally long-term royalties that punch through the cycles, that we can realize on over 10, 20, 30 year increments. At the same time, we’re getting seeded up on equity that we can monetize and put a big surplus of cash into the bank, so when the market rolls over again, we can put it to work.
So, really, it was about realizing it’s all about liquidity and timing.
Brian: That’s a great answer.
The ramifications of confirmation bias should be a major concern for all investors, as human nature dictates that we love to reaffirm our beliefs with confirming evidence. As a manager, the same concern can be said for “yes” men; people who continually support the boss regardless of whether they think they are right.
Personally, in my career as a manager in steel manufacturing, I quickly learned how important it was to surround myself with people who weren’t afraid to tell me what they thought about the projects that were being proposed or the direction that I wanted to take.
In your experience, how important is it to find or listen to disconfirming information?
Chad: The resources sector more than in any other, you shouldn’t run with the herd. You have to go against it. The reality is that this business in general – exploring, mine development, mine construction, mine production – is extremely tough and tedious.
Additionally, you’ve got to realize that there’s a lot of different tiers and categories of humans that benefit from a story advancing versus not advancing. So, a lot of times, you’re always encouraged to keep spending and spending and spending, because to some degree it’s the mentality to keep things going.
We don’t get into that type of philosophy. We’re a group that sticks to our guns, and believes in our own reasoning and rational. At the end of the day, it’s about relying upon your own technical expertise and surrounding yourself with the right people that are willing to give you the right opinion that is unbiased, genuine and legit.
The resource sector is like no other, it is feast or famine, it’s a herd mentality. To succeed you have to genuinely and truly be a contrarian. You have to be a no man versus a yes man.
Concluding Remarks
Altius Minerals is the cornerstone of my personal portfolio and will remain that way for the foreseeable future. In Altius, I see minimal downside risk outside of a broader market crash, which, in reality, would negatively affect just about every company’s share price.
Further, the upside potential from their project generation business looks very promising. First, looking at their development stage royalties projects: Excelsior Mining’s Gunnison copper project, Alderon Iron Ore’s Kami project or Evrim’s Cuale project, there is a lot of potential cash flow that could be soon flowing in Altius’ direction.
On the exploration side of their equity portfolio, you have Adventus Zinc Corporation (ADZN:TSXV), Aethon Minerals (AET:TSXV), Antler Gold (ANTL:TSXV), and Sokomon Iron (SIC:TSXV) to name just a few. Additionally, you have their latest spin out, Adia Resources, which is partnered with De Beers in the exploration for diamonds in Manitoba.
There are no guarantees in life, however, I believe that if you look at the short and long-term prospects of Altius, I think you will agree that they look tremendously bright.
Don’t want to miss a new investment idea, interview or financial product review? Become a Junior Stock Review VIP now – it’s FREE!
Until next time,
Brian Leni P.Eng
Founder – Junior Stock Review
Disclaimer: The following is not an investment recommendation, it is an investment idea. I am not a certified investment professional, nor do I know you and your individual investment needs. Please perform your own due diligence to decide whether this is a company and sector that is best suited for your personal investment criteria. I do own shares in Altius Minerals, Adventus Zinc Corporation, Aethon Minerals, and LIORC. All Altius Minerals analytics were taken from their website and press releases. I have NO business relationship with Altius Minerals or any of the other companies mentioned in this article.
December 4, 2018
The double bottom is the world’s most stressful chart pattern. It forms after a significant price decline. The first low in the pattern creates substantial panic and fear in most investors.
The second low in the pattern is “softer”, but no less dangerous to emotionally vulnerable investors. The volume is generally weak and the price action makes investors feel like they are in some kind of financial gulag.
Then the sun bursts out from behind those financial clouds, and glorious upside action begins! On that fabulous note, please click here now. Double-click to enlarge the spectacular price action on this daily gold chart.
The long term fundamentals and liquidity flows for gold should never be confused with the medium or short term. In the long term, the biggest driver of gold price appreciation is the Chindian “wealth effect”.
It’s all about Chinese and Indian citizens growing their standard of living and buying ever-more gold to celebrate the good times.
In the West, inflation is the most potent driver of the gold price and America is beginning an enormous inflation cycle that will likely continue for fifteen to twenty years.
As Chindians bring respect to gold as an asset class, Western gold bugs won’t need to hide in the closet when they buy it because everybody will be able to get it online from companies like Amazon.
It will be as mundane as buying a coffee at Starbucks is now, but much more profitable!
In a nutshell, the love trade of three billion Chindians combined with the inflation trade of at least 500 million Westerners will soon completely restore gold’s shimmer and place as the ultimate asset.
Please click here now. Double-click to enlarge. All investors should keep their eye on the price action taking place on this long term gold chart. Note the RSI oscillator. It’s poised to leap above 50 and that’s in sync with the arrival of Chinese New Year seasonality.
Some heavyweight money managers believe that an inflationary surprise is coming to America, and it could happen as early as this Friday’s jobs report.
On that very interesting note, please click here now. Double-click to enlarge. A surprising uptick in US wage inflation is imminent and it will be a tremendous tail wind for silver’s upside price action. I don’t know if that inflationary surprise happens in Friday’s jobs report or not, but I do want investors to be positioned to get richer if it occurs!
In the short term precious metals market, I might be shorting GDX via DUST (although the good news is that I currently hold NUGT), but that has nothing to do with the fabulous long term fundamentals in play for the entire precious metals market.
At my short term guswinger.com trading service the average NUGT/DUST or UDOW/SDOW trade lasts only a week or two. I increased my average trade size threefold yesterday… to enhance the adrenaline rush and the profits, with professionally managed risk. Investors should always separate trading accounts from long term core position investing accounts. They are as different as night and day.
Please click here now. Jay Powell had to “blink” with rate hikes and so did Donald Trump with tariff taxes or the U.S. stock market would have incinerated yesterday. So, when Trump “supersized” Powell’s blink with his tariffs blink, the US stock market rocketed higher and I promptly sold half my UDOW swing trade position as the market opened. From there, the rally faded. Pros sold the news.
In the big picture, I think most stock market bulls and bears are working a bit too hard to predict either “make my stock market great” higher prices or the end of the bull market.
It’s simply later in the U.S. business cycle now than it was a year ago, and it will be even later as 2019 gets underway. As the cycle matures, volatility typically grows and that makes analysts a bit desperate about trying to figure out what comes next.
Reality check: What comes next is vastly much wilder price action than has occurred at any point in this bull market! That’s just what happens as earnings fade and inflation rises in an environment of debt worship.
Please click here now. Whether it’s the U.S. government’s maniacal obsession with debt growth and citizen extortion via income and capital gains taxation, the emergence of wage inflation, the negative effect of quantitative tightening on corporate stock buyback programs, or the inverting yield curve, what matters is that it’s all happening in the late stage of the business cycle. Price volatility is poised to go “off the charts” in 2019 as these forces intensify dramatically and synergistically.
Stock market investors should not waste time trying to figure out what comes next. There’s only one course of obvious tactical action for long term U.S. stock market investors, and that is: Reduce trade size now!
With the daily gold chart looking spectacular, what can gold stock investors expect? Well, for 2018 I’ve predicted that the “tax loss selling” of the past few years will be confined mainly to the tiny CDNX-listed juniors. GDX, GDXJ, and SIL and their component stocks are in great shape and poised to join gold in a “shotgun” move higher for the medium term.
Please click here now. Double-click to enlarge this GDX daily chart. GDX is sporting dual inverse head and shoulders patterns.
From a technical perspective, GDX can be viewed as a sports car with twin technical turbos that is revving its engine now. GDX appears poised to rise to the minor highs around $20.50, and then race straight to my $23.50 target zone!
There could be some wild volatility around Friday’s jobs report and the December 19 Fed meeting, but the dual H&S patterns are a powerful technical force to be reckoned with. When both the short term technicals and the long term fabulous fundamentals are weighed carefully, most gold stock investors should be in great spirits and ready for the upside journey of a lifetime!
Special Offer For Website Readers: Please send me an Email to freereports4@gracelandupdates.com and I’ll send you my free “Back Up The Golden Truck!” report. I highlight six under the radar junior gold stocks that could stage five bagger gains or more in 2019. I include key buy and sell signals for each stock!
Stewart Thomson is a retired Merrill Lynch broker. Stewart writes the Graceland Updates daily between 4am-7am. They are sent out around 8am-9am. The newsletter is attractively priced and the format is a unique numbered point form. Giving clarity of each point and saving valuable reading time.
Risks, Disclaimers, Legal
Stewart Thomson is no longer an investment advisor. The information provided by Stewart and Graceland Updates is for general information purposes only. Before taking any action on any investment, it is imperative that you consult with multiple properly licensed, experienced and qualified investment advisors and get numerous opinions before taking any action. Your minimum risk on any investment in the world is: 100% loss of all your money. You may be taking or preparing to take leveraged positions in investments and not know it, exposing yourself to unlimited risks. This is highly concerning if you are an investor in any derivatives products. There is an approx $700 trillion OTC Derivatives Iceberg with a tiny portion written off officially. The bottom line:
Are You Prepared?
December 3, 2018
The junior gold miners’ stocks have spent recent months mostly languishing near major multi-year lows. That spawned a sentiment wasteland riddled by bearishness and bereft of bids. But these companies’ battered stock prices aren’t fundamentally righteous, as proven yet again by their latest earnings season. Faring far better in a challenging third quarter than stock prices imply, they need to mean revert way higher.
Four times a year publicly-traded companies release treasure troves of valuable information in the form of quarterly reports. Companies trading in the States are required to file 10-Qs with the U.S. Securities and Exchange Commission by 40 calendar days after quarter-ends. Canadian companies have similar requirements at 45 days. In other countries with half-year reporting, many companies still partially report quarterly.
The definitive list of elite “junior” gold stocks to analyze comes from the world’s most-popular junior-gold-stock investment vehicle. Mid-month the GDXJ VanEck Vectors Junior Gold Miners ETF reported $4.1b in net assets. Among all gold-stock ETFs, that was second only to GDX’s $9.0b. That is GDXJ’s big-brother ETF that includes larger major gold miners. GDXJ’s popularity testifies to the great allure of juniors.
Unfortunately this fame created serious problems for GDXJ a couple years ago, resulting in a stealthy major mission change. This ETF is quite literally the victim of its own success. GDXJ grew so large in the first half of 2016 as gold stocks soared in a massive upleg that it risked running afoul of Canadian securities laws. And most of the world’s smaller gold miners and explorers trade on Canadian stock exchanges.
Since Canada is the centre of the junior-gold universe, any ETF seeking to own this sector will have to be heavily invested there. But once any investor including an ETF buys up a 20%+ stake in any Canadian stock, it is legally deemed to be a takeover offer that must be extended to all shareholders! As capital flooded into GDXJ in 2016 to gain junior-gold exposure, its ownership in smaller components soared near 20%.
Obviously hundreds of thousands of investors buying shares in an ETF have no intention of taking over gold-mining companies, no matter how big their collective stakes. That’s a totally-different scenario than a single corporate investor buying 20%+. GDXJ’s managers should’ve lobbied Canadian regulators and lawmakers to exempt ETFs from that 20% takeover rule. But instead they chose an inferior, easier fix.
Since GDXJ’s issuer controls the junior-gold-stock index underlying its ETF, it simply chose to unilaterally redefine what junior gold miners are. It rejiggered its index to fill GDXJ’s ranks with larger mid-tier gold miners, while greatly demoting true smaller junior gold miners in terms of their ETF weightings. This controversial move defying long decades of convention was done quietly behind the scenes to avoid backlash.
There’s no formal definition of a junior gold miner, which gives cover to GDXJ’s managers pushing the limits. Major gold miners are generally those that produce over 1m ounces of gold annually. For decades juniors were considered to be sub-200k-ounce producers. So 300k ounces per year is a very-generous threshold. Anything between 300k to 1m ounces annually is in the mid-tier realm, where GDXJ now traffics.
That high 300k-ounce-per-year junior cutoff translates into 75k ounces per quarter. Following the end of the gold miners’ Q3’18 earnings season in mid-November, I dug into the top 34 GDXJ components’ results. That’s simply an arbitrary number that fits neatly into the tables below. Although GDXJ included a staggering 70 component stocks mid-month, the top 34 accounted for a commanding 82.9% of its total weighting.
Out of these top 34 GDXJ companies, only 3 primary gold miners met that sub-75k-ounce-per-quarter qualification to be a junior gold miner! Their quarterly production is rendered in blue below, and they collectively accounted for just 3.8% of this ETF’s total weighting. GDXJ is inarguably now a pure mid-tier gold-miner ETF, not a junior one. But its holdings include the world’s best gold miners with huge upside potential.
I’ve been doing these deep quarterly dives into GDXJ’s top components for years now. In Q3 2018, fully 31 of the top 34 GDXJ components were also GDX components! These are separate and distinct ETFs, a “Gold Miners ETF” and a “Junior Gold Miners ETF”. So they shouldn’t have to own many of the same companies. In the tables below I highlighted the symbols of rare GDXJ components not also in GDX in yellow.
These 31 GDX components accounted for 79.2% of GDXJ’s total weighting, not just its top 34. They also represented 31.7% of GDX’s total weighting. Thus nearly 4/5ths of this “Junior Gold Miners ETF” is made up by nearly 1/3rd of the major “Gold Miners ETF”! These GDXJ components also in GDX are clustered from the 11th- to 30th-highest weightings in that latter larger ETF. GDXJ is mostly smaller GDX stocks.
In a welcome change from GDXJ’s vast component turmoil of recent years, only 4 of its top 34 stocks are new since Q3 2017. Their symbols are highlighted in light blue below. Thus the top GDXJ components’ collective results are finally getting comparable again in year-over-year terms. Analyzing ETFs is much easier if their larger components aren’t constantly in flux. Hopefully changes going forward are relatively minor.
Despite all this, GDXJ remains the leading “junior-gold” benchmark. So every quarter I wade through tons of data from its top components’ latest results, and dump it into a big spreadsheet for analysis. The highlights make it into these tables. Most of these top 34 GDXJ gold miners trade in the US and Canada, where comprehensive quarterly reporting is required by regulators. But others trade in Australia and the UK.
In these countries and most of the rest of the world, regulators only mandate that companies report their results in half-year increments. Most do still issue quarterly production reports, but don’t release financial statements. There are wide variations in reporting styles, data presented, and release timing. So blank fields in these tables mean a company hadn’t reported that particular data for Q3 2018 as of mid-November.
The first couple columns of these tables show each GDXJ component’s symbol and weighting within this ETF as of mid-November. While just over half of these stocks trade on US exchanges, the other symbols are listings from companies’ primary foreign stock exchanges. That’s followed by each gold miner’s Q3’18 production in ounces, which is mostly in pure-gold terms excluding byproduct metals often found in gold ore.
Those are usually silver and base metals like copper, which are valuable. They are sold to offset some of the considerable costs of gold mining, lowering per-ounce costs and thus raising overall profitability. In cases where companies didn’t separate out gold and lumped all production into gold-equivalent ounces, those GEOs are included instead. Then production’s absolute year-over-year change from Q3’17 is shown.
Next comes gold miners’ most-important fundamental data for investors, cash costs and all-in sustaining costs per ounce mined. The latter directly drives profitability which ultimately determines stock prices. These key costs are also followed by YoY changes. Last but not least the annual changes are shown in operating cash flows generated, hard GAAP earnings, sales, and cash on hand with a couple exceptions.
Percentage changes aren’t relevant or meaningful if data shifted from positive to negative or vice versa, or if derived from two negative numbers. So in those cases I included raw underlying data rather than weird or misleading percentage changes. This whole dataset together offers a fantastic high-level read on how the mid-tier gold miners as an industry are faring fundamentally. They actually did relatively well in Q3.
While this new mid-tier GDXJ is generally excellent, some decisions by its managers are utterly baffling. Out of all the world’s gold miners they could’ve added over this past year, they inexplicably decided on the giant largely-African AngloGold Ashanti. It produced an enormous 851k ounces of gold last quarter, the largest in GDXJ by far. It and the rest of the South African majors definitely don’t belong in GDXJ!
Remember that major-gold-miner threshold has long been 1m+ ounces per year. AU’s production is annualizing to well over 3x that, making this company the world’s 3rd-largest gold miner last quarter. Why on earth would managers running a “Junior Gold Miners ETF” even consider AngloGold Ashanti? It is as far from junior-dom as gold miners get. The same is true with the rest of the troubled South African gold miners.
AU, Gold Fields, Harmony Gold, and Sibanye-Stillwater mined 851k, 533k, 379k, and 309k ounces in Q3’18, all are majors. Yet they accounted for 13.1% of GDXJ’s total weighting. They are riddled with all kinds of problems too, from shrinking production to high costs to increasing stealth expropriations from South Africa’s openly-Marxist anti-white-investor government. Their inclusion heavily skews and taints GDXJ.
These South African majors’ Q3 production of 2.1m ounces was a whopping 41% of the GDXJ top 34’s total! And it still fell 7.0% YoY due to South Africa’s tragic death spiral. Excluding them and the amazing Kirkland Lake Gold which has grown so fast it was moved exclusively into GDX over this past year, the rest of the GDXJ top 34 grew production 3.4% YoY in Q3. The South African majors’ cost impact is even worse.
Mining in that country is very expensive thanks to very-old very-deep mines and endless new government interference via stifling regulations. In Q3 the South African majors’ cash and all-in sustaining costs came in really high averaging $925 and $1088 per ounce. The rest of GDXJ’s top 34 averaged $629 and $877, a massive 32.0% and 19.4% lower! The South African majors are really retarding GDXJ’s performance.
As struggling majors far larger than mid-tiers and juniors, they need to get kicked out of GDXJ posthaste. They can be left in GDX where they belong. AU effectively took KL’s place, which makes no sense at all fundamentally. Kirkland Lake produced 180k ounces of gold in Q3 at $351 cash costs and $645 AISCs. So unlike AU, KL remains solidly in the mid-tier realm and has been performing incredibly well operationally.
While GDXJ’s managers really dropped the ball including those South African majors, they deserve big praise for upping the weighting of the outstanding Australian miners. They are Northern Star Resources, Evolution Mining, Regis Resources, St Barbara, and Saracen Mineral. Their collective weighting in GDXJ grew to 21.7% at the end of Q3’s earnings season, nearly 2/3rds higher from their 13.3% a year earlier.
Unlike AU’s dumbfounding inclusion, the Australians’ rise is well-deserved. Their production surged 8.9% YoY to 686k ounces, or 23% of the GDXJ top 34’s total excluding those South African majors. And the Australian miners are masters at developing great gold deposits and controlling costs, as their cash costs and AISCs in Q3 averaged just $586 and $724! It’s fantastic GDXJ offers American investors this Aussie exposure.
GDXJ’s component list and weightings are a work in progress, and are gradually getting better. For years I’ve pointed out things like the South African majors that weren’t right, and GDXJ’s managers eventually seem to come around and change things for the better. Greatly helping that process is investors buying the better individual stocks like KL and shunning laggards like AU, readjusting their relative market capitalizations.
GDXJ and GDX are essentially market-cap weighted, with larger companies rightfully commanding larger weightings. These leading gold-stock ETFs’ managers can override this by deciding which gold miners to include in each ETF. So they can easily purge GDXJ of the deteriorating South African majors and add real mid-tier gold miners. But the true core problem is having so many of the same stocks in GDX and GDXJ.
Such massive overlap between these two ETFs is a huge lost opportunity for VanEck. It owns and manages GDX, GDXJ, and even the MVIS indexing company that decides exactly which gold stocks are included in each. With one company in total control, there’s no need for any overlap in the underlying companies of what should be two very-different gold-stock ETFs. Inclusion ought to be mutually-exclusive.
VanEck could greatly increase the utility of its gold-stock ETFs and thus their ultimate success by starting with one big combined list of the world’s better gold miners. Then it could take the top 20 or 25 in terms of annual gold production and assign them to GDX. Based on Q3’18 production, that would run down near 139k or 93k ounces per quarter. Then the next-largest 40 or 50 gold miners could be assigned to GDXJ.
Getting smaller gold miners back into GDXJ would be a huge boon for the junior-gold-mining industry. Most investors naturally assume this “Junior Gold Miners ETF” owns junior gold miners, which is where they are trying to allocate their capital. But since most of GDXJ’s funds are instead diverted into much-larger mid-tiers and even some majors, the juniors are effectively being starved of capital intended for them.
That’s one of the big reasons smaller gold miners’ stock prices are so darned low. They aren’t getting enough capital inflows from gold-stock-ETF investing. So their share prices aren’t bid higher. They rely on issuing shares to finance their exploration projects and mine builds. But when their stock prices are down in the dumps, that is heavily dilutive. So GDXJ is strangling the very industry its investors want to own!
Back to these mid-tier gold miners’ Q3’18 results, production is the best place to start since that is the lifeblood of the entire gold-mining industry. These top 34 GDXJ gold miners that had specifically reported Q3 production as of mid-November produced 5063k ounces. That surged by a massive 18.8% YoY, implying these miners are thriving. But that is heavily distorted by that huge 851k-ounce boost from AU’s addition.
Without the world’s 3rd-largest gold miner, the rest of the GDXJ top 34 saw their production slip 1.2% YoY to 4212k ounces. That reflected the peak-gold challenges the gold-mining industry is facing, as I discussed a couple weeks ago while reviewing the GDX majors’ Q3’18 results. The GDXJ top 34 are still outperforming the GDX top 34, which saw their gold production retreat 2.9% YoY in Q3 bucking historical trends.
Sequentially quarter-on-quarter from Q2’18 the GDXJ top 34’s production surged a dramatic 13.3%! And AU was already one of GDXJ’s top components then. That partially came from new mines ramping up at the world’s best mid-tier gold miners. It is far easier for them to grow production off lower bases than it is for the majors off high bases. That’s a key reason why the mid-tiers’ upside potential trounces that of the majors.
For all GDXJ’s faults, it does still offer investors exposure to much-smaller gold miners. The average quarterly production of all the top 34 GDXJ miners reporting it in Q3 was 163.3k ounces. That is 43% smaller than the 288.8k averaged by the top 34 GDX miners last quarter. And again AU’s crazy inclusion really skews this. Ex-AU, the GDXJ average falls to 140.4k. Without all the South African majors, it is 110.8k.
These annualize to 562k and 443k, both solidly in the mid-tier realm. Analyzing GDXJ’s production and costs requires breaking out those heavily-distorting South African majors that have no place in a mid-tier gold-miner ETF. Again their production fell 7.0% YoY in Q3, while the rest of the GDXJ top 34’s ex-KL grew 3.4%! Production and costs tend to be proportionally inversely related because of how mining works.
Gold-mining costs are largely fixed quarter after quarter, with actual mining requiring the same levels of infrastructure, equipment, and employees. The tonnage throughputs of the mills that process the gold-bearing ore are also fixed. So gold produced varies with ore grades each quarter. The more gold that is recovered, the more ounces to spread gold mining’s big fixed costs across. That lowers per-ounce costs.
There are two major ways to measure gold-mining costs, classic cash costs per ounce and the superior all-in sustaining costs per ounce. Both are useful metrics. Cash costs are the acid test of gold-miner survivability in lower-gold-price environments, revealing the worst-case gold levels necessary to keep the mines running. All-in sustaining costs show where gold needs to trade to maintain current mining tempos indefinitely.
Cash costs naturally encompass all cash expenses necessary to produce each ounce of gold, including all direct production costs, mine-level administration, smelting, refining, transport, regulatory, royalty, and tax expenses. In Q3’18, the overall cash costs of the GDXJ top 34 surged 8.4% higher YoY to $663 per ounce. That was still largely in line with the past four quarters’ $612, $618, $692, and $631 averaging $638.
But that sharp jump was mostly the result of the South African majors’ deepening troubles. Again their average cash costs last quarter were a whopping $925! Without them, the rest of the GDXJ top 34 averaged $629 per ounce which was only up 2.8% YoY and below the rolling-four-quarter mean. So the mid-tier gold miners of GDXJ are holding the line on cash costs, a sign their operations are fundamentally sound.
Way more important than cash costs are the far-superior all-in sustaining costs. They were introduced by the World Gold Council in June 2013 to give investors a much-better understanding of what it really costs to maintain gold mines as ongoing concerns. AISCs include all direct cash costs, but then add on everything else that is necessary to maintain and replenish operations at current gold-production levels.
These additional expenses include exploration for new gold to mine to replace depleting deposits, mine-development and construction expenses, remediation, and mine reclamation. They also include the corporate-level administration expenses necessary to oversee gold mines. All-in sustaining costs are the most-important gold-mining cost metric by far for investors, revealing gold miners’ true operating profitability.
The GDXJ top 34 reported average AISCs of $911 in Q3, up 3.8% YoY. But like cash costs, this was roughly in line with the $877, $855, $923, and $886 seen in the past four quarters. But again that was skewed quite a bit higher by those wrongly-included South African majors, which reported $1088 average AISCs in Q3. The rest of the top 34 averaged $877, which is actually better than the $885 four-quarter average.
So the South African majors are really tainting GDXJ’s collective operational performance, with lower production and higher costs dragging down this entire ETF. Those giant struggling gold producers are an albatross around the neck of the many great mid-tier gold miners in GDXJ! If you are a GDXJ investor, contact VanEck and urge them to boot the South African majors out of GDXJ to help it thrive going forward.
Gold-mining earnings are simply the difference between prevailing gold prices and all-in sustaining costs. And both sides of this equation moved the wrong way in Q3, squeezing the mid-tier gold miners’ profits. Q3’18’s average gold price of $1211 was 5.3% lower than Q3’17’s. And with overall GDXJ top 34 AISCs 3.8% higher at $911, that really cut into margins. These gold miners were collectively earning $300 per ounce.
That implied solid 25% profit margins absolutely, which aren’t bad. But they still plunged 25.4% YoY from Q3’17’s $402 per ounce, which amplified gold’s decline by 4.8x. But gold-mining profits leverage to gold is exactly why the gold stocks make such compelling investments. Gold stocks were weak in Q3 because gold was pounded to a deep 19.3-month low in mid-August on extreme all-time-record gold-futures short selling.
Left for dead and neglected, the gold miners’ stocks are the last cheap sector in these lofty bubble-valued stock markets. Their fundamental upside as gold mean reverts higher on speculators’ gold-futures buying and new investment demand as stock markets roll over is enormous. This is easy to understand with a simple example. In the last four quarters including Q3’18, the top 34 GDXJ gold miners’ AISCs averaged $894.
During gold’s last major upleg in essentially the first half of 2016, it powered about 30% higher driven by surging investment demand after stock markets suffered back-to-back corrections. That was even small by historical gold-bull-upleg standards. If we merely get another 30% gold advance from its recent mid-August low of $1174, we’re looking at $1525 gold. That would work wonders for gold-mining profits and stock prices.
At $1525 gold and $894 AISCs, the mid-tier gold miners would be earning $631 per ounce. That’s 110% higher than Q3’18’s $300! If gold-mining profits double, gold-stock prices will soar. Indeed during that last 30% gold bull in the first half of 2016, GDXJ rocketed 203% higher! So the gold-stock outlook is wildly bullish with gold itself due to power higher as the stock markets roll over on the Fed’s record tightening.
The rest of the top 34 GDXJ gold miners’ fundamentals were mixed last quarter. Cash flows generated from operations totaled $1.3b in Q3, down 21.2% YoY. That’s reasonable given average gold’s 5.3% YoY retreat and their leverage to it. Cash on hand remained high at $5.4b, down just 5.3% YoY. So these mid-tier gold miners have plenty of capital to build and buy new mines to continue growing their production.
Revenues only slipped 0.4% YoY to $4.1b, which means the softer gold prices were largely offset by higher production. But GAAP profits looked like a disaster, with the GDXJ top 34’s plummeting to a $379m loss in Q3’18 from being $212m in the black in Q3’17! That was far worse than the lower gold prices warranted, but thankfully it was mostly the result of big non-cash charges flushed through income statements.
Tahoe Resources reported a massive $170m impairment charge on its suspended Escobal silver mine that is being held hostage by the corrupt Guatemalan government. Yamana Gold wrote off $89m after selling a mine in Argentina. Explorer NOVAGOLD reported an $81m loss from discontinued operations on the sale of one of its projects. These three unusual items alone wiped out $340m of profits from GDXJ’s ranks.
Without them, the top 34 GDXJ gold miners’ earnings would’ve fallen to -$39m from +$212m. That isn’t great, but it doesn’t reveal any serious issues a rising gold price won’t quickly solve. Interestingly if KL was still included instead of AU, that would’ve added another $56m in Q3’18 profits. The mid-tiers’ overall earnings should dramatically leverage and outpace gold in coming quarters as it inexorably mean reverts higher.
While GDXJ should certainly no longer be advertised as a “Junior Gold Miners ETF”, it offers exposure to some of the best mid-tier gold miners on the planet. It’s really growing on me, I like this new GDXJ way better than GDX. That being said, GDXJ is still burdened by overdiversification and way too many gold miners that shouldn’t be in there. They are either too large, are saddled with inferior fundamentals, or both.
So the best way to play the gold miners’ coming massive mean-reversion bull is in individual stocks with superior fundamentals. Their gains will ultimately trounce the major ETFs like GDXJ and GDX. There’s no doubt carefully-handpicked portfolios of elite gold and silver miners will generate much-greater wealth creation. GDXJ’s component list is a great starting point, but pruning it way down offers far-bigger upside.
The key to riding any gold-stock bull to multiplying your fortune is staying informed, both about broader markets and individual stocks. That’s long been our specialty at Zeal. My decades of experience both intensely studying the markets and actively trading them as a contrarian is priceless and impossible to replicate. I share my vast experience, knowledge, wisdom, and ongoing research through our popular newsletters.
Published weekly and monthly, they explain what’s going on in the markets, why, and how to trade them with specific stocks. They are a great way to stay abreast, easy to read and affordable. Walking the contrarian walk is very profitable. As of Q3, we’ve recommended and realized 1045 newsletter stock trades since 2001. Their average annualized realized gains including all losers is +17.7%! That’s double the long-term stock-market average. Subscribe today and take advantage of our 20%-off holidays sale!
The bottom line is the mid-tier gold miners reported solid fundamentals despite a challenging third quarter for gold prices. Excluding the South African majors, they were able to grow their production nicely while holding the line on costs. That portends dramatic operating-cash-flow and earnings growth in the coming quarters as gold mean reverts higher on big investment buying. The mid-tier gold miners’ stocks will soar on that.
Gold stocks are not only unloved and dirt-cheap today, but they are a rare sector that rallies strongly with gold as general stock markets weaken. While virtually no one was interested in these leveraged plays on gold upside in recent months, that will change fast as these lofty stock markets roll over. And the mid-tier gold miners’ recent Q3 earnings season proved they remain ready to fundamentally amplify gold’s gains.
Ask some gold bugs why Gold has not broken out yet and you will probably get the usual answers. Some will say it’s due to manipulation or price suppression. Others will mention the current rally in the US Dollar (while neglecting that the previous decline in the greenback was unable to take Gold to a new high). Few would say the fundamentals are not in place. No one can know for certain but Gold’s fundamentals have not improved over the past year and are not where they need to be to support a breakout.
The vast majority of history shows us that Gold is inversely correlated to real interest rates (or real yields). It makes perfect sense because Gold has been money for thousands of years. When real rates decline, the real return on money in the bank or in a treasury bill or note decreases. Gold benefits. The corollary is also true. Rising real interest rates indicate stronger real return on money invested in the aforementioned instruments. That’s negative for Gold.
Real interest rates have actually strengthened for nearly 18 months, as the chart below shows. Gold has performed well during that period because of weakness in the US Dollar as well as some anticipation of an escalation in long-term yields.
Given the rise in real interest rates, it is not a surprise that investment demand for Gold has been weak. Gold bugs frequently trumpet strong demand from China and how tight the physical Gold market is but in reality, investment demand is what drives bull markets. Investment demand tends to respond to or follow negative and/or declining real interest rates.
One way of measuring investment demand in real time is by following the amount of Gold held in the GLD trust. As we can see below, investment demand (by this metric) confirmed the rebound in Gold in the first half of 2016. However, it has essentially been flat over the past 18 months as Gold rebounded from the low $1100s all the way to $1360.
Gold & Tons in GLD Trust
So if Gold’s fundamentals are not bullish and investment demand is flat, what conditions need to change that would benefit Gold?
Obviously, Gold needs declining real interest rates. It needs some combination of an acceleration in inflation and a pause or slowdown in short-term yields including the Fed Funds rate. Inflation has risen in recent quarters but short-term yields have risen faster as evidenced by the increase in real interest rates (shown in our first chart).
Weeks ago Gold was sniffing a breakout as long-term bond yields, such as the 10-year and 30-year yield were also threatening a breakout. An upside break in long-term yields would be significant for Gold as it would signal an increase in inflation expectations and pressure the balance sheets of both an over-indebted corporate sector as well as a government already running the largest non-recessionary, peacetime budget deficit in history. However, bond yields have yet to breakout even as the masses have positioned for such. In other words, Bonds could be ripe for a counter-trend rally which means yields would be ripe for a counter-trend decline.
An upside breakout in bond yields could also potentially lead to a new uptrend in the Gold to Stocks ratio. It could cause issues in the economy and stock market which would in turn, benefit Gold. While Gold is in a new uptrend relative to Bonds (not shown) and is currently firming against foreign currencies, it has not been able to sustain strength relative to the equity market. From an intermarket perspective this is the link that has been missing to put Gold in a real bull market.
Gold, Gold/Foreign Currencies, Gold/Equities
It would not be a surprise to see Gold correct lower as fundamentals are not currently bullish and the US Dollar (the weakness of which supported Gold throughout 2017) is rebounding with potentially more upside. Although inflation is increasing, it has not increased fast enough to counteract the rise in short-term yields. A future breakout in long-term yields could be the missing catalyst for Gold as it would cause issues in the economy and stock market and lead to softer Fed policy. Until then, traders and investors would be wise to focus on the junior miners that can add value to their projects in the meantime. To follow our guidance and learn our favorite juniors for the next six months, consider learning more about our premium service.
It was an interesting week in the precious metals complex. There appeared to be the start of a short squeeze in Silver (hedge funds were heavily short) but it ceased at an important resistance. Meanwhile, Gold closed the week on a weak note, losing $1340-$1350. The gold stocks, like silver closed the week below technical resistance. The price action in the complex continues to suggest that a breakout in Gold is the key to unleashing strong outperformance from Silver and the gold stocks.
While Silver has very supportive sentiment, it has not broken out from its downtrend yet. The net speculative position was at 1.1% a few weeks ago, an all time low. That won’t spring Silver by itself unless Silver can surpass critical resistance in the mid $18s. And that may not happen until Gold breaks $1360-$1370. Silver has strong support in the low to mid $16s.
Silver & Silver Net Speculative Position
Moving to Gold, the daily chart below shows Gold losing $1340-$1350 after rejection again at $1360. Immediate support for Gold lies at $1325 which if broken would lead to a test of $1300-$1310 and the 200-day moving average.
Gold Daily Candles
We have a few observations to share with respect to the gold stocks. First, GDXJ has pulled back from trendline resistance around $34. Second, breadth indicators for GDX such as the advance decline line (A/D) and the bullish percentage index (BPI) are showing a positive divergence. The BPI has reached a 52-week high while the A/D line is not far from its January peak when GDX nearly hit $25. So while GDX has been relatively weak, its internals are showing more strength.
Silver and the gold stocks have yet to break important resistance as Gold once again was turned back at major resistance. If the US Dollar, which closed at 90.07, rallies up to its 200-day moving average at 92, Gold would likely test $1300-$1310. Should Silver and the gold stocks hold up well in that scenario (which could be suggested by current breadth) then it would imply a good rebound from the sector back to resistance points. Lower prices in the juniors would be a welcome sign and another opportunity to accumulate ahead of a major breakout in the not too distant future. In anticipation of that breakout, we have been accumulating the juniors with 300% to 500% upside potential over the next 18-24 months. To follow our guidance and learn our favorite juniors, consider learning more about our premium service.
Readers know that I have beaten this drum all too often. Gold’s major fundamental driver is declining or negative real rates. There is a strong inverse correlation because Gold is money. That’s what JP Morgan said and he’s far more qualified to understand than quotable celebrities like Mark Cuban. But I digress.
When real rates are increasing or strongly positive (during most of the 1980s and 1990s and 2011 through 2015) Gold performs poorly because one can earn a real return on their money unlike with Gold. However, when real rates decrease and particularly when they are negative, Gold flourishes. That being said, right now there is an interesting development. Real rates have increased over the past year but Gold has held steady. Reviewing recent history can help us answer which is right.
First we look at a market-based indicator for real rates (yields). The US Treasury publishes this data daily as calculated from the TIPS market. Below we plot Gold along with the real 5-year TIPS yield, which recently touched an 8-year high. Interestingly, Gold has held up well. Note that there were two previous, similar divergences. Gold peaked in 2011 even though the real 5-year yield did not bottom until 2012. From 2005 to 2006 Gold made a significant break to the upside yet the real 5-year yield also increased during that time. Both times Gold was right.
Market-based indicators are great but in the context of real rates, the basic calculation has proven to be a better indicator for Gold. In this chart we plot Gold along with the real fed funds rate (inflation less the fed funds rate) and the real 5-year yield (inflation yess the 5-year yield). Note that both statistics peaked in 2011 at exactly the same time as Gold. Both have increased since the start of 2017 (along with Gold) but are nowhere close to the 8-year high that the real 5-year TIPS yield is. The TIPS market is exaggerating the strength of real yields.
Ultimately it remains to be seen which is right (Gold or real rates) but the past tells us to side with the market (Gold) rather than a fundamental indicator. The market is a discounting mechanism.
Gold holding steady despite an increase in real rates could be a bullish signal just as Gold declining amid falling real rates would be concerning. Perhaps Gold is discounting the likelihood that real rates have peaked and the risk of a sharp decline in real rates in 2020. In any case, those who focus too much on real rates and not the message of the market could risk missing out on a huge break to the upside. In anticipation of that move we continue to accumulate the juniors that have 300% to 500% upside potential over the next 18-24 months. To follow our guidance and learn our favorite juniors for the next 12-18 months, consider learning more about our premium service.
The precious metals sector continues to correct and consolidate. Gold remains in a bullish consolidation. It recently reached resistance again and even though it has failed to breakout, it remains above long-term moving averages which are sloping upward. However, the gold stocks and Silver remain in correction mode. They are trading below the long-term moving averages and at the lower end of their ranges over the past 12 months. That certainly provides an opportunity but these markets may not truly perform until Gold is ready to breakout.
Bullish Silver commentaries (because of its CoT) have been making the rounds and I don’t disagree. In the chart below we plot the net speculative position as a percentage of open interest. It is at 7.4%, which is the lowest reading in nearly three years. Interestingly, the daily sentiment index for Silver is not at an extreme. Its at 40% bulls. Technically, Silver is wedged in between support and resistance. A break does not appear imminent.
Like Silver, the gold stocks are oversold but we do not see an indication of an extreme oversold condition. In the chart below we plot GDX along with the difference between new highs and new lows. We also plot GDXJ along with the percentage of stocks (from a group of 50 we follow) that are trading above the 50-dma and 200-dma. GDX recently held above $21 again (even with over 20% of the index making new 52-week lows) while GDXJ is starting to show a bit more strength relative to GDX. At the low last Wednesday, 19% of those 50 juniors were trading above the 50-dma while 27% were trading above the 200-dma.
Gold, unlike Silver and the gold stocks, has not corrected much and remains much closer to resistance than support. Also, sentiment in Gold is much more optimistic than in Silver. The net speculative position in Gold is 37%, which dwarfs the 7.4% reading in Silver. Gold’s daily sentiment index is 56% bulls which is comfortably above Silver’s. During bull markets, corrections in Gold tend to push the net speculative position below 30%. Gold continues to maintain support at $1300 but we wonder if it needs to break that level and flush out some speculators before breaking out of its larger consolidation.
The precious metals sector is at an interesting juncture and it remains to be seen how the current disparity will resolve. One scenario is Gold breaks $1300 and this causes a mini-washout in the gold stocks and Silver. The other scenario is Gold continues to consolidate above $1300 and the gold stocks and Silver firm in anticipation of a major breakout in Gold. This is something that could take weeks to answer. In any event, we continue to remain patient and continue to accumulate the juniors we think have 5-fold potential over the next 18 months. To follow our guidance and learn our favorite juniors for the next 12-18 months, consider learning more about our service.
Gold was well bid during the equity correction but it could not breakout then and has retreated as equities have roared back. As a result, the Gold to stocks ratio has retraced most of its recent surge. Meanwhile, the US Dollar has rebounded and the oversold and overhated bond market could be starting a rally. The recent rise in long-term bond yields which has benefitted Gold appears due for a pause or correction. Meanwhile, Gold could also correct and consolidate as it waits for a breakout in long-term bond yields which should in turn benefit Gold.
As we noted in One Big, Potential Catalyst for Gold in 2018, Gold is no longer trading with bonds and therefore could benefit from a big breakdown in bonds. As the chart below shows, the bond market has experienced a major breakdown. In recent days, the 5-year, 10-year and 30-year bonds all touched multi-year lows.
The breakdown in the bond market has helped Gold rally but why hasn’t Gold reached the corresponding multi-year highs?
First, we should remember that the correlation between Gold and bonds was positive until November 2017. The market has begun to sense inflation only recently.
Second, while bond prices have broken down to multi-year lows, bond yields (and specifically long-term yields) have yet to breakout to multi-year highs.
The chart below shows long-term yields are testing multi-year resistance. For the 10-year yield, a strong push above 3.00% would mark more than a 6-year and almost 7-year high. A break above 3.25% in the 30-year yield would mark a 4-year high.
We have argued that Gold was unlikely to breakout immediately due to its lack of relative strength as well as the lack of strength from Silver and the gold shares.
If that remains the case then we would also expect bond yields to correct and digest their recent advance rather than breakout. We should also note that the daily sentiment index for bonds hit an 18-day average of 15% bulls. That is a bearish extreme and suggests the probability that bonds will rebound and yields will decline.
Gold could be waiting for a major breakout in bond yields, which would be a reflection of increasing inflation and inflation expectations. It would also result in more pressure on the economy and therefore the stock market. That would benefit Gold in both nominal and real terms. We expect a counter-trend move in Gold and bond yields before a breakout. This will allow us a bit more time to position in the juniors that should deliver fantastic returns. To follow our guidance and learn our favorite juniors for the next 12-18 months, consider learning more about our service.
For the past fifteen months or so, gold has repeatedly been turned back by immense technical resistance in the $1370 area.
Please click here now. Double-click to enlarge this daily gold chart.
There have been three clear attempts to push through the $1370 area since November of 2016. The first two failed miserably, but the current move looks much more positive.
During the latest pullback from $1370, the bears have only managed to push the price modestly lower, to my key buy zone at $1310.
The gold price promptly leaped higher as soon as it touched that area. This is very positive technical action. If the bulls fail a third time (unlikely), investors should be aggressive buyers at my $1270 and $1240 buy zones.
Please click here now. Double-click to enlarge this gold chart for a closer look at the current price action.
Gold is attacking the $1370 area from a symmetrical triangle pattern. Using the classic technical analysis promoted by Edwards & Magee, there is roughly a 67% chance of an upside breakout.
That breakout would push the world’s mightiest metal through $1370… and open the door for a rush higher towards $1420, $1470, and $1520!
Please click here now. Double-click to enlarge this exciting dollar versus yen chart.
The dollar’s breakdown under the key 108 support area adds tremendous weight to the argument that gold is poised to surge above $1370.
Most Trump supporters are focused on his campaign pledges regarding immigration, tariffs, defence, deregulation, and tax cuts. Their focus is on growth rather than inflation. That’s a mistake.
Reduced immigration tightens the labour market, pushing inflation higher. Borrowing money to buy more bombs to expand an already-gargantuan military-industrial complex puts immense pressure on the bond market. Deregulation and tax cuts are also inflationary.
While these pledges are indeed positive for gold, my main focus has always been on his more “thunderous” pledges regarding dollar devaluation and a haircut for T-bond investors.
The dollar breaking 108 is a gamechanger, and the T-bond chart now looks like a train wreck. As bad as it looks now, this may be only the beginning of a bond market nightmare. The bottom line is that Jerome Powell could essentially drop financial nuclear bombs on that train wreck with relentless rate hikes, quantitative tightening, and small bank deregulation.
To view the current T-bond train wreck chart, please click here now. Double-click to enlarge.
The T-bond has arrived in the 142 target zone area of the H&S top pattern and a modest rally is expected. Having said that, fundamentals make charts.
The negative fundamentals that Jerome Powell is set to put on the US government’s bond market table are going to put truly epic pressure on the government’s ability to finance itself.
Trump is a brilliant businessman, but even a child operating a hot dog stand should clearly see that the US government’s debt problem has no solution other than some kind of bond market default, dollar devaluation, and gold revaluation.
Trump is not concerned about the US debt problem, and nor should he be concerned if he’s a realist that knows there is no fix to the problem, only an end to it. An endgame that is incredibly positive for gold.
Please click here now. Double-click to enlarge this GDX daily chart.
Legendary mining expert David Harquail is launching a major drive to make gold an asset owned by most Western money managers. He’s bringing in heavyweight speakers like Alan Greenspan and other key central bank experts to bolster his presentations to institutional money managers.
I’ve predicted that this would happen by the summer of 2018 as the Fed successfully transitions America from a deflationary vortex into a modest growth with significant inflation economy.
King World News has covered the dramatic increase in free cash flow of most GDX component stocks. “Super Dave” Harquail is likely to get a US M2 money velocity bull market wind at his back (thanks to the efforts of Jerome Powell’s rate hikes and QT) as he makes his institutional presentations that highlight both bullion and the miners.
If that happens, the Western gold community is very quickly going to be happily looking down at prices like GDX $32, $40, $55, $65, and even $100! Of course, that happiness can only happen if gold stock enthusiasts are prepared to take buy-side action right now in my key $23 to $18 GDX price range with a focus on their favourite individual miners!
Stewart Thomson is a retired Merrill Lynch broker. Stewart writes the Graceland Updates daily between 4am-7am. They are sent out around 8am-9am. The newsletter is attractively priced and the format is a unique numbered point form. Giving clarity of each point and saving valuable reading time.
Risks, Disclaimers, Legal
Stewart Thomson is no longer an investment advisor. The information provided by Stewart and Graceland Updates is for general information purposes only. Before taking any action on any investment, it is imperative that you consult with multiple properly licensed, experienced and qualified investment advisors and get numerous opinions before taking any action. Your minimum risk on any investment in the world is: 100% loss of all your money. You may be taking or preparing to take leveraged positions in investments and not know it, exposing yourself to unlimited risks. This is highly concerning if you are an investor in any derivatives products. There is an approx $700 trillion OTC Derivatives Iceberg with a tiny portion written off officially. The bottom line:
Are You Prepared?
Gold and gold stocks have enjoyed an excellent rebound since their December lows. Over the past six weeks Gold rebounded from a low of $1238 all the way to $1365 in recent days. The miners meanwhile rebounded nearly 18% (GDX) and 21% (GDXJ). However, these markets are approaching important resistance levels and at a time when sentiment is becoming stretched and the US Dollar has become very oversold.
Take a look at the charts of Gold, GDX and GDXJ. Gold has reached the September 2017 highs while GDX came within 2%-3%. GDXJ is lagging but came within less than 5%. Another round of buying over a few days should be enough to push the miners to resistance.
Recent strength in Gold and gold stocks is mostly due to weakness in the US Dollar which is very oversold and approaching important support. On Friday, the US Dollar Index touched 88, which marks the 2009 and 2010 peaks and is the only real support between the low 80s and the low 90s. We also plot Gold against foreign currencies (Gold/FC) which tells if Gold is rising in real terms or if its rising due to the US Dollar weakness. Gold/FC failed to break above key resistance. That signals that over the short-term, Gold would be vulnerable to a bounce in the US Dollar.
Some sentiment indicators suggest the rebound in precious metals could be in its later innings. Thursday the daily sentiment index for Gold hit 91% bulls. Friday, the daily sentiment index for the greenback hit 10% bulls. The CoT’s are not as extreme. Gold’s net speculative position (relative to open interest) is 40% bulls. The 2011, 2012 and 2016 peaks were around 55% bulls. Meanwhile, Silver’s net speculative position is at 26% bulls.
Gold and gold stocks have enjoyed a great rebound since the Fed rate hike but technicals and sentiment suggest they are due for a pause or correction. The miners and Gold are very close to the resistance levels we noted in a recent editorial. Recent strength has been driven mostly by weakness in the US Dollar which is very oversold and testing support. Meanwhile, the daily sentiment index has reached short-term extremes for Gold and the greenback. The odds appear to favor a pause in this rebound or a short-term correction. That is great news for anyone who missed the rally as it would setup a decent buying opportunity before a major breakout. We continue to seek the juniors that are trading at reasonable values but have fundamental and technical catalysts that will drive increased buying. To follow our guidance and learn our favorite juniors for 2018, consider learning more about our premium service.
The rally in Gold and gold mining stocks easily surpassed our expectations and targets. The strength has been far more than we anticipated. The gold stocks blew past their 200-day moving averages while Gold blew past $1300/oz. Now it is time to take a technical look and focus on the key support and resistance targets.
The strength of the rebound pushed the miners well beyond their 200-day moving averages and to their June and October highs. GDX is consolidating just below $24 while GDXJ is consolidating just below $35. If this consolidation turns into a correction then GDX and GDXJ could find support at their 200-day moving averages which are at $22.71 and $33.37 respectively. As you can see, should GDX and GDXJ be able to exceed recent peaks then they could rally towards important resistance levels. Those are $25.50 for GDX and $38 for GDXJ.
The rally has been just as strong in Gold as it surpassed resistance in the $1300-$1310/oz zone. Gold closed the week at $1322/oz. Should Gold pause or correct here then the sellers could push the market down to previous resistance but now current support at $1300-$1310/oz. Trendline resistance will come into play near $1340/oz while the 2016 and 2017 peaks would provide resistance in the $1350-$1370/oz zone.
While we are at it, let us take a look at Silver which exploded past resistance in the mid $16s. Silver will face resistance first at $17.75 then at $18.50. A break above $17.75 and the red trendline is the first step for Silver. The second would be reaching $18.50, a new 52-week high. Next week Silver will face immediate resistance around $17.30 (the October and November highs) but it will have strong support in the mid to upper $16s.
The precious metals complex has made important progress in recent weeks. Markets have broken key resistance levels and have showed no signs of slipping anytime soon. Gold is holding above previous resistance at $1300-$1310/oz while not being far from multi-year resistance in the mid to upper $1300s. The gold mining stocks have reclaimed their 200-day moving averages while consolidating tightly beneath the June and October highs. If and when GDX and GDXJ break those levels then they will be only one step away from a full blown bull market. That step is breaking above the September highs.
Back in early 2016 as precious metals rebounded, our work showed that gold stocks were arguably the cheapest they had ever been. They had the worst 5-year and 10-year rolling performance ever, they were trading at potentially 40-year lows on a price to cash flow basis, they were the cheapest ever relative to the stock market and Gold and most notably, the Barron’s Gold Mining Index was trading at the same level as 42 years ago! The gold stocks enjoyed a massive recovery in 2016 but it was short lived as the sector corrected and then consolidated (far from the highs) for over a year. Although we have a tendency to be too conservative at times, over a month ago we noted a historical pattern that bodes extremely well for gold stocks over the next few years. That outlook is reinforced by the continued historic value in the gold stocks as exhibited by the following charts.
First, we focus on the long-term rolling performance in the gold stocks. The chart below plots the S&P TSX Gold Index (data obtained from Global Financial Data) along with its rolling 5-year and 10-year performance. By that metric, the gold stocks (going back +80 years) were the most oversold in late 2000 and early 2016. If we were to run a 15-year and 20-year rolling performance then the three most oversold periods would be late 2000, early 2016 and the late 1950s. The gold stocks enjoyed massive long-term returns from the late 1950s and the year 2000.Next we compare the gold stocks to the stock market. We plot the S&P TSX Gold Index against the S&P 500. The ratio appears to be in position to form a double bottom or a higher low as compared to its 2016 low. The 2016 low (in the chart below) is second by a tick to the 2000 low as to when the gold stocks relative to the stock market were the cheapest ever. (However, the Barron’s Gold Mining Index against the S&P 500 did make an all-time low in January 2016). In any case, the gold stocks right now are likely trading at the 97th percentile (out of 100) as far as value relative to the stock market.
Next is one of my favorite charts. We compare the valuation in the stock market with the performance in the gold stocks. We plot the CAPE Ratio along with the S&P TSX Gold Index. The gold stocks performed fabulously after the CAPE Ratio reached major peaks in 1929, 1966 and 2000. The gold stocks bottomed several years prior to the CAPE peak in 1966 and perhaps we are seeing a repeat of that now. The gold stocks bottomed in early 2016 though the CAPE ratio has continued to rise. We hear plenty of talk about future returns being very low and there being no place to invest. To that, I present this chart!
Next we plot the gold stocks relative to Gold. We use both of the historical gold stock indices, (the S&P TSX Gold Index and the Barron’s Gold Mining Index). By the end of 2015 the gold stocks were historically cheap by many metrics. Interestingly, that includes Gold even though Gold itself at the time was down 45%!
Finally, the last chart shows how cheap Gold potentially is. It’s important because the gold stocks could be very cheap when Gold itself may not be cheap. This was somewhat the case in 2012-2013 and that is why gold stocks remained a deep value for several years. However, since then Gold has become so much cheaper relative to the money supply, monetary base, equities, and even bonds. The chart below is from GoldMoney. They plot Gold against FMQ which is the quantity of fiat money.
When we step back from the day to day and week to week wiggles in the gold stocks, we need to realize that a historic low is in place (January 2016) and after a nearly 18-month long correction and consolidation the sector remains extremely and extraordinary cheap on a historical basis. This, and not the wiggles in charts or market sentiment ensures that forward returns in the sector will be strongly positive. Those tools help with market timing and spotting risks and opportunities. While the recent low in gold stocks may be more significant than we think, history suggests a very strong second half of 2018 for the gold stocks. Moving forward, the key for traders and investors is to find the companies with strong fundamentals with value and catalysts that will drive buying. To follow our guidance and learn our favorite juniors for 2018, consider learning more about our premium service.
Too many technical analysts dismiss fundamentals. True, technicals usually lead fundamentals but understanding the fundamental drivers (when it comes to Gold) can give you an edge. Gold and gold stocks have remained below their 2016 peaks even in the face of a very weak US Dollar because the fundamentals are not there. Real rates have been stable in 2017 while the yield curve has been flattening. Until things change, Gold and gold stocks have little chance to breakout.
If you follow my work you know that there is a strong inverse correlation between the Gold price and real interest rates. Gold performs best when real rates are declining and especially when real rates decline while in negative territory. Real rates declined sharply into and during 2016 but have been rising or stable this year. The current problem for Gold is nominal yields have trended higher and faster than the rate of inflation.
In the chart below we plot Gold, the real 5-year yield (as calculated from the TIPS market) and the real Fed Funds Rate (rFFR). The US Treasury provides daily data of the real 5-year yield and we can see that it has trended higher since summer 2016 and is currently at its highest levels since Q1 2016. It has advanced nearly half a percent since its low a few months ago. Meanwhile, the rFFR has increased by more than 1% this year. That was after falling by nearly 2%.
As we discussed weeks ago, a steepening yield curve (caused by falling short-term rates or rising long-term rates) is bullish for Gold. Some gold bugs are excited about a flattening yield curve as it could lead to inversion. While this may be true, a flattening curve is not bullish for Gold. Below we see that the yield curve continues to plunge (flatten) as the 2-year yield has surged and the 10-year is at the same level as two months ago. A bullish development for Gold would be the 5-year and 10-year yields exploding above their March 2017 highs while the 2-year yield arrests its torrid rise.
Gold and gold stocks are going to continue to struggle until the fundamentals align bullishly. Market action will of course lead fundamental changes but knowing the drivers to look for can help us anticipate the fundamental changes in advance. We think rising inflation is more likely than falling short-term rates to be the driver for Gold in 2018. In that case, we would anticipate hard assets to perform better, long-term rates to rise faster than short-term rates and inflation to outpace short-term rates. These things would sustain Gold beyond just a few months. In the meantime, the key for traders and investors is to find the companies with strong fundamentals and seek oversold situations with value and catalysts that will drive buying. To follow our guidance and learn our favorite juniors for 2018, consider learning more about our premium service.
Gold cleared $1300 early in the week and padded its gains on Friday even amid a bullish weekly reversal in the US Dollar. Gold’s breakout was validated by a strong monthly close on Thursday and then a strong weekly close Friday. As predicted, the miners perked up with the breakout in Gold. GDX and GDXJ gained nearly 6% and 7% respectively for the week. Look for the miners to continue to trend higher as Gold attempts to retest its 2016 highs around $1375/oz.
The miners (GDX and GDXJ) have more immediate upside potential. The daily line charts show two levels of resistance. The first level is around $26 for GDX and $38 for GDXJ while the second level is $28 for GDX and $40-$41 for GDXJ.
While Gold closed well above $1300 at $1330/oz, it faces resistance at the 2016 highs around $1375/oz. The net speculative position has reached 248K contracts or 46% of open interest. As the chart below shows, the 2016, 2012 and 2011 peaks in Gold all coincided with a net speculative position of 55% of open interest. If current trends continue, the net speculative position could reach 55% as Gold tests $1375/oz.
Circling back to the stocks, we see that our mini-GDXJ index, which consists of 26 stocks and has a median market cap of ~$100 Million closed the week at a +6 month high. The exploration juniors have led the entire sector this year and we expect that to continue. The price action is healthy as the index is trading above its 50-day, 200-day and 400-day moving averages which are all sloping higher. The index closed at 206 and should reach resistance at 215-220. A correction from there (perhaps in October) could setup a push to the 2016 high.
Three weeks ago we discussed how Gold needed to perform considering the US$ index was likely to bounce due to an oversold condition and extreme bearish sentiment.
We wrote: “Simply put, Gold will have to prove itself in real terms if it is going to hold its ground or breakout as the US$ begins a likely bounce.”
The US$ index has enjoyed only a slight rebound but Gold has maintained its 2017 US$ weakness induced gains because of its strong relative performance. Below we plot the daily line chart of Gold and a number of ratios: Gold against foreign currencies (Gold/FC), Gold against Equities and Gold against Bonds. Since the July low, Gold has showed good nominal and relative performance.
The key has been the strong rebound in Gold/FC and the breakout in Gold/Equities. Gold/FC has broken above two trendlines and is now testing its 200-day moving average. Meanwhile, Gold/Equities has broken above one trendline and has regained its 200-day moving average. It would be very bullish for Gold if Gold/FC pushed through its 200-day moving average while Gold/Equities pushed above trendline 2. Those moves would likely accompany a Gold breakout through $1300/oz but more importantly, they would put Gold in a position of trading above its 200-day moving average in nominal terms and against the major asset classes (stocks, bonds, currencies).
Although Gold failed to break above $1300/oz today (Friday), it remains in position to do so because of its renewed strength in real terms. As long as the US$ index does not rally hard, we expect Gold to break above $1300 and reach $1375. The gold stocks as a group have been lagging recently but in the event of a Gold breakout, we foresee significant upside potential as the group could play catch up. Consider learning more about our premium service including our favorite junior exploration companies.

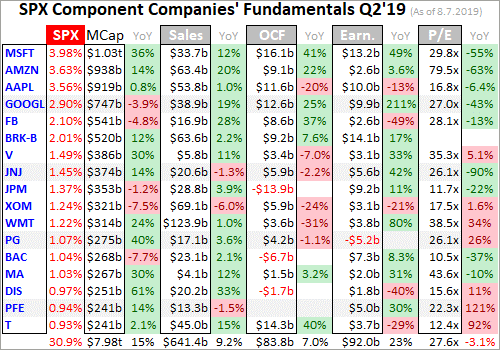

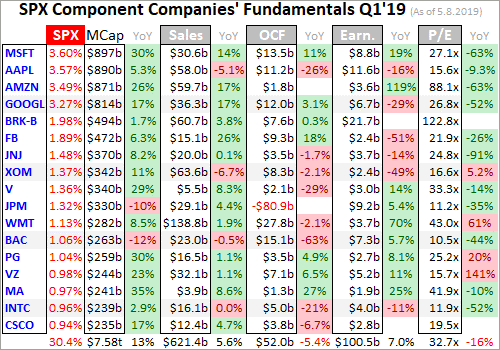
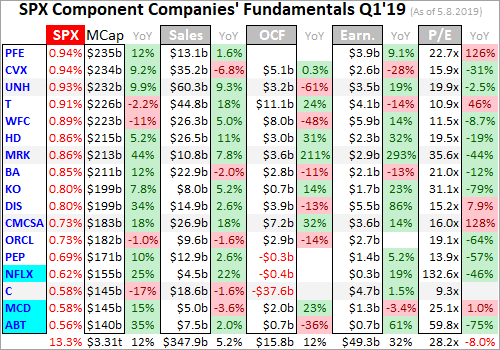
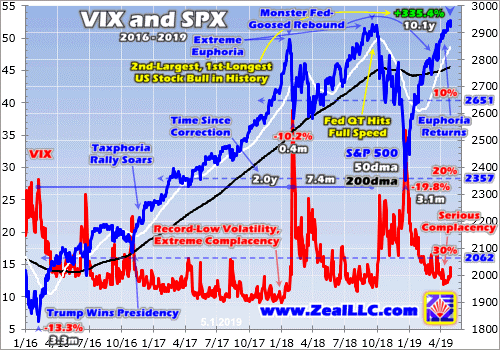
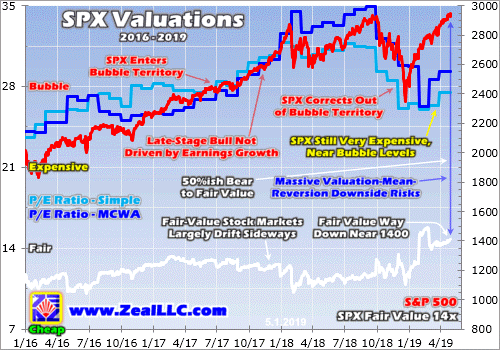
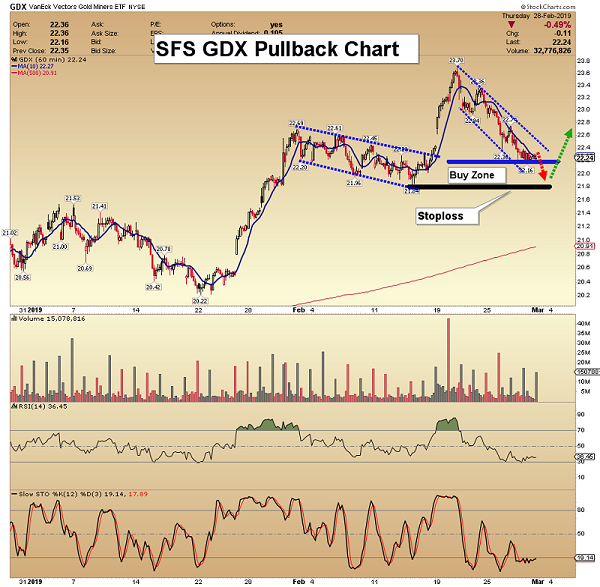
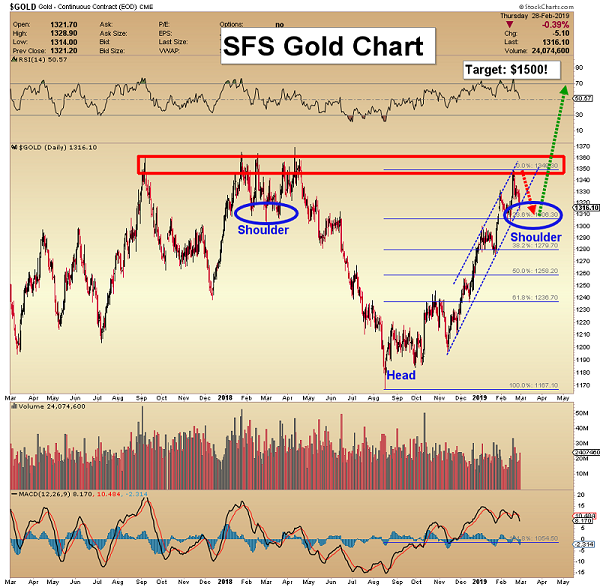
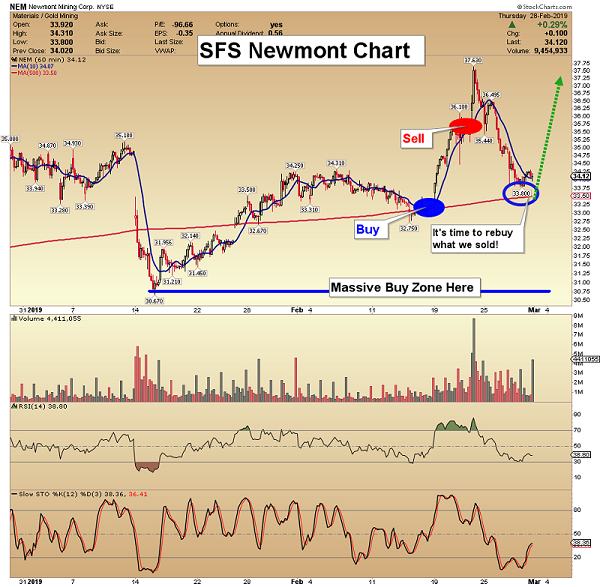
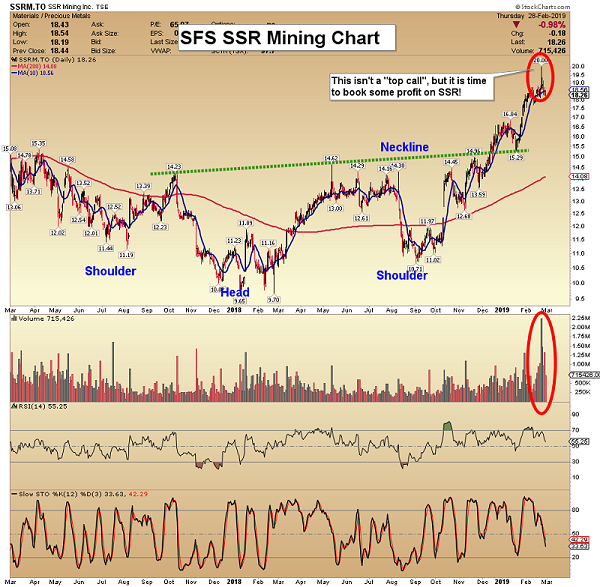
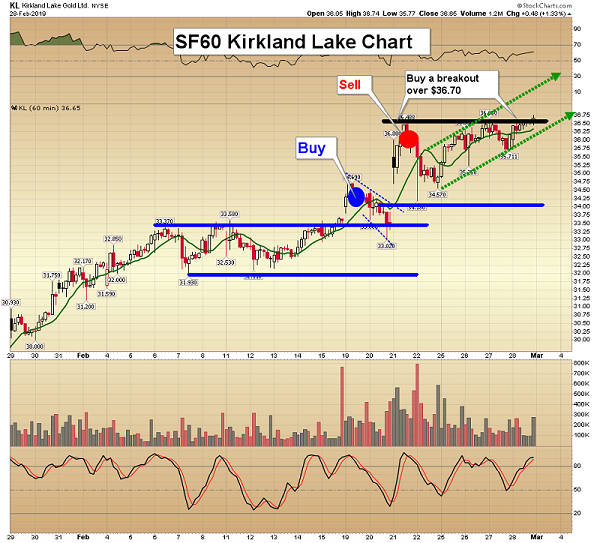
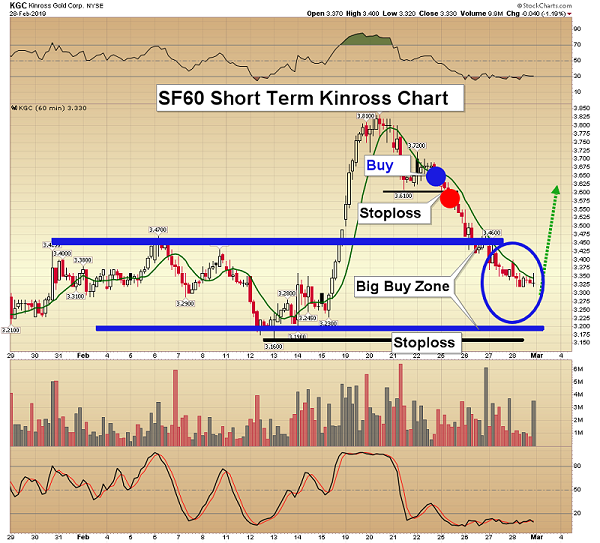
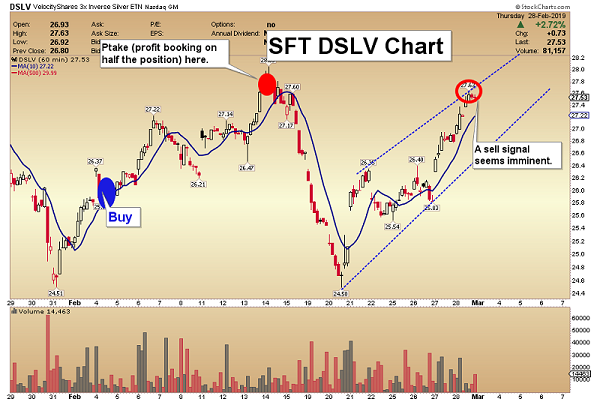
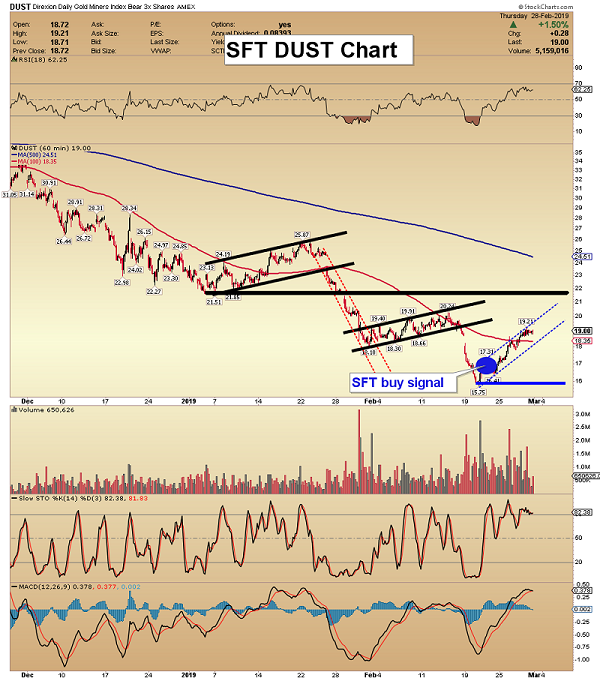
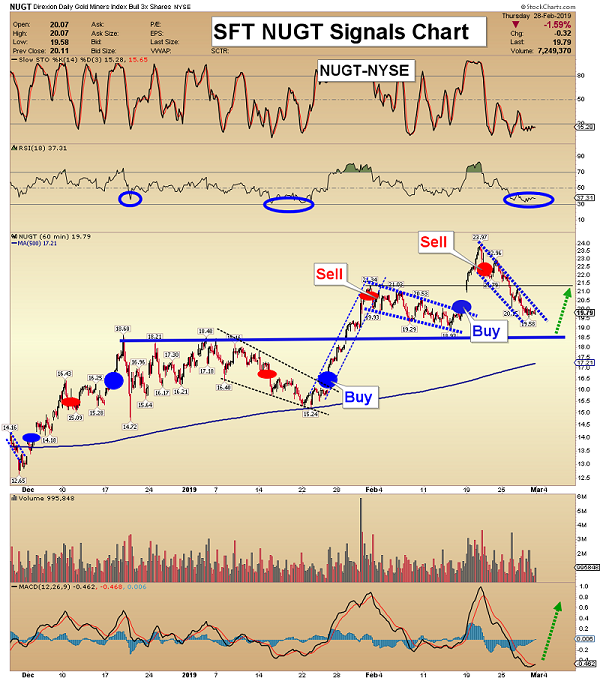
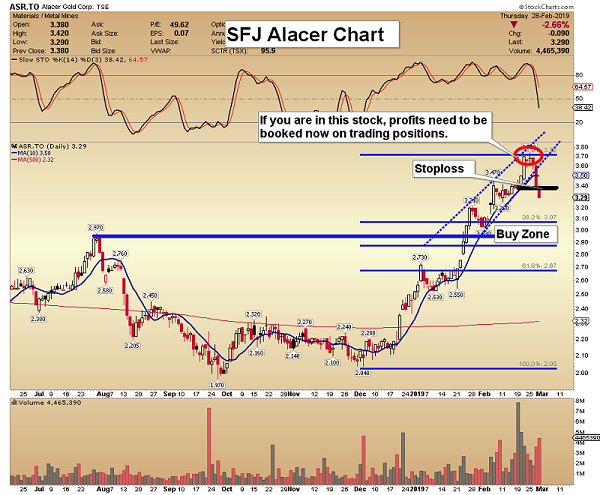
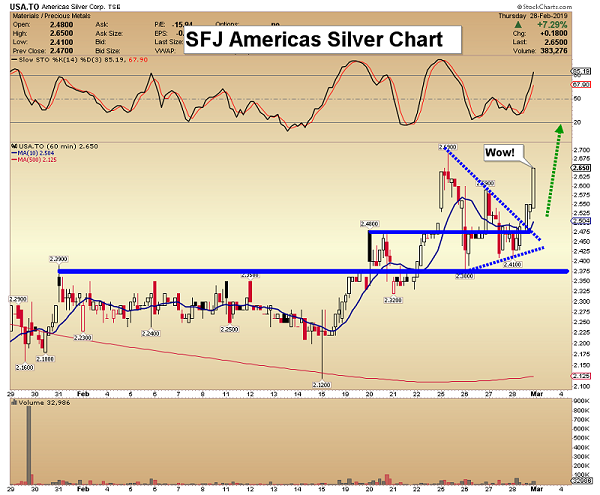
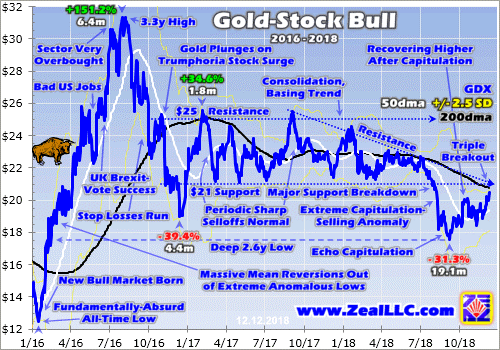
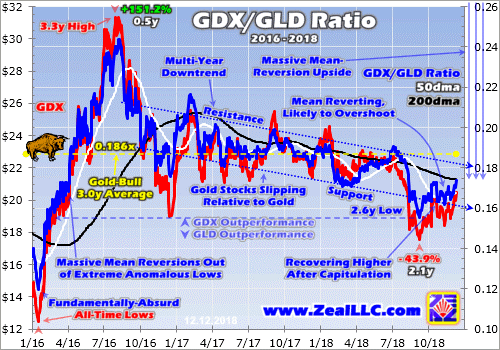
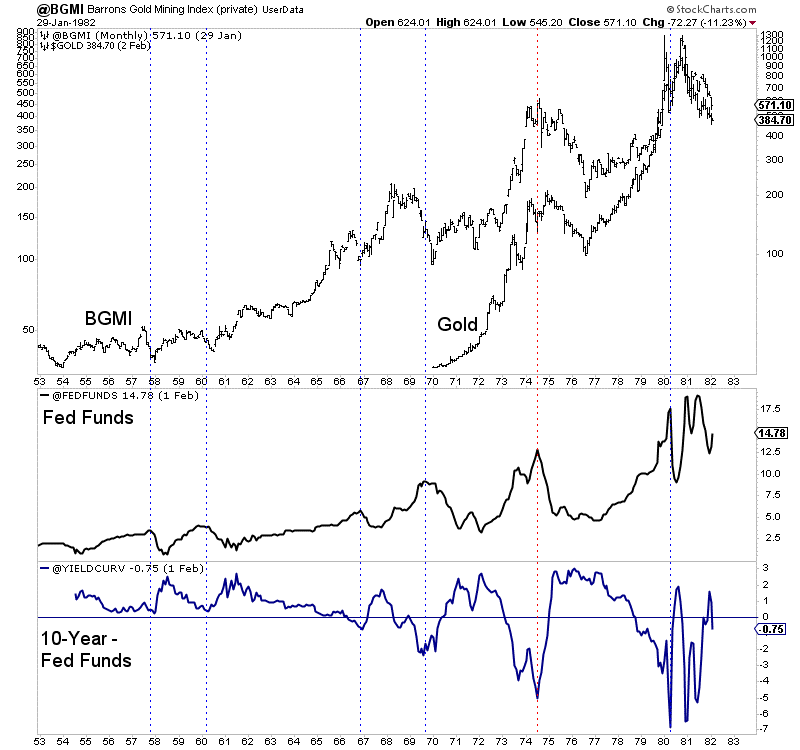
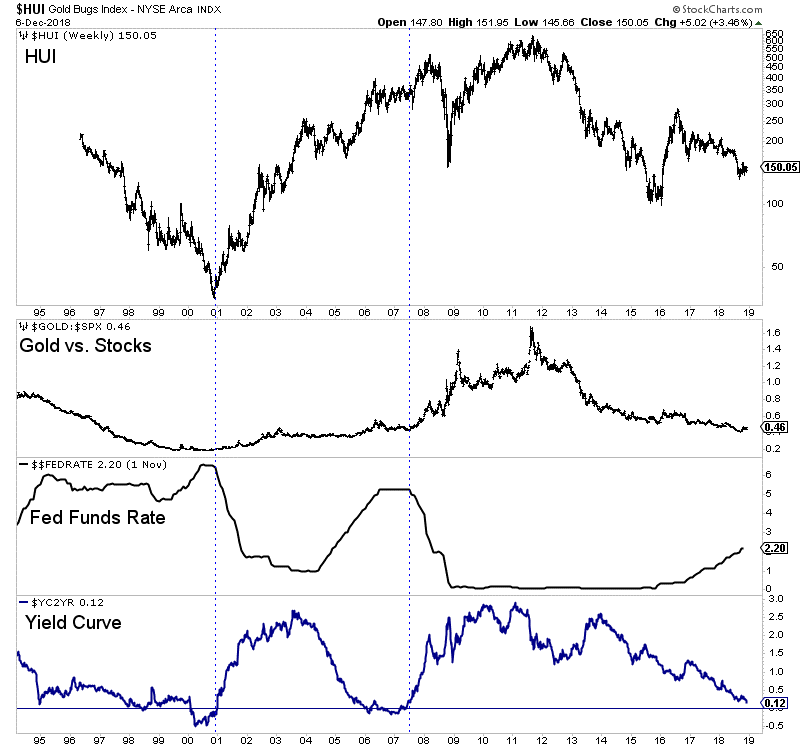
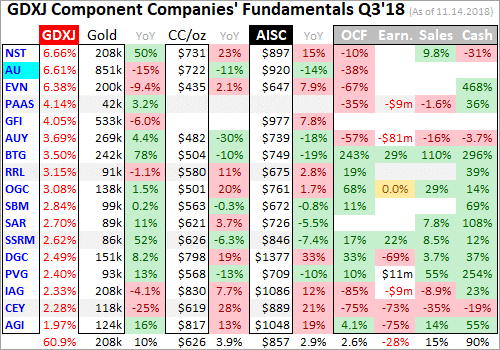
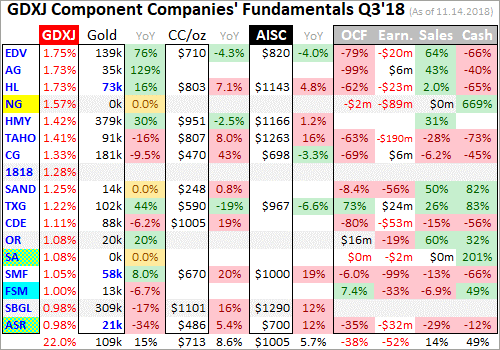


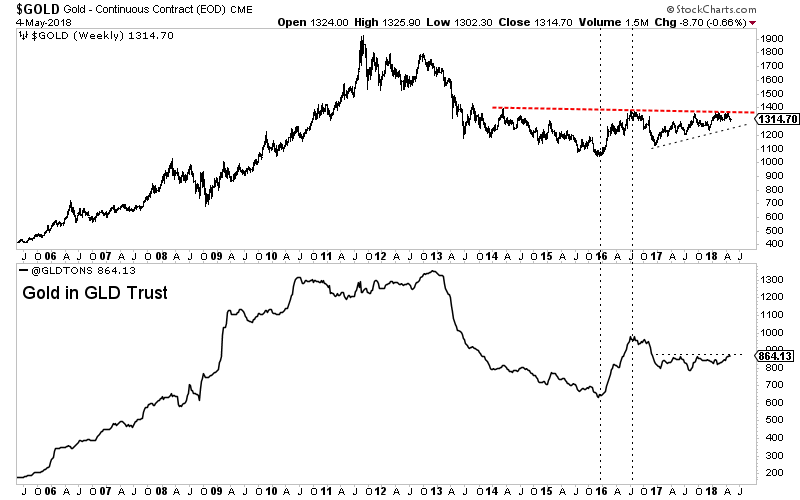
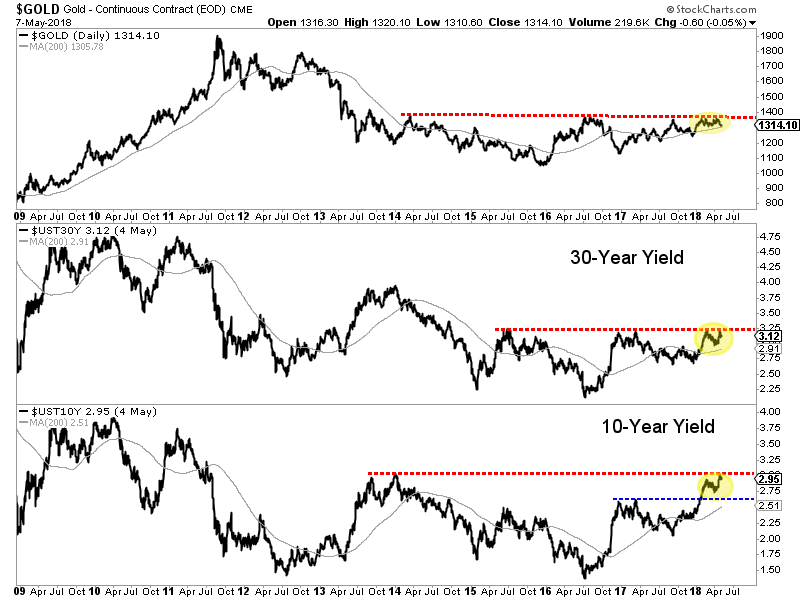
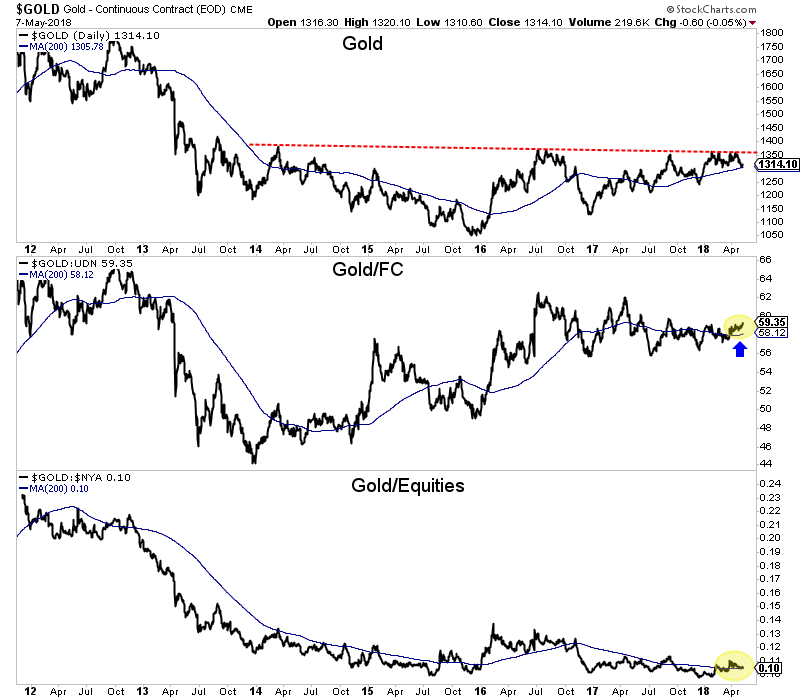
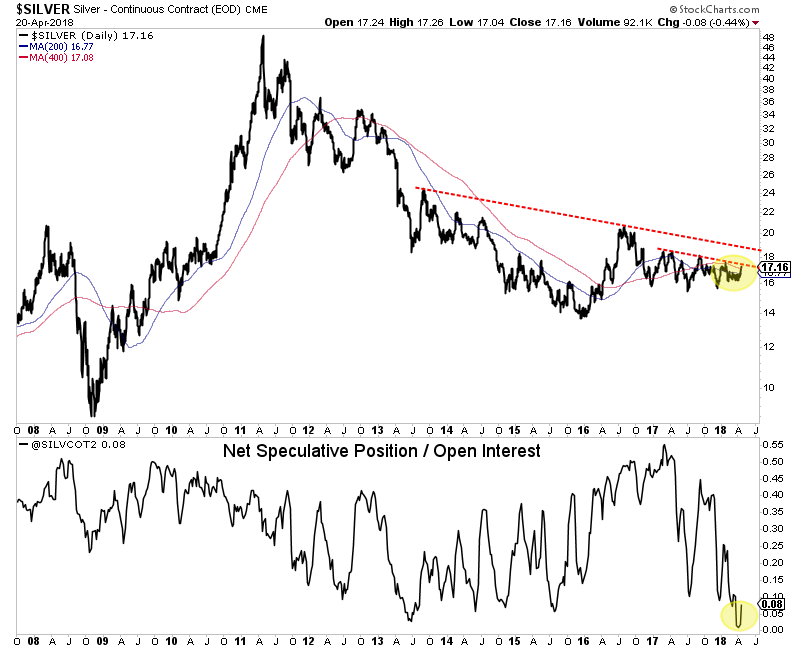
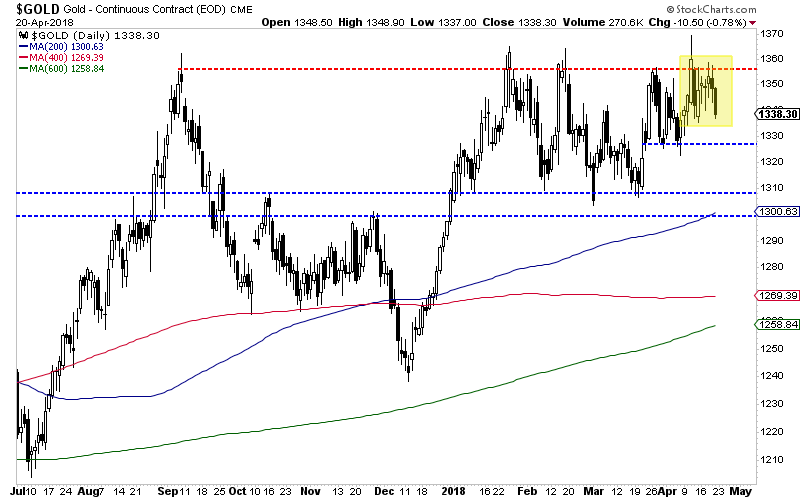
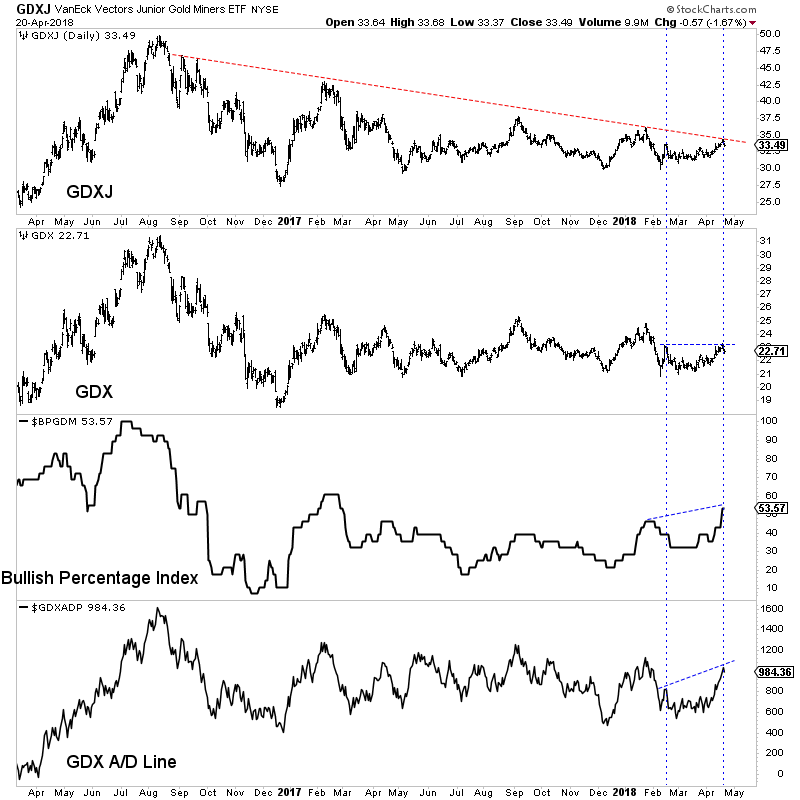

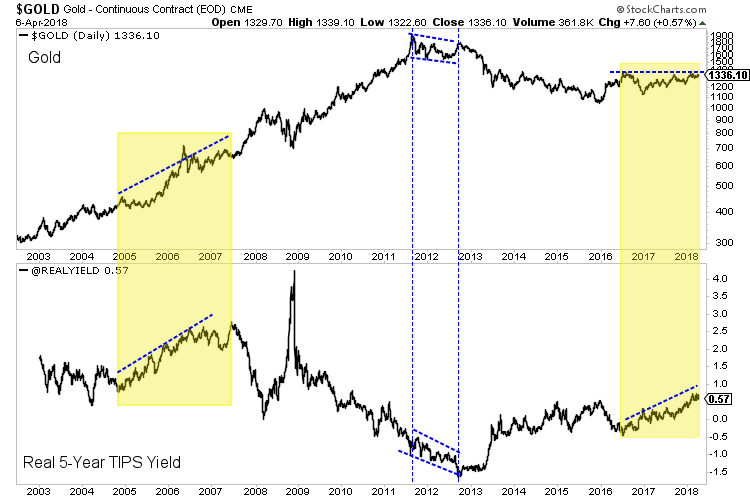
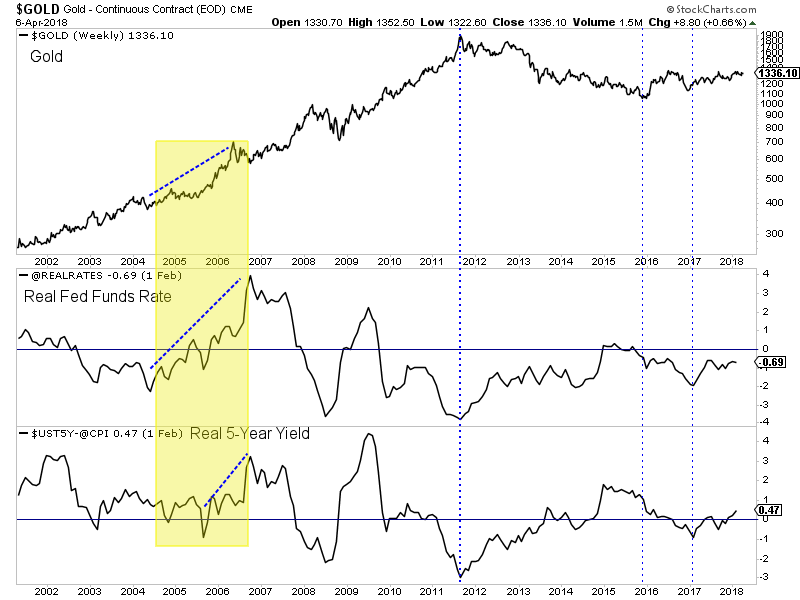

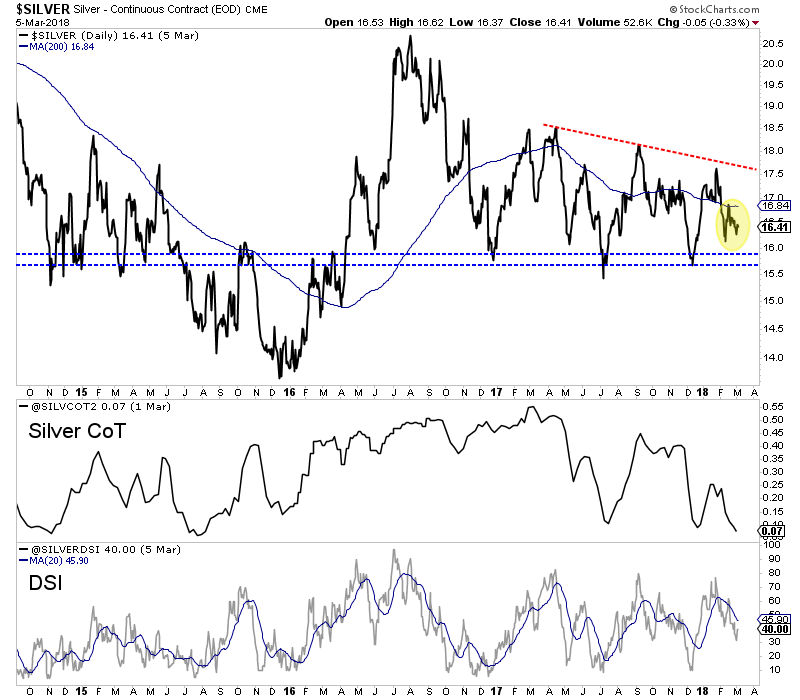

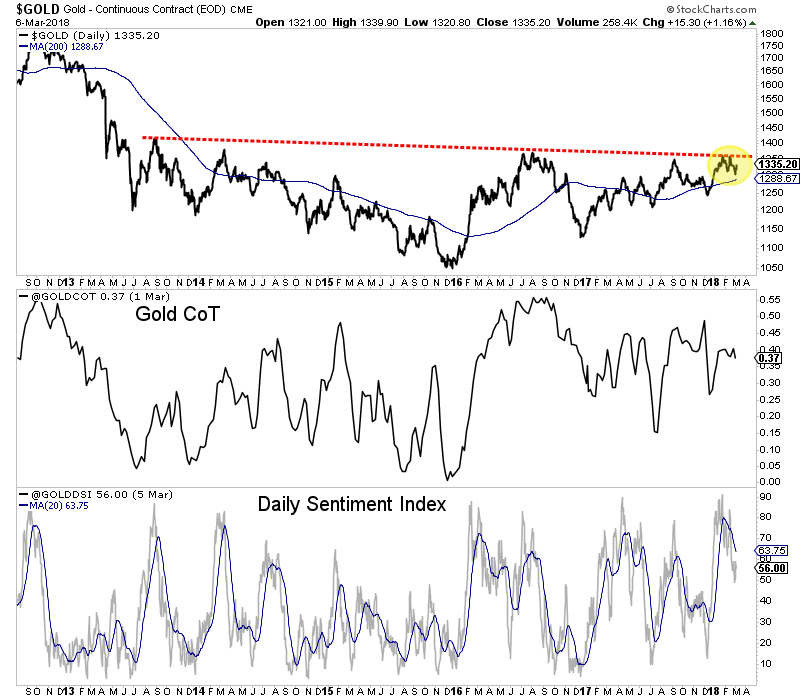

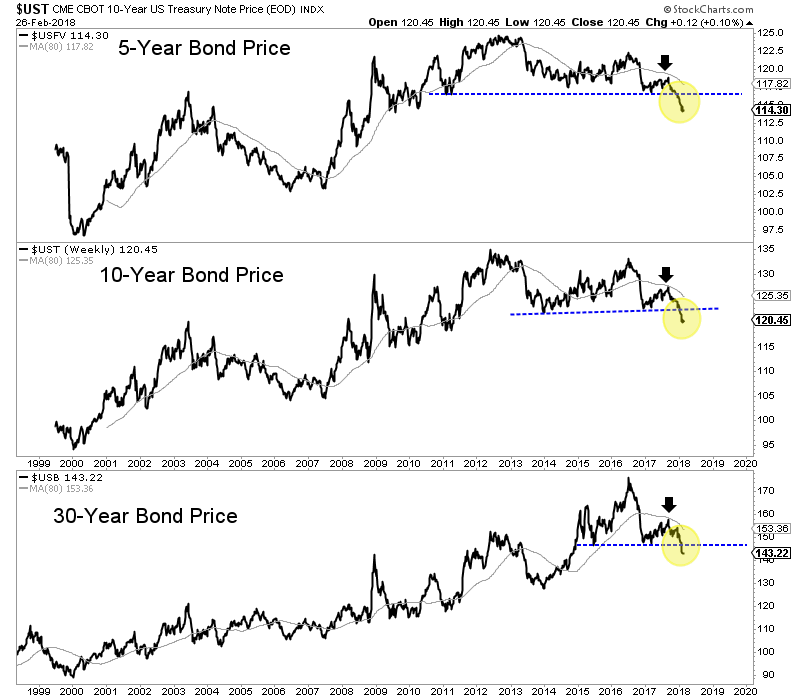
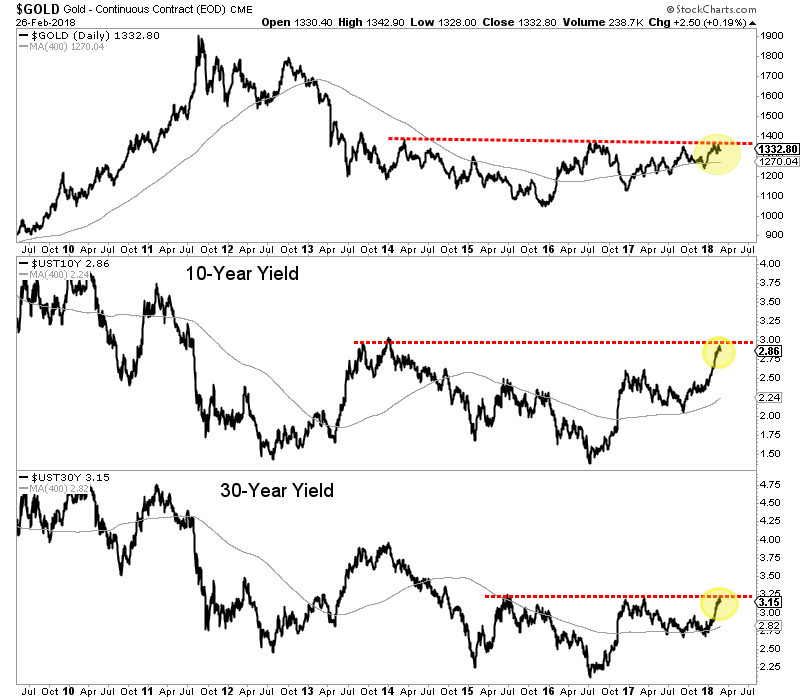


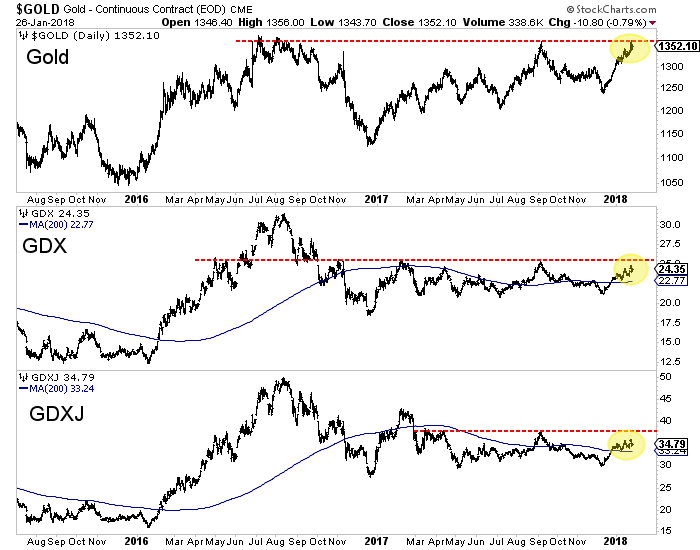
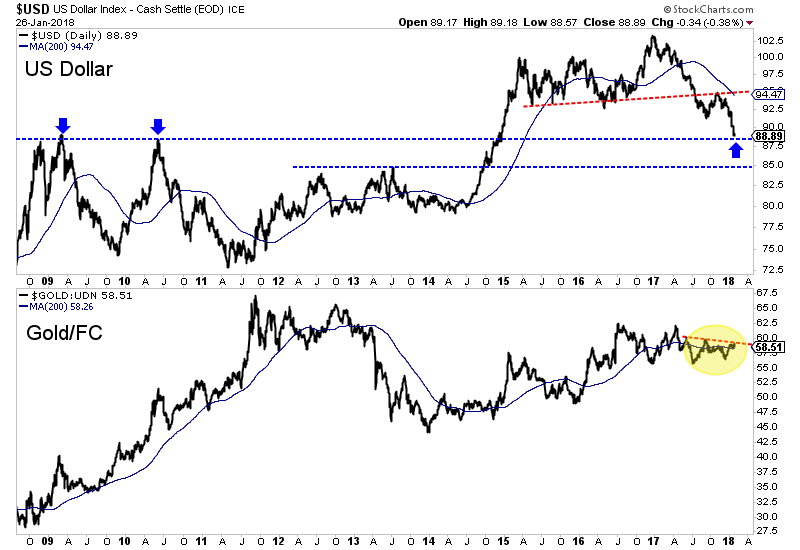

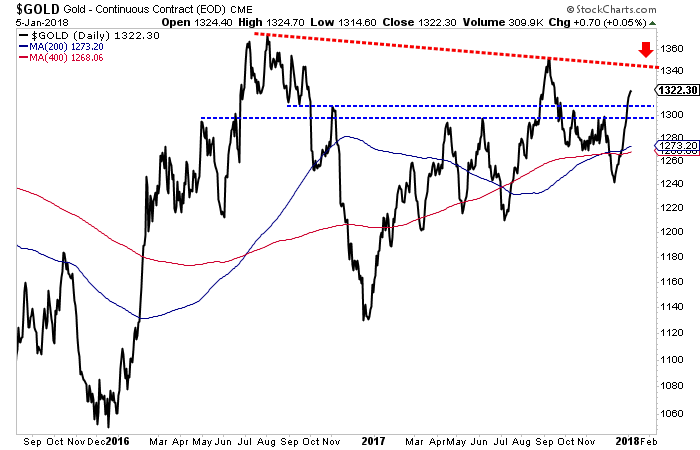
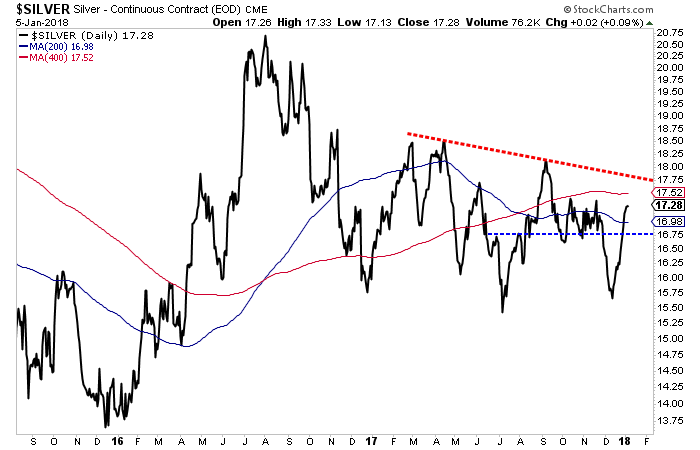
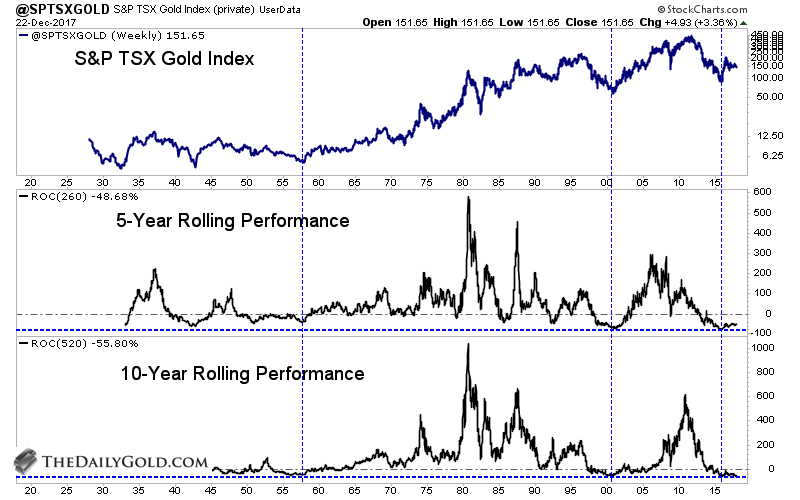
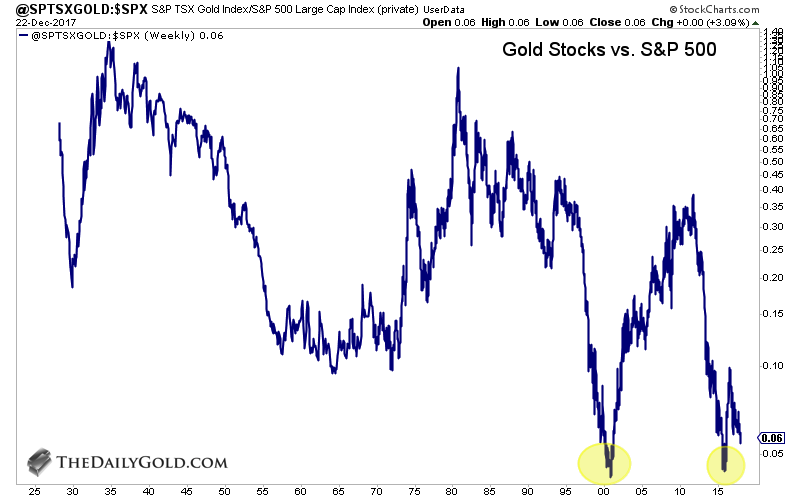
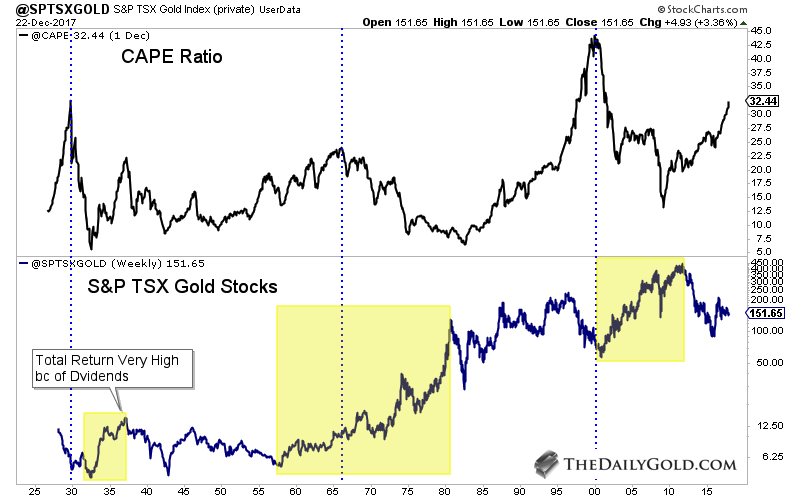
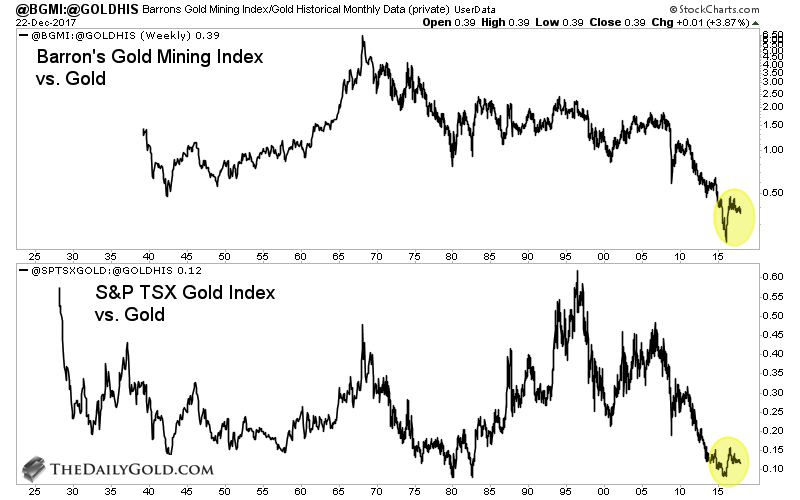
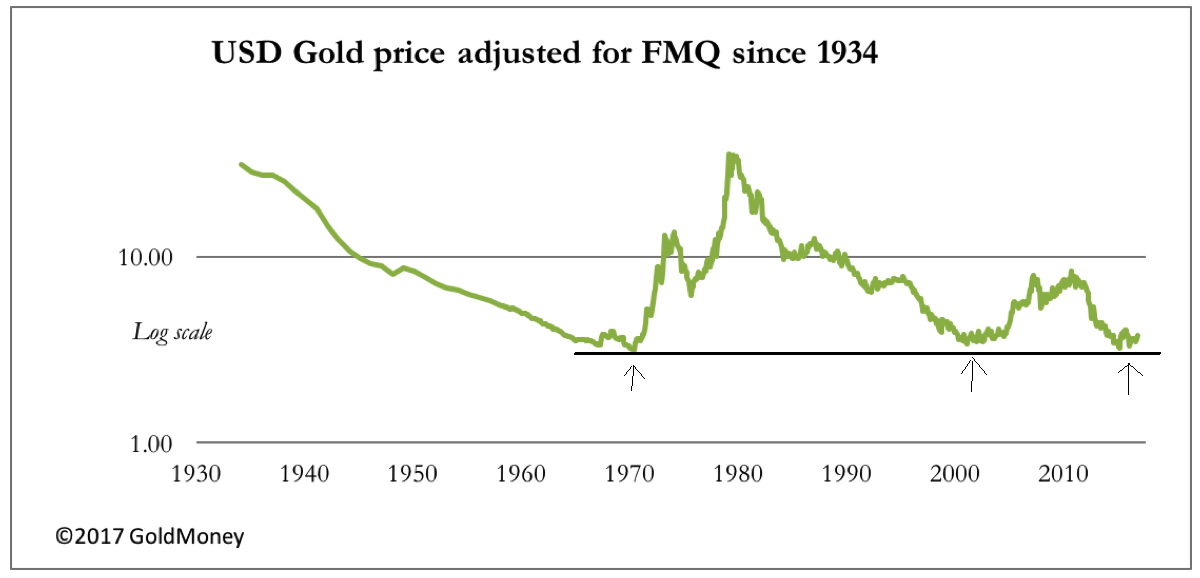

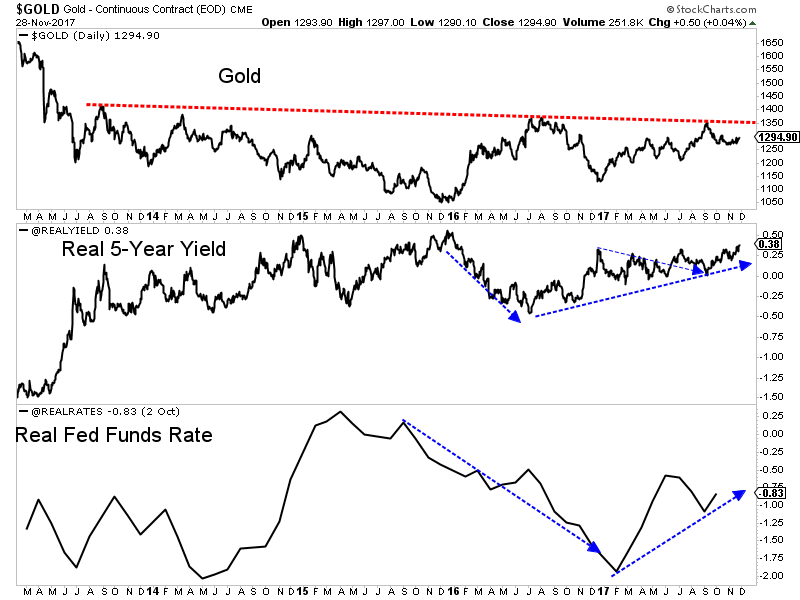
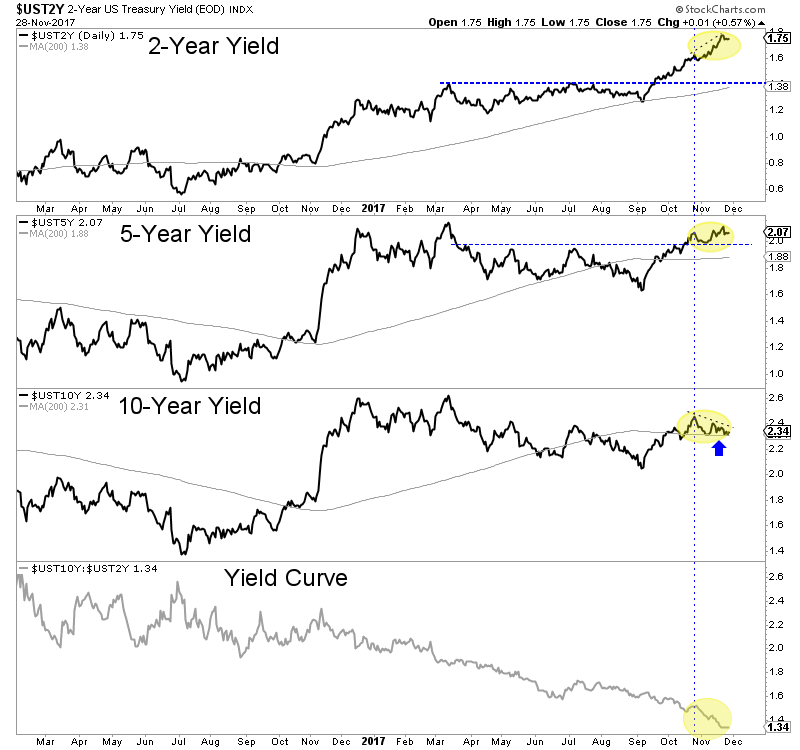
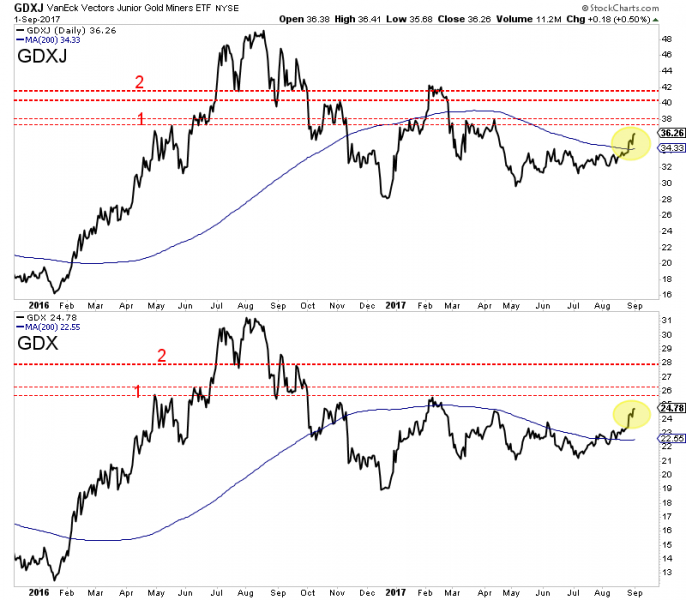
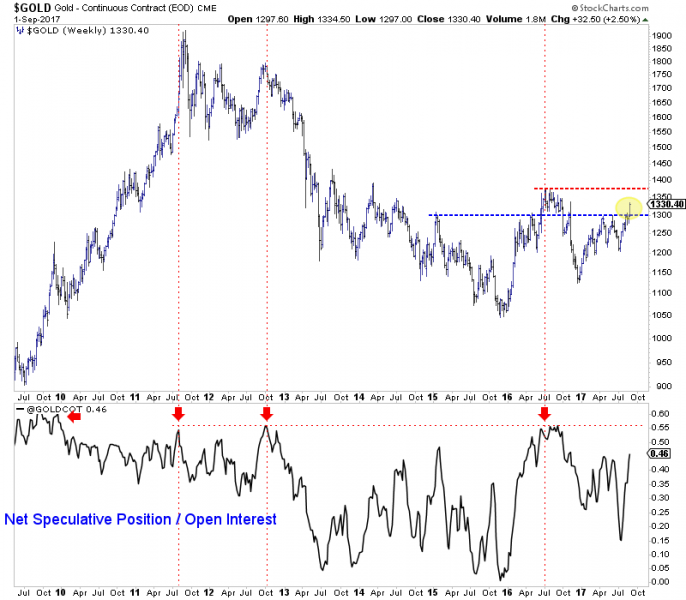
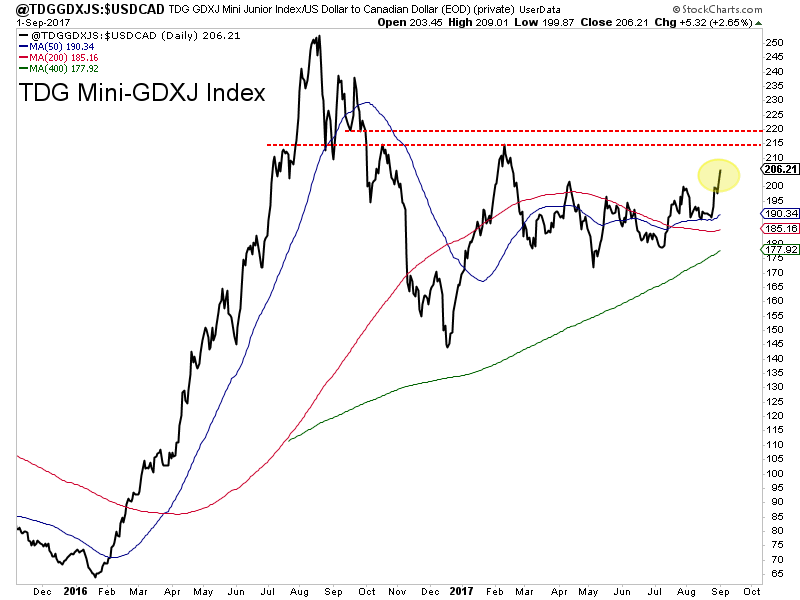

 Follow us on Twitter
 Become our facebook fan


