

Gold has firmed above $1300 in recent days and is holding comfortably above $1300 for now. We think the market will break to the upside sometime this year. The question is when. Here are 3 things to watch that will tell us if Gold is on the cusp of that break-out soon or later.
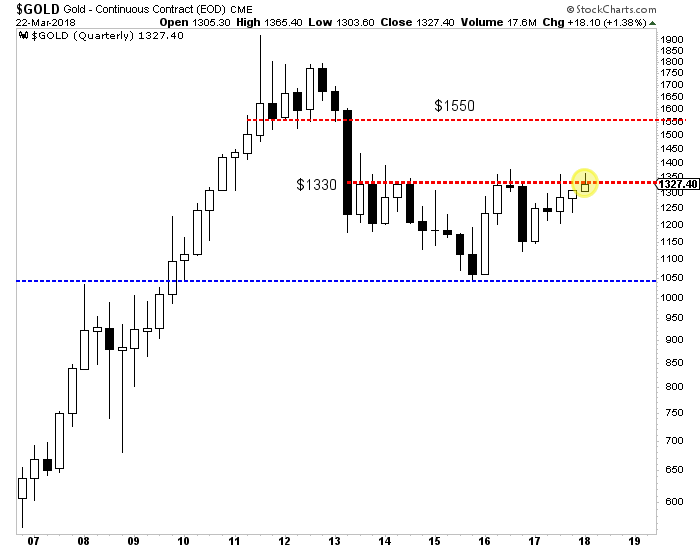
First, keep your eye on Gold’s close at the end of next week. It’s not only the end of the week and month but also the end of the quarter. While Gold has traded above $1350 multiple times in the past two years, it has not made a quarterly close above $1330 since 2012. Since this is a quarterly time frame, we would need to see a close above $1340 or even $1345 to mark a significant breakout. If Gold can make such a close next Friday then the odds are good that it could break above $1375 fairly soon.
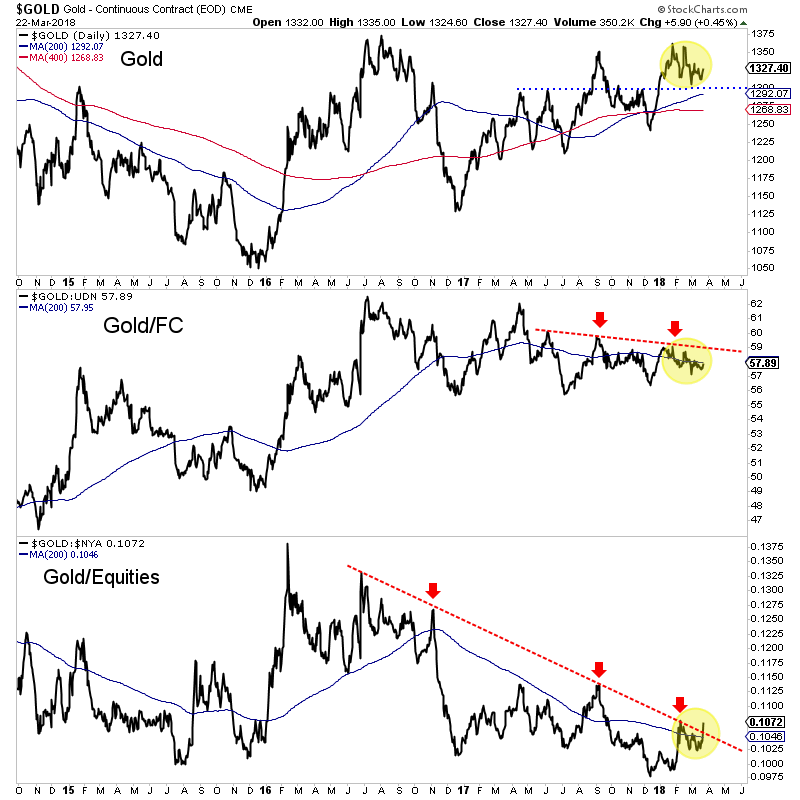
Second, (and I always beat this to death) Gold needs to break its downtrends relative to foreign currencies (FC) and equities. The Gold/equities ratio appears to be breaking out but needs follow through for confirmation. The 200-day moving average in that chart appears to have stopped declining. If the ratio can hold above the 200-day moving average then it’s obviously a bullish sign. Meanwhile, Gold/FC has work to do. Over the last 10 months, it has traded in a tighter and tighter range. That trendline resistance could go hand in hand with resistance at $1365-$1375.
Finally, on the equity side, we want to see if GDX and GDXJ can break above their “A” resistance levels which are roughly $23 for GDX and $34 for GDXJ. The miners have been relatively oversold and with improving breadth (discussed in our premium updates) they could reach the A targets, which are slightly above the 200-day moving averages. If the market is sensing a break-out in Gold then GDX and GDXJ should trend above the A targets while the 200-day moving averages would become support. A move up to the B targets over the next four to six weeks would be very bullish.

GDX, GDXJ (Daily Line Charts)
Of course, the price action in Gold itself will answer the question but these other charts can not only give an early hint but can also inform as to the sustainability of Gold’s strength. The first test will be the quarterly close next week. Then we can monitor if the Gold/equities ratio is holding its breakout and if Gold/FC is strengthening.
We have expected the move to a break-out in Gold could begin sometime in Q3. Let’s keep our eyes peeled on the above charts as the genesis of that move has a chance to begin earlier than expected. In the meantime, we continue to be patient but are accumulating the juniors we think have 500% return potential over the next 18-24 months. To follow our guidance and learn our favorite juniors for the next 12-18 months, consider learning more about our service.
- Several weeks ago, I surprised most investors by issuing my “Book Profits Now!” call for the precious metals asset class.
- When I did so, head and shoulders top formations immediately formed on gold and GDX, and prices have swooned.
- Rumours of a sudden drop in Indian dealer demand appeared to become a concern for commercial traders on the COMEX.
- India’s monsoon season has turned out to be a bit of a “bust”, with both flooding and drought. Farmers buy gold with a portion of their crop profits. With only another week or two left in the monsoon season, crop sales may not be very good.
- Of further concern to me was the fact that the demand drop was occurring as gold arrived at the $1352 resistance zone. That resistance was created by Modi’s cash call-in that took place in November of 2016.
- The upcoming Fed meeting will probably mark the end of the decline related to those concerns, but there could be additional weakness until the next US jobs report is released.
- Please click here now. Double-click to enlarge.
- For investors, this gold chart tells the entire tactical story. The $1270 – $1260 area is the target of the H&S top pattern.
- Investors should use a two-pronged strategy to profit from the coming rally that should take gold back to the “Call-In Day” resistance around $1352.
- I’ve outlined the $1315 – $1295 price area as the first key buy zone. Eager accumulators can buy right now.
- Janet Yellen’s handling of the imminent launch of quantitative tightening (QT) at this Fed meeting is critical.
- It will almost certainly determine whether gold bounces from the $1315 – $1295 buy zone or first proceeds down to the H&S target zone at $1260 -$1270.
- If gold moves to that lower zone, investors need to consider taking more aggressive buy-side action.
- That’s my personal strategy as well as my recommended one for gold bugs around the world.
- Please click here now. Double-click to enlarge this GDX chart.
- The technical picture for GDX is very similar to gold. Note the small but positive wedge pattern. I’ve highlighted it with thick black trend lines.
- While the target of the H&S top pattern is about $22.50 (similar to the $1260 – $1270 target for gold), the wedge formation could send GDX and most gold stocks higher from current price levels.
- Please click here now. Double-click to enlarge this US dollar versus Japanese yen chart. My important 14,7,7 series Stochastics oscillator is now overbought, and that’s happening just ahead of the Fed meeting.
- Heavyweight analysts at Japanese bank Nomura are predicting a collapse in the dollar down to the 105 – 100 target zone by the end of the year.
- That’s also been my target zone for quite awhile, and it’s because the dollar is trading in a rectangle between 108 and 114.
- The technical odds of a breakdown to 100 -105 are about 67%. Also, rallies tend to be week when oscillators become overbought quickly, and that’s what’s happening now.
- Please click here now. This chart tells the entire story for the precious metals asset class. It’s dramatically under owned, and there’s a beautiful double bottom pattern in play.
- Gold and associated assets are clearly poised for an enormous increase in institutional ownership. I call it “The Golden Wave”. This buying is not event-based. It’s based on portfolio allocation to gold as an asset class, and that means the buying will be sustained.
- Gold bugs around the world can use my key prices zones of $1315 – $1295 and $1260 – $1270 now to get tactically positioned in key gold stocks to surf the golden institutional wave!
Stewart Thomson is a retired Merrill Lynch broker. Stewart writes the Graceland Updates daily between 4am-7am. They are sent out around 8am-9am. The newsletter is attractively priced and the format is a unique numbered point form. Giving clarity of each point and saving valuable reading time.
Risks, Disclaimers, Legal
Stewart Thomson is no longer an investment advisor. The information provided by Stewart and Graceland Updates is for general information purposes only. Before taking any action on any investment, it is imperative that you consult with multiple properly licensed, experienced and qualified investment advisors and get numerous opinions before taking any action. Your minimum risk on any investment in the world is: 100% loss of all your money. You may be taking or preparing to take leveraged positions in investments and not know it, exposing yourself to unlimited risks. This is highly concerning if you are an investor in any derivatives products. There is an approx $700 trillion OTC Derivatives Iceberg with a tiny portion written off officially. The bottom line:
Are You Prepared?
If you would like to receive our free newsletter via email, simply enter your email address below & click subscribe.
 Follow us on Twitter
 Become our facebook fan
CONNECT WITH US
Tweets
Tweet with hash tag #miningfeeds or @miningfeeds and your tweets will be displayed across this site.
MOST ACTIVE MINING STOCKS
Daily Gainers
 CMC Metals Ltd. CMC Metals Ltd. |
CMB.V | +900.00% |
 Eden Energy Ltd Eden Energy Ltd |
EDE.AX | +200.00% |
| GoviEx Uranium Inc. |
GXU.V | +42.86% |
| Eagle Nickel Ltd. |
ENL.AX | +41.67% |
| Citigold Corp. Limited |
CTO.AX | +33.33% |
| Mount Burgess Mining NL |
MTB.AX | +33.33% |
| Exalt Resources Limited |
ERD.AX | +31.94% |
| Casa Minerals Inc. |
CASA.V | +30.00% |
| Cariboo Rose Resources Ltd |
CRB.V | +28.57% |
| Belmont Resources Inc. |
BEA.V | +28.57% |


