

Precious Metals continue to be a conundrum. While Gold has trended lower it has failed to break below $1100 as so many expect. It is very strong against foreign currencies and did not break to a new low even as the US$ index rallied from 87 to 100. On the other hand, Gold has failed to sustain any bullish momentum. The gold stocks are even more oversold and have formed some higher lows since last November. Yet, they have failed to sustain any bullish developments and are far from reaching a higher high. Only time will tell which way the sector will break and how its bear market will conclude.
There are several things in the chart below to discuss. Aside from the price action in Gold, we plot the net speculative position in the COT and Gold’s volatility index (GVZ). The immediate weekly resistance for Gold is $1220 followed by $1250-$1260, where there is a strong confluence of resistance. Support is at $1180 and $1150.
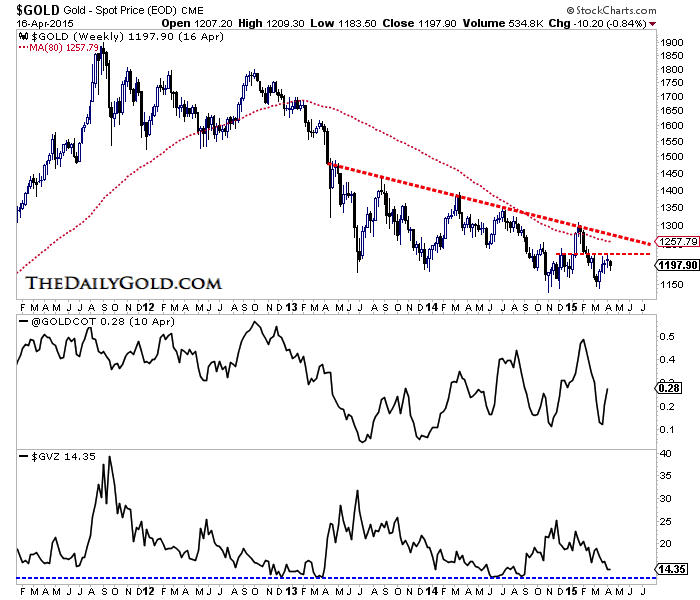
One reason Gold has struggled to get traction to the upside could be the relatively high net speculative position. If the net position was much lower then Gold would encounter much less selling after every rally or pop higher. Whether by time or price, the speculative position needs to decline for Gold to have a better shot at sustaining a rebound.
Gold’s volatility has declined since last November and is nearing the important lows seen in summer 2014 and early 2013. Periods of low volatility will ultimately lead to periods of rising volatility. That can accelerate market moves. Keep an eye on May and June as to when volatility could begin to increase.
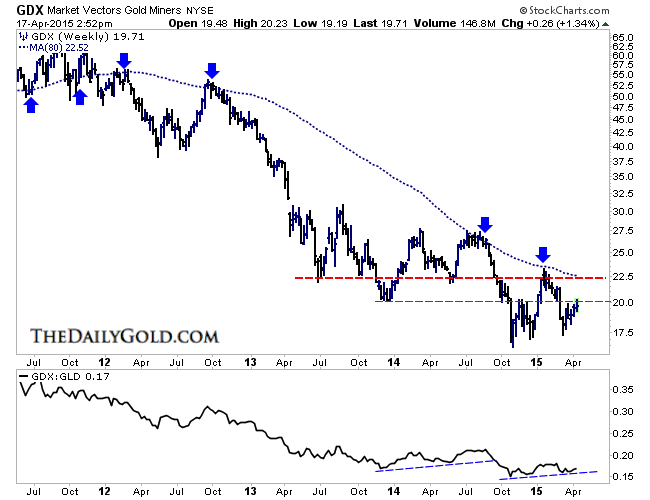
Meanwhile, the gold miners are looking more constructive than Gold and that should not be a surprise. The mining sector peaked months before Gold in 2011 and also should benefit from the collapse in Oil as well as severe weakness in local currencies.
The key for the miners (GDX in this case) is the confluence of resistance at $22.50. The 80-week moving average has been very important support and resistance dating back to 2010. If GDX can break above $20 then it would have a chance to test the 80-week moving average for the third time in the past 11 months. That would be the sign of a market transitioning from bear to bull.
The bear market in precious metals is essentially four years old and a change is soon to be at hand. The question is will it end through a slow transition in the months ahead or will it end soon after Gold loses $1150 and plunges below $1100? Either scenario presents an opportunity. If Gold breaks lower, that would ultimately provide an excellent buying opportunity. If the miners can rally up to the 80-week moving average then that would indicate the sector is in gradual transition from bear to bull.
 Follow us on Twitter
 Become our facebook fan


Comments are closed.