


Readers know that I have beaten this drum all too often. Gold’s major fundamental driver is declining or negative real rates. There is a strong inverse correlation because Gold is money. That’s what JP Morgan said and he’s far more qualified to understand than quotable celebrities like Mark Cuban. But I digress.
When real rates are increasing or strongly positive (during most of the 1980s and 1990s and 2011 through 2015) Gold performs poorly because one can earn a real return on their money unlike with Gold. However, when real rates decrease and particularly when they are negative, Gold flourishes. That being said, right now there is an interesting development. Real rates have increased over the past year but Gold has held steady. Reviewing recent history can help us answer which is right.
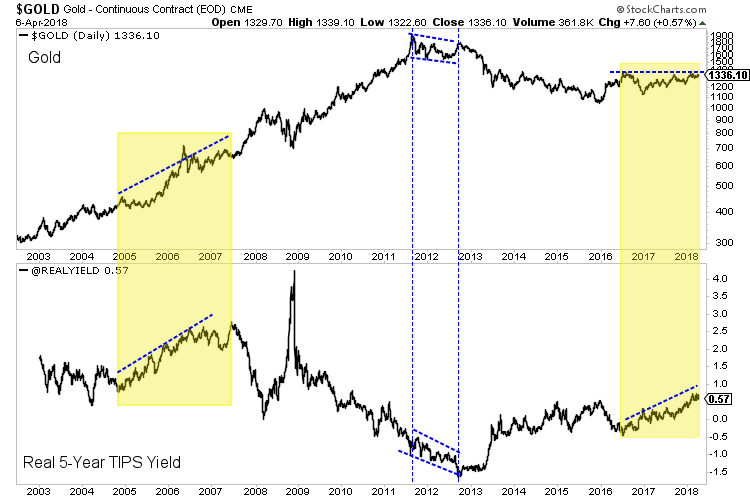
First we look at a market-based indicator for real rates (yields). The US Treasury publishes this data daily as calculated from the TIPS market. Below we plot Gold along with the real 5-year TIPS yield, which recently touched an 8-year high. Interestingly, Gold has held up well. Note that there were two previous, similar divergences. Gold peaked in 2011 even though the real 5-year yield did not bottom until 2012. From 2005 to 2006 Gold made a significant break to the upside yet the real 5-year yield also increased during that time. Both times Gold was right.
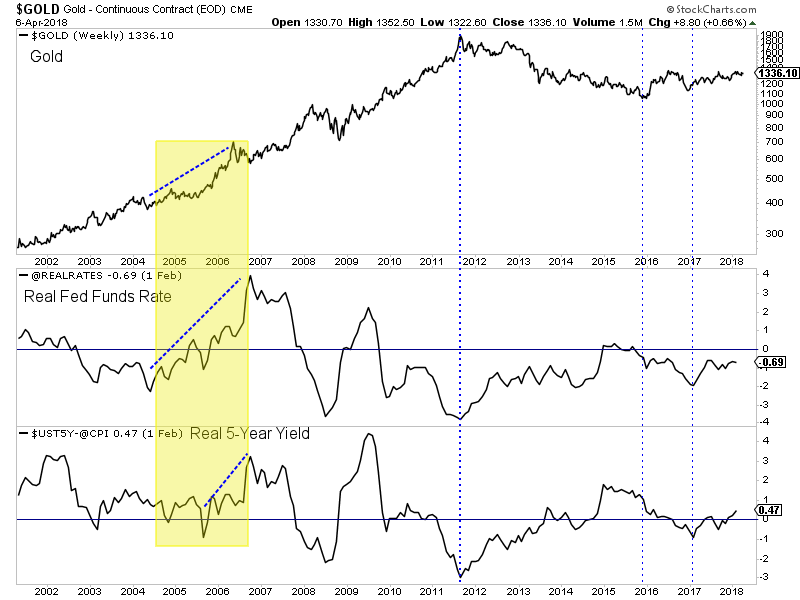
 Market-based indicators are great but in the context of real rates, the basic calculation has proven to be a better indicator for Gold. In this chart we plot Gold along with the real fed funds rate (inflation less the fed funds rate) and the real 5-year yield (inflation yess the 5-year yield). Note that both statistics peaked in 2011 at exactly the same time as Gold. Both have increased since the start of 2017 (along with Gold) but are nowhere close to the 8-year high that the real 5-year TIPS yield is. The TIPS market is exaggerating the strength of real yields.
Ultimately it remains to be seen which is right (Gold or real rates) but the past tells us to side with the market (Gold) rather than a fundamental indicator. The market is a discounting mechanism.
Gold holding steady despite an increase in real rates could be a bullish signal just as Gold declining amid falling real rates would be concerning. Perhaps Gold is discounting the likelihood that real rates have peaked and the risk of a sharp decline in real rates in 2020. In any case, those who focus too much on real rates and not the message of the market could risk missing out on a huge break to the upside. In anticipation of that move we continue to accumulate the juniors that have 300% to 500% upside potential over the next 18-24 months. To follow our guidance and learn our favorite juniors for the next 12-18 months, consider learning more about our premium service.
 Follow us on Twitter
 Become our facebook fan


Comments are closed.